

Introduction #
The authors of the dataset present a collection of overhead images of wind turbines along with corresponding YOLOv3 formatted labels for object detection. The labels provide essential information, such as the class, x and y coordinates, and the height and width of the bounding boxes for each wind turbine in the respective image.
The motivation behind this work is to explore the application of deep learning in the analysis of energy infrastructure. The authors aim to extend this approach to encompass various types of energy infrastructure, creating a comprehensive pipeline for in-depth energy infrastructure analysis. Such an analysis could offer valuable insights for energy access decision makers, enabling them to make informed choices on how to provide electricity to non-electrified regions, considering options like grid extension, micro-grids, or localized power generation.
For data acquisition, the images were sourced from the Power Plant Satellite Imagery Dataset. Subsequently, these images were carefully hand-labeled and transformed into properly formatted labels. The authors then performed data preprocessing, resizing the images to smaller dimensions of 608x608 and adjusting their corresponding labels accordingly, following the YOLOv3 format.
 Homepage
Summary #
Overhead Imagery of Wind Turbines is a dataset for an object detection task. Possible applications of the dataset could be in the energy industry. The dataset presented here is not the original one. Learn more on the dataset’s homepage.
The dataset consists of 2065 images with 6396 labeled objects belonging to 1 single class (wind turbines).
Images in the Overhead Imagery of Wind Turbines (by Duke Dataplus2020) dataset have bounding box annotations. There are 512 (25% of the total) unlabeled images (i.e. without annotations). There are 2 splits in the dataset: train (1652 images) and val (413 images). The dataset was released in 2020.
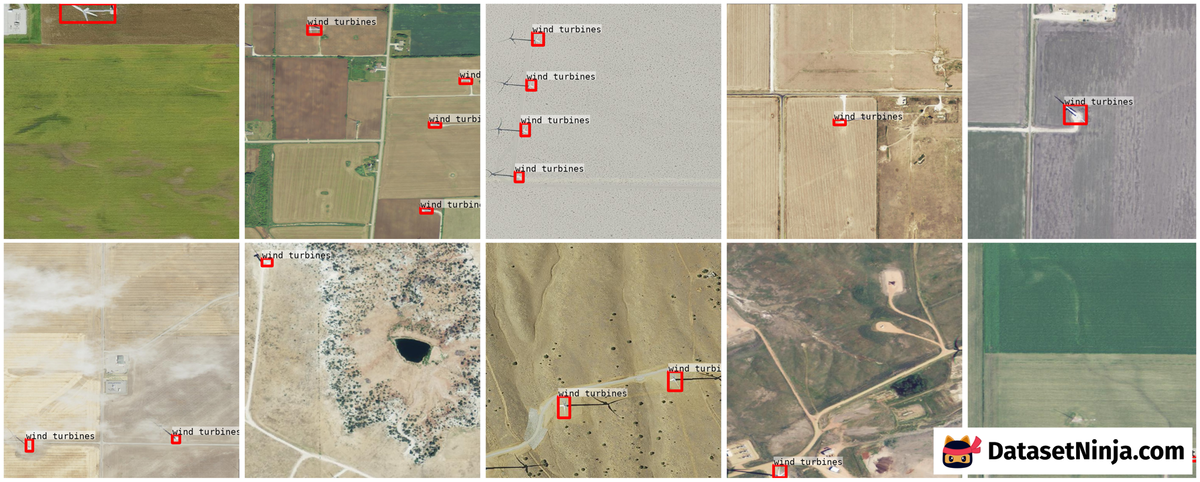
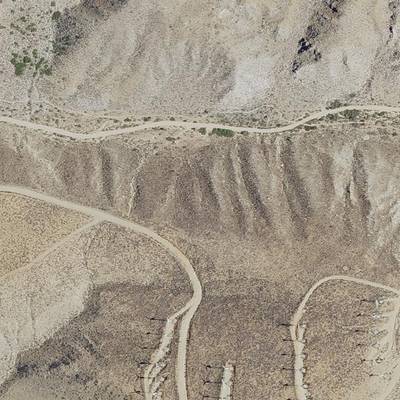
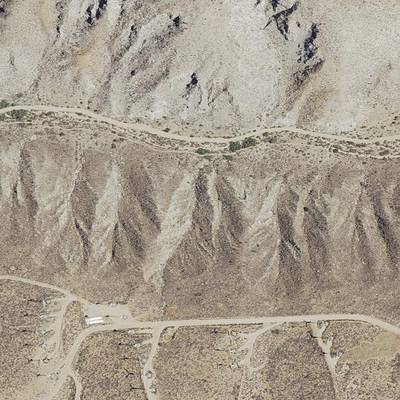
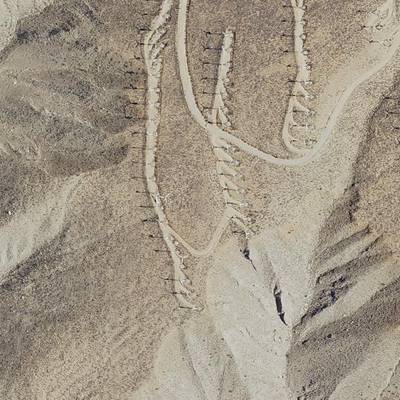
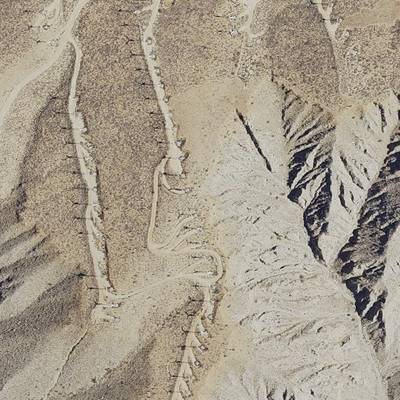
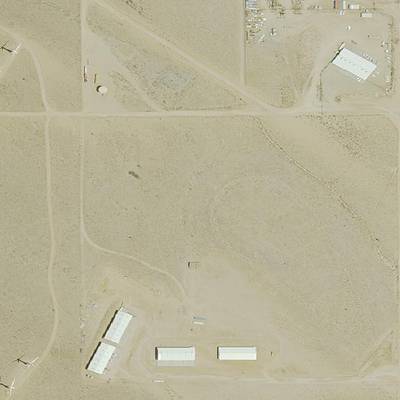
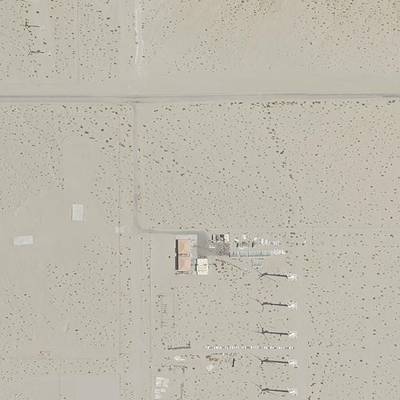
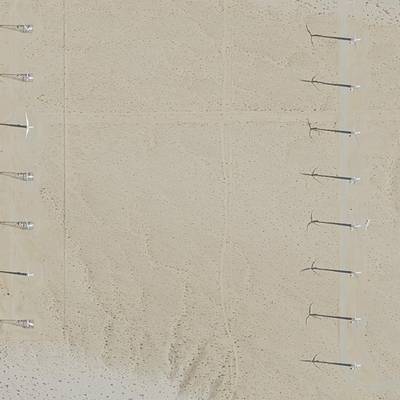
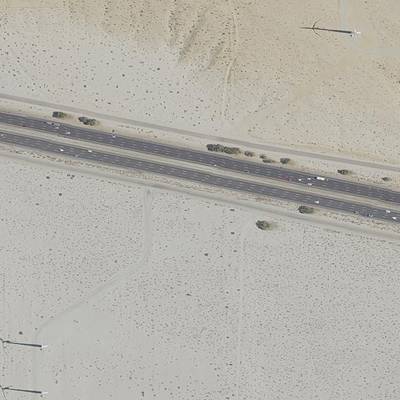
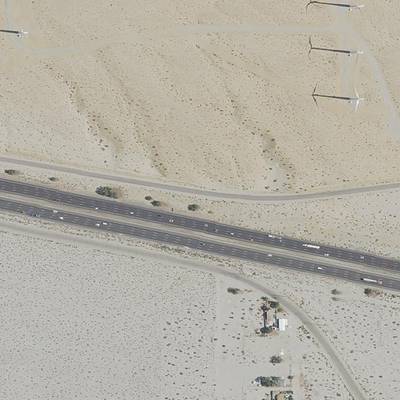
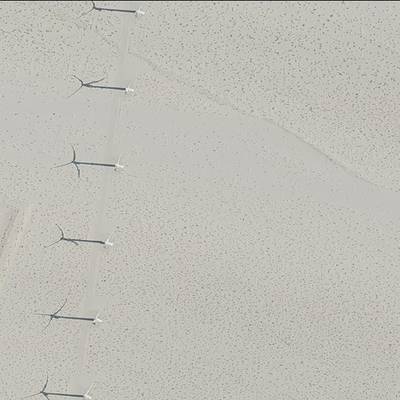
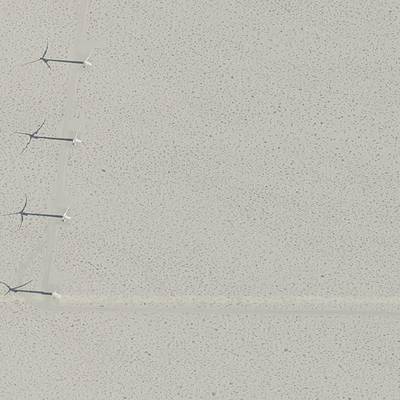
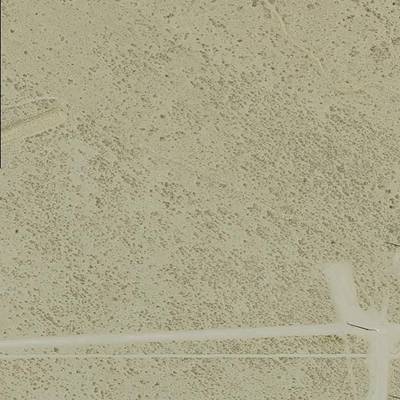
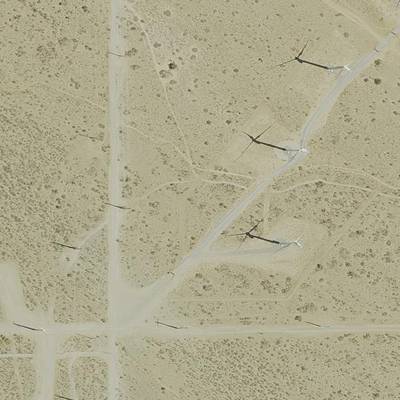
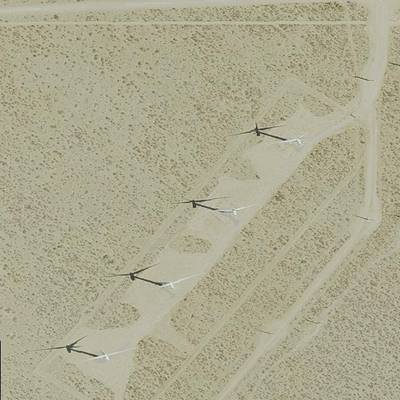
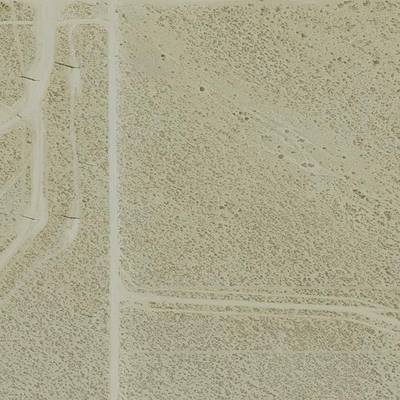
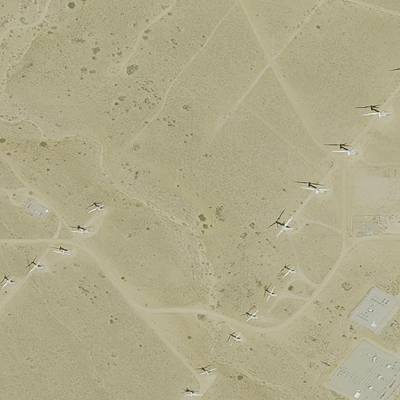
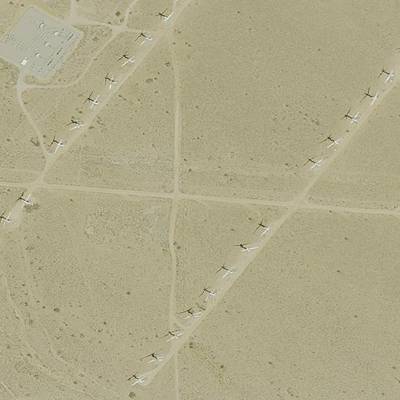
Here is the visualized example grid with annotations:
Explore #
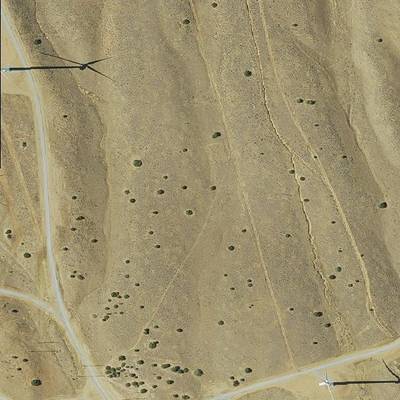
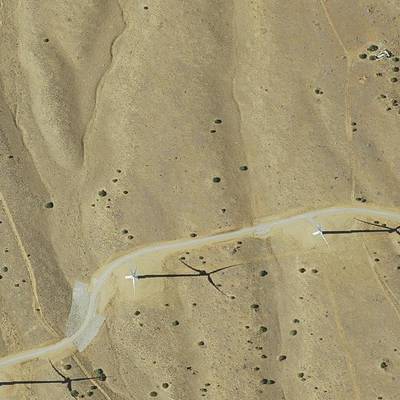
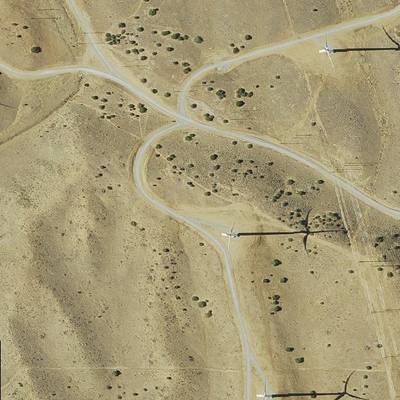
Overhead Imagery of Wind Turbines (by Duke Dataplus2020) dataset has 2065 images. Click on one of the examples below or open "Explore" tool anytime you need to view dataset images with annotations. This tool has extended visualization capabilities like zoom, translation, objects table, custom filters and more. Hover the mouse over the images to hide or show annotations.


Class balance #
There are 1 annotation classes in the dataset. Find the general statistics and balances for every class in the table below. Click any row to preview images that have labels of the selected class. Sort by column to find the most rare or prevalent classes.

Class ㅤ | Images ㅤ | Objects ㅤ | Count on image average | Area on image average |
|---|---|---|---|---|
wind turbines➔ rectangle | 1553 | 6396 | 4.12 | 0.92% |
Images #
Explore every single image in the dataset with respect to the number of annotations of each class it has. Click a row to preview selected image. Sort by any column to find anomalies and edge cases. Use horizontal scroll if the table has many columns for a large number of classes in the dataset.
Class sizes #
The table below gives various size properties of objects for every class. Click a row to see the image with annotations of the selected class. Sort columns to find classes with the smallest or largest objects or understand the size differences between classes.
Class | Object count | Avg area | Max area | Min area | Min height | Min height | Max height | Max height | Avg height | Avg height | Min width | Min width | Max width | Max width |
|---|---|---|---|---|---|---|---|---|---|---|---|---|---|---|
wind turbines rectangle | 6396 | 0.22% | 3.06% | 0% | 5px | 0.45% | 97px | 15.95% | 25px | 3.38% | 5px | 0.45% | 142px | 23.36% |
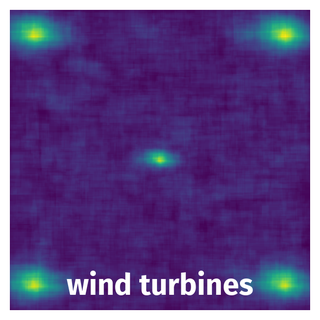
Spatial Heatmap #
The heatmaps below give the spatial distributions of all objects for every class. These visualizations provide insights into the most probable and rare object locations on the image. It helps analyze objects' placements in a dataset.
Objects #
Table contains all 6396 objects. Click a row to preview an image with annotations, and use search or pagination to navigate. Sort columns to find outliers in the dataset.
Object ID ㅤ | Class ㅤ | Image name click row to open | Image size height x width | Height ㅤ | Height ㅤ | Width ㅤ | Width ㅤ | Area ㅤ |
|---|---|---|---|---|---|---|---|---|
1➔ | wind turbines rectangle | naip_1812_CO_WND_i1j0.jpg | 608 x 608 | 26px | 4.28% | 59px | 9.7% | 0.41% |
2➔ | wind turbines rectangle | naip_4412_MN_WND_i1j0.jpg | 608 x 608 | 16px | 2.63% | 87px | 14.31% | 0.38% |
3➔ | wind turbines rectangle | naip_4105_MI_WND_i1j1.jpg | 608 x 608 | 58px | 9.54% | 21px | 3.45% | 0.33% |
4➔ | wind turbines rectangle | naip_4105_MI_WND_i1j1.jpg | 608 x 608 | 53px | 8.72% | 19px | 3.12% | 0.27% |
5➔ | wind turbines rectangle | naip_2963_IL_WND_i1j1.jpg | 608 x 608 | 33px | 5.43% | 60px | 9.87% | 0.54% |
6➔ | wind turbines rectangle | naip_664_CA_WND_i1j1.jpg | 608 x 608 | 20px | 3.29% | 19px | 3.12% | 0.1% |
7➔ | wind turbines rectangle | naip_664_CA_WND_i1j1.jpg | 608 x 608 | 21px | 3.45% | 17px | 2.8% | 0.1% |
8➔ | wind turbines rectangle | naip_664_CA_WND_i1j1.jpg | 608 x 608 | 18px | 2.96% | 18px | 2.96% | 0.09% |
9➔ | wind turbines rectangle | naip_1434_CA_WND_i1j0.jpg | 608 x 608 | 14px | 2.3% | 18px | 2.96% | 0.07% |
10➔ | wind turbines rectangle | naip_1434_CA_WND_i1j0.jpg | 608 x 608 | 10px | 1.64% | 16px | 2.63% | 0.04% |
License #
Citation #
If you make use of the Wind Turbines 3 data, please cite the following reference:
@article{Duke Dataplus20202020,
    author = "Duke Dataplus2020",
    title = "{Overhead Imagery of Wind Turbines}",
    year = "2020",
    month = "7",
    url = "https://figshare.com/articles/dataset/Overhead_Imagery_of_Wind_Turbines/12744977",
    doi = "10.6084/m9.figshare.12744977.v1"
}
If you are happy with Dataset Ninja and use provided visualizations and tools in your work, please cite us:
@misc{ visualization-tools-for-real-overhead-wind-turbines-dataset,
  title = { Visualization Tools for Overhead Imagery of Wind Turbines (by Duke Dataplus2020) Dataset },
  type = { Computer Vision Tools },
  author = { Dataset Ninja },
  howpublished = { \url{ https://datasetninja.com/real-overhead-wind-turbines } },
  url = { https://datasetninja.com/real-overhead-wind-turbines },
  journal = { Dataset Ninja },
  publisher = { Dataset Ninja },
  year = { 2026 },
  month = { jul },
  note = { visited on 2026-07-20 },
}
Download #
Dataset Overhead Imagery of Wind Turbines (by Duke Dataplus2020) can be downloaded in Supervisely format:
As an alternative, it can be downloaded with dataset-tools package:
pip install --upgrade dataset-tools
… using following python code:
import dataset_tools as dtools

dtools.download(dataset='Overhead Imagery of Wind Turbines (by Duke Dataplus2020)', dst_dir='~/dataset-ninja/')
Make sure not to overlook the python code example available on the Supervisely Developer Portal. It will give you a clear idea of how to effortlessly work with the downloaded dataset.
The data in original format can be downloaded here.
Disclaimer #
Our gal from the legal dep told us we need to post this:
Dataset Ninja provides visualizations and statistics for some datasets that can be found online and can be downloaded by general audience. Dataset Ninja is not a dataset hosting platform and can only be used for informational purposes. The platform does not claim any rights for the original content, including images, videos, annotations and descriptions. Joint publishing is prohibited.
You take full responsibility when you use datasets presented at Dataset Ninja, as well as other information, including visualizations and statistics we provide. You are in charge of compliance with any dataset license and all other permissions. You are required to navigate datasets homepage and make sure that you can use it. In case of any questions, get in touch with us at hello@datasetninja.com.