

Introduction #
In the RGB-D Peoples Dataset the authors present a 3D people detection and tracking approach using RGB-D data. It combines a novel multi-cue person detector for RGB-D data with an on-line detector that learns individual target models. The two detectors are integrated into a decisional framework with a multi-hypothesis tracker that controls on-line learning through a track interpretation feedback. For on-line learning, they take a boosting approach using three types of RGB-D features and a confidence maximization search in 3D space. The approach is general in that it neither relies on background learning nor a ground plane assumption.
Motivation
Detection and tracking of individuals play pivotal roles in various robotic systems, interactive platforms, and intelligent vehicles. Cameras and range finders are popular sensors employed for this purpose, each offering unique advantages and drawbacks. However, with the emergence of affordable and increasingly reliable RGB-D sensors capable of providing both image and range data, the distinction between these modalities may become less relevant.
In the realm of robotics, researchers have tackled the challenge of people detection and tracking using range data. Early approaches focused on 2D data, employing ad-hoc classifiers to identify moving local minima in scans. However, the detection and tracking of people in 3D range data present a relatively new and underexplored area.
In contrast, the computer vision community has extensively studied the detection, tracking, and modeling of humans primarily using image data. Unlike range-based systems, the rich information provided by images facilitates the learning of target appearance models. Consequently, visual tracking systems often achieve satisfactory results with relatively simple methods, such as independent particle filters with nearest-neighbor data association.
The authors of this work contribute to advancing the state of the art in several key aspects. Firstly, they address the novel challenge of detecting and tracking people in RGB-D data. Their approach combines a pre-existing person detector with an online-learned person detector and a multi-hypothesis tracker (MHT) capable of estimating the motion state of multiple individuals in 3D space.
Additionally, the authors introduce a novel framework for integrating the two detectors and the tracker, incorporating track interpretation feedback to control learning. This framework enables the system to compensate for gaps in detections from the pre-existing detector, handle target occlusions, and prevent drift of the online detector.
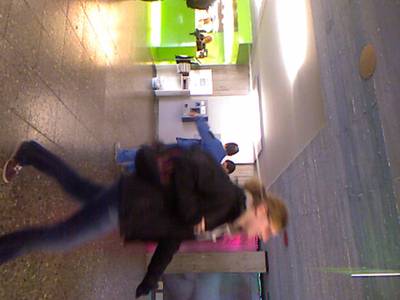
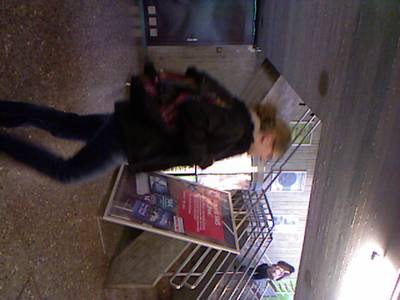
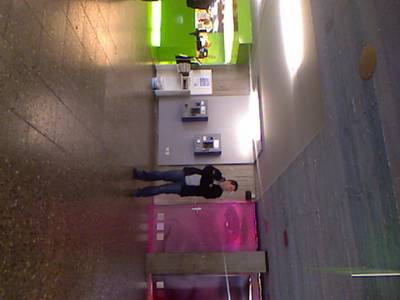
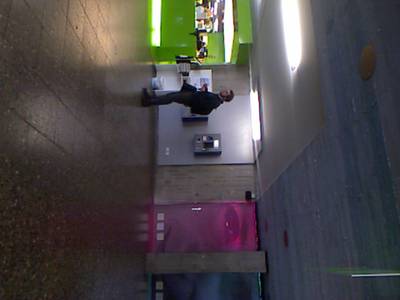
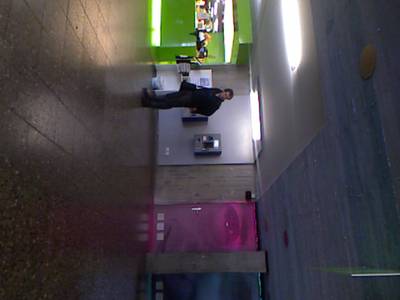
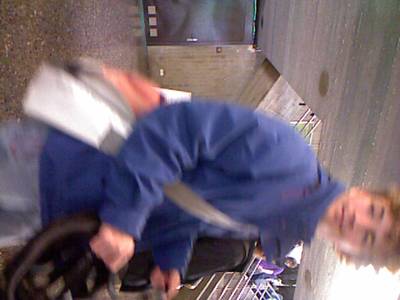
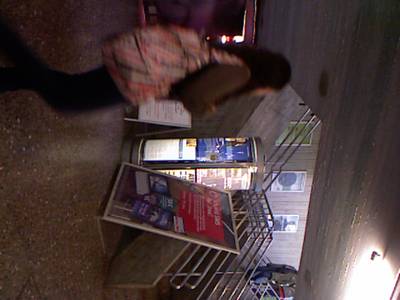
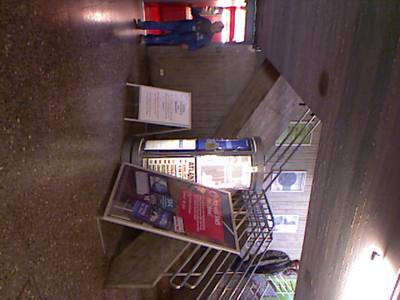
Detected people in RGB-D data from dense depth data (right) and color image data (left).
Dataset description
The authors rely on a novel RGB-D person detector called Combo-HOD (Combined Histograms of Oriented Depths and Gradients). The method takes inspiration from Histogram of Oriented Gradients (HOG) and combines the HOG detector in the color image with a novel approach in the depth image called Histograms of Oriented Depths (HOD). Since RGB-D data contains both color and depth information, the Combo-HOD detector combines the two sensory cues. HOD descriptors are computed in the depth image and HOG descriptors are computed in the color image. They are fused on the level of detections via a weighted mean of the probabilities obtained by a sigmoid fitted to the SVM outputs. HOD includes a depth-informed scale-space search in which the used scales in an image are first collected and then tested for compatibility with the respective depth. This test is made particularly efficient by the use of integral tensors, an extension of integral images over several scales. This strategy dramatically reduces the number of descriptors computed in the image at improved detection rates. The output of the detector in each step is the positions and size of all targets in 3D space and the center and size of the bounding boxes in the depth images.
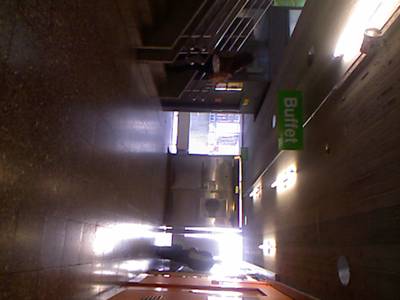
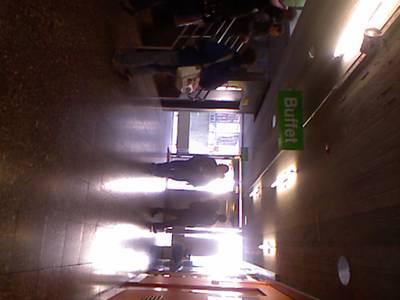
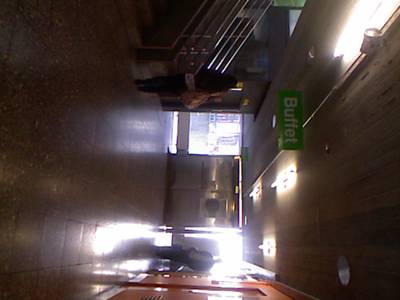
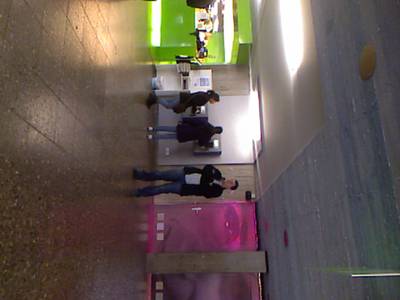
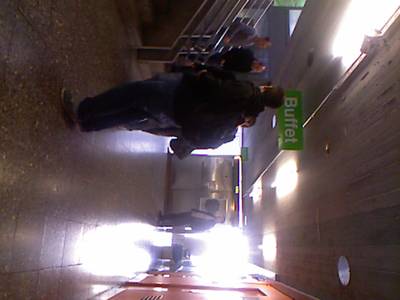
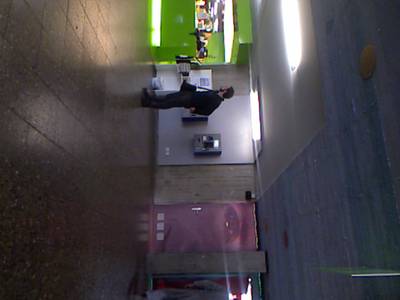
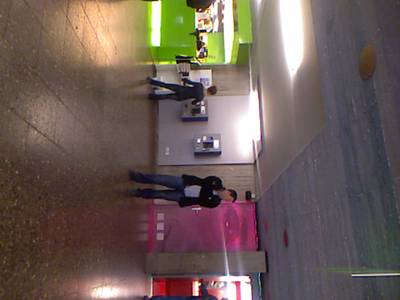
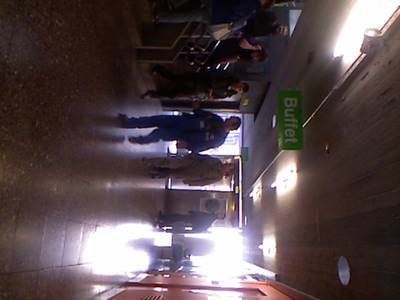
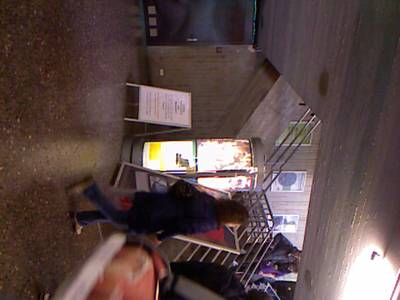
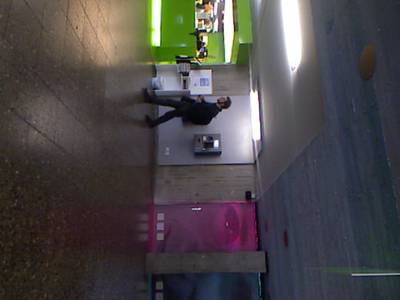
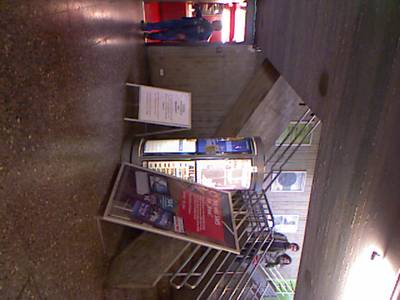
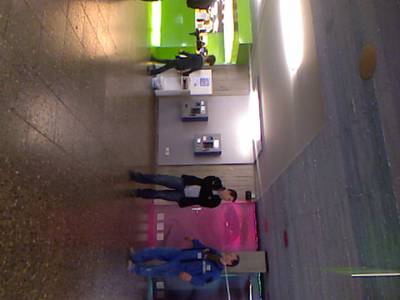
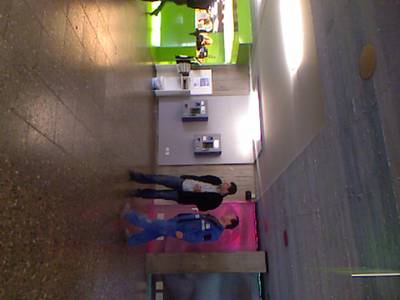
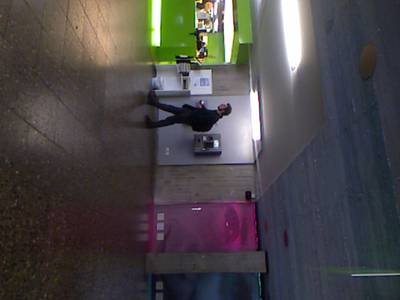
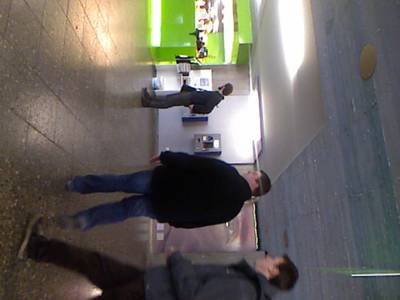
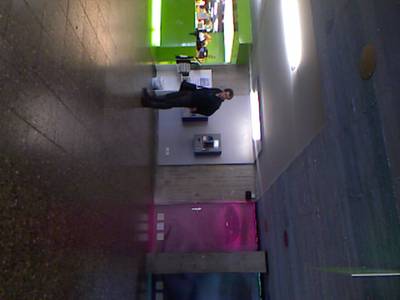
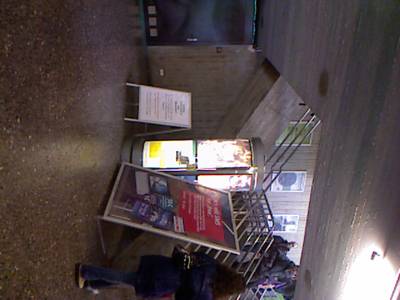
This dataset contains 3000+ RGB-D frames acquired in a university hall from three vertically mounted Kinect sensors. The data contains mostly upright walking and standing persons seen from different orientations and with different levels of occlusions.
The setup consisting from three vertically mounted Kinect sensors offering a joint field of view of 130◦ × 50◦ and supplying RGB-D data with a resolution of 1440 × 640 pixels at 30 Hz. They are mounted at 1.2 m height.
In order to assess and contrast various detector approaches, the authors curated a comprehensive indoor dataset capturing unscripted human behavior. This dataset was gathered in the lobby of a bustling university cafeteria during lunch hours. To prevent bias in the a priori detector towards the visual characteristics of the cafeteria lobby, additional background data was collected from a visually distinct university building. This was particularly important given that the data was acquired from stationary sensors. The dataset was meticulously annotated, including bounding boxes in 2D depth image space, the visibility status of subjects (fully visible/partially occluded), and ground truth data association for the tracks. In total, 3021 instances of individuals across 1133 frames and 31 tracks were labeled. The sensory setup comprised three vertically mounted Kinect sensors, collectively providing an expanded field of view measuring 130° × 50°. Careful measures were taken to calibrate the intrinsic and extrinsic parameters of the setup, ensuring synchronized acquisition of the three images at the desired frame rate.
 Homepage
 KaggleResearch Paper 1Research Paper 2
Summary #
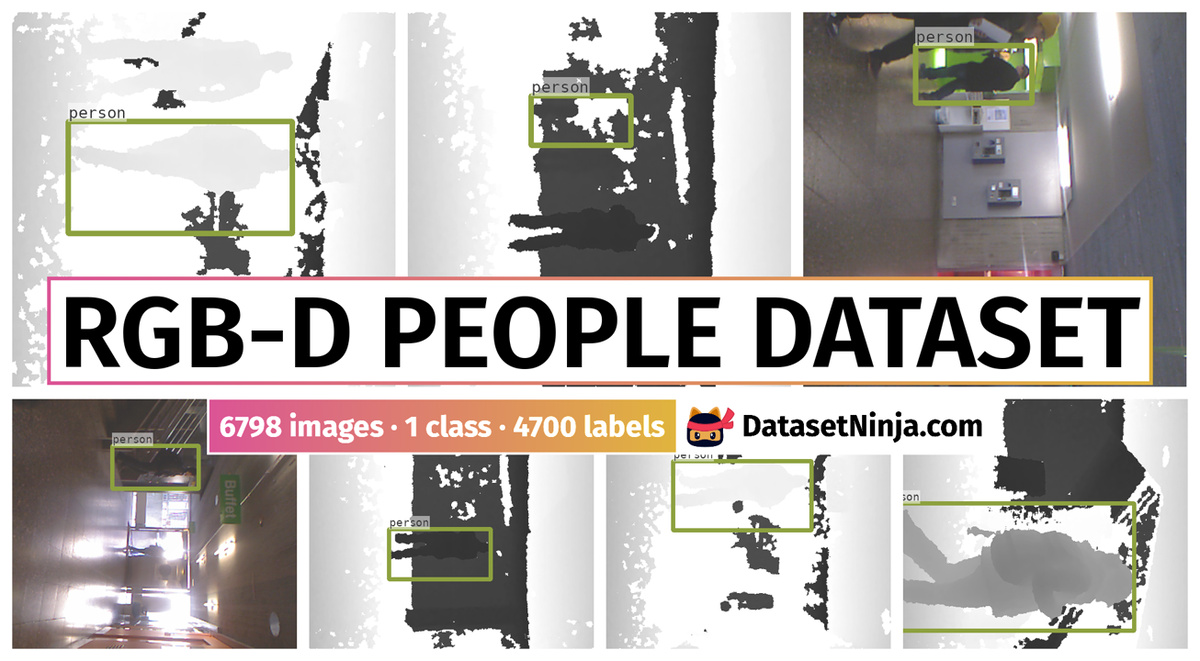
RGB-D People Dataset is a dataset for object detection and monocular depth estimation tasks. It is used in the surveillance and robotics industries.
The dataset consists of 6798 images with 4700 labeled objects belonging to 1 single class (person).
Images in the RGB-D People Dataset dataset have bounding box annotations. There are 2098 (31% of the total) unlabeled images (i.e. without annotations). There are no pre-defined train/val/test splits in the dataset. Alternatively, the dataset could be split into 3 camera positions: center camera (2266 images), left camera (2266 images), and right camera (2266 images), or into 3 visibility in the depth image: fully visible (2418 images), partially visible (2282 images), and hidden (0 objects). Additionally, every image contains information about timestamp and track. Moreover, images are grouped by seq. The dataset was released in 2023 by the University of Freiburg, Germany.
Explore #
RGB-D People Dataset dataset has 6798 images. Click on one of the examples below or open "Explore" tool anytime you need to view dataset images with annotations. This tool has extended visualization capabilities like zoom, translation, objects table, custom filters and more. Hover the mouse over the images to hide or show annotations.


Class balance #
There are 1 annotation classes in the dataset. Find the general statistics and balances for every class in the table below. Click any row to preview images that have labels of the selected class. Sort by column to find the most rare or prevalent classes.

Class ㅤ | Images ㅤ | Objects ㅤ | Count on image average | Area on image average |
|---|---|---|---|---|
person➔ rectangle | 4700 | 4700 | 1 | 12.29% |
Images #
Explore every single image in the dataset with respect to the number of annotations of each class it has. Click a row to preview selected image. Sort by any column to find anomalies and edge cases. Use horizontal scroll if the table has many columns for a large number of classes in the dataset.
Object distribution #
Interactive heatmap chart for every class with object distribution shows how many images are in the dataset with a certain number of objects of a specific class. Users can click cell and see the list of all corresponding images.
Class sizes #
The table below gives various size properties of objects for every class. Click a row to see the image with annotations of the selected class. Sort columns to find classes with the smallest or largest objects or understand the size differences between classes.
Class | Object count | Avg area | Max area | Min area | Min height | Min height | Max height | Max height | Avg height | Avg height | Min width | Min width | Max width | Max width |
|---|---|---|---|---|---|---|---|---|---|---|---|---|---|---|
person rectangle | 4700 | 12.29% | 82.71% | 0.93% | 19px | 3.96% | 397px | 82.71% | 120px | 25.07% | 91px | 14.22% | 640px | 100% |
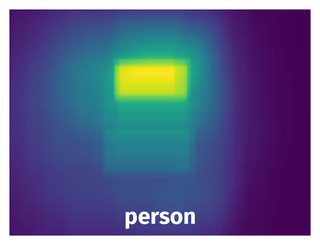
Spatial Heatmap #
The heatmaps below give the spatial distributions of all objects for every class. These visualizations provide insights into the most probable and rare object locations on the image. It helps analyze objects' placements in a dataset.
Objects #
Table contains all 4700 objects. Click a row to preview an image with annotations, and use search or pagination to navigate. Sort columns to find outliers in the dataset.
Object ID ㅤ | Class ㅤ | Image name click row to open | Image size height x width | Height ㅤ | Height ㅤ | Width ㅤ | Width ㅤ | Area ㅤ |
|---|---|---|---|---|---|---|---|---|
1➔ | person rectangle | seq0_0301_2.pgm.png | 480 x 640 | 120px | 25% | 240px | 37.5% | 9.38% |
2➔ | person rectangle | seq0_0250_1.ppm.png | 480 x 640 | 76px | 15.83% | 152px | 23.75% | 3.76% |
3➔ | person rectangle | seq0_0854_2.pgm.png | 480 x 640 | 82px | 17.08% | 164px | 25.62% | 4.38% |
4➔ | person rectangle | seq0_0381_2.pgm.png | 480 x 640 | 100px | 20.83% | 199px | 31.09% | 6.48% |
5➔ | person rectangle | seq0_0233_0.pgm.png | 480 x 640 | 80px | 16.67% | 160px | 25% | 4.17% |
6➔ | person rectangle | seq0_0173_0.pgm.png | 480 x 640 | 75px | 15.62% | 150px | 23.44% | 3.66% |
7➔ | person rectangle | seq0_1068_0.pgm.png | 480 x 640 | 80px | 16.67% | 160px | 25% | 4.17% |
8➔ | person rectangle | seq0_0356_0.ppm.png | 480 x 640 | 76px | 15.83% | 151px | 23.59% | 3.74% |
9➔ | person rectangle | seq0_0960_2.pgm.png | 480 x 640 | 91px | 18.96% | 182px | 28.44% | 5.39% |
10➔ | person rectangle | seq0_0474_2.ppm.png | 480 x 640 | 200px | 41.67% | 400px | 62.5% | 26.04% |
License #
RGB-D Peoples Dataset is under CC BY-NC-SA 4.0 license.
Citation #
If you make use of the RGB-D Peoples data, please cite the following reference:
@dataset{RGB-D Peoples,
  author={Luciano Spinello and Kai O. Arras and Matthias Luber},
  title={RGB-D Peoples Dataset},
  year={2023},
  url={https://www.kaggle.com/datasets/bmanikan/rgbd-peoples-dataset}
}
If you are happy with Dataset Ninja and use provided visualizations and tools in your work, please cite us:
@misc{ visualization-tools-for-rgbd-people-dataset,
  title = { Visualization Tools for RGB-D People Dataset Dataset },
  type = { Computer Vision Tools },
  author = { Dataset Ninja },
  howpublished = { \url{ https://datasetninja.com/rgbd-people } },
  url = { https://datasetninja.com/rgbd-people },
  journal = { Dataset Ninja },
  publisher = { Dataset Ninja },
  year = { 2026 },
  month = { jul },
  note = { visited on 2026-07-16 },
}
Download #
Dataset RGB-D People Dataset can be downloaded in Supervisely format:
As an alternative, it can be downloaded with dataset-tools package:
pip install --upgrade dataset-tools
… using following python code:
import dataset_tools as dtools

dtools.download(dataset='RGB-D People Dataset', dst_dir='~/dataset-ninja/')
Make sure not to overlook the python code example available on the Supervisely Developer Portal. It will give you a clear idea of how to effortlessly work with the downloaded dataset.
The data in original format can be downloaded here.
Disclaimer #
Our gal from the legal dep told us we need to post this:
Dataset Ninja provides visualizations and statistics for some datasets that can be found online and can be downloaded by general audience. Dataset Ninja is not a dataset hosting platform and can only be used for informational purposes. The platform does not claim any rights for the original content, including images, videos, annotations and descriptions. Joint publishing is prohibited.
You take full responsibility when you use datasets presented at Dataset Ninja, as well as other information, including visualizations and statistics we provide. You are in charge of compliance with any dataset license and all other permissions. You are required to navigate datasets homepage and make sure that you can use it. In case of any questions, get in touch with us at hello@datasetninja.com.