
Introduction #
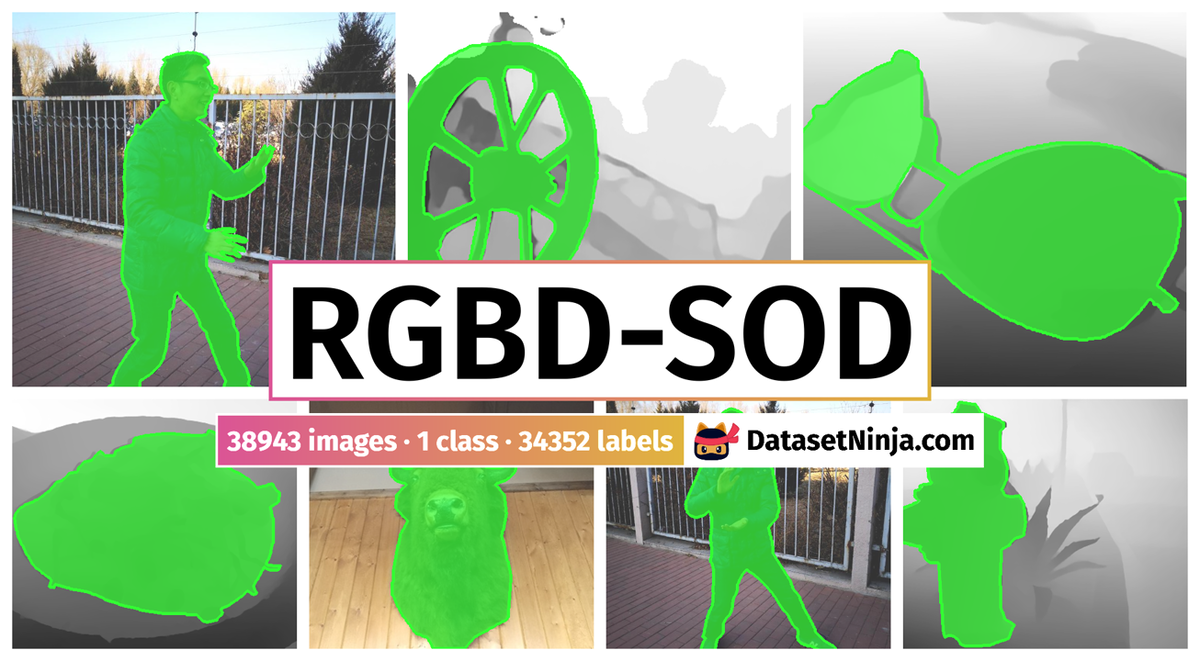
The authors create the RGB-D Salient Object Detection Dataset (RGB-D SOD), which aims to detect and segment objects that visually attract the most human interest from a pair of color and depth images. The dataset lies between Object Detection and Semantic Segmentation. Each sample is a pair of color (RGB) and depth images.
Salient object detection problem
Salient object detection, mimicking human visual perception to identify the most prominent objects within a scene, has found extensive application across diverse computer vision tasks. With the emergence of depth sensors, capturing depth maps has become more accessible, thereby providing supplementary spatial data that can significantly enhance the accuracy of salient object detection. Despite the development of numerous RGB-D based models for salient object detection boasting promising results in recent years, there persists a gap in understanding the intricacies of these models and the inherent challenges within this field.
Salient object detection serves the purpose of identifying the most visually striking objects within a given scene, playing a pivotal role across a spectrum of real-world applications. These applications span stereo matching, image comprehension, co-saliency detection, action recognition, video segmentation, semantic segmentation, medical imaging, object tracking, person re-identification, camouflaged object detection, and image retrieval, among others. Despite notable advancements in salient object detection in recent years, challenges persist, particularly when confronted with complex backgrounds or fluctuating lighting conditions within scenes. One effective strategy to address these challenges involves leveraging depth maps, which offer supplementary spatial information to conventional RGB images and have become more readily accessible thanks to the widespread availability of depth sensors. Recently, RGB-D based salient object detection has gained increasing attention, and various methods have been developed.
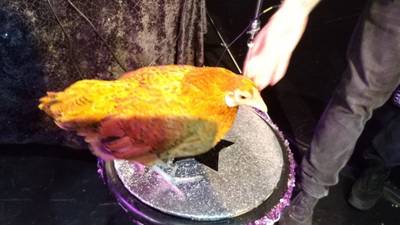
RGB-D based salient object prediction on a sample image using two classical models: DCMC and SE, and seven state-of-the-art deep models: D3 Net, SSF, A2dele, S2 MA, ICNet, JL-DCF, and UC-Net
Dataset creation
With the rapid development of RGB-D based salient object detection, various datasets have been constructed over the past several years. The authors
summarized nine popular RGB-D datasets.
| No. | Dataset | Year | Pub. | Size | # Obj. Types | Sensor | Resolution |
|---|---|---|---|---|---|---|---|
| 1 | STERE [139] | 2012 | CVPR | 1000 | ∼One | Internet Stereo camera + sift flow | [251 − 1200] × [222 − 900] |
| 2 | GIT [47] | 2013 | BMVC | 80 | Multiple | Home environment Microsoft Kinect | 640 × 480 |
| 3 | DES [49] | 2014 | ICIMCS | 135 | One | Indoor Microsoft Kinect | 640 × 480 |
| 4 | NLPR [51] | 2014 | ECCV | 1000 | Multiple | Indoor/outdoor Microsoft Kinect | 640 × 480, 480 × 640 |
| 5 | LFSD [140] | 2014 | CVPR | 100 | One | Indoor/outdoor Lytro Illum camera | 360 × 360 |
| 6 | NJUD [56] | 2014 | ICIP | 1985 | ∼One | Movie/Internet/photo FujiW3 camera + optical flow | [231 − 1213] × [274 − 828] |
| 7 | SSD [85] | 2017 | ICCVW | 80 | Multiple | Movies Sun’s optical flow | 960 × 1080 |
| 8 | DUT-RGBD [137] | 2019 | ICCV | 1200 | Multiple | Indoor/outdoor — | 400 × 600 |
| 9 | SIP [38] | 2020 | TNNLS | 929 | Multiple | Person in the wild Huawei Mate10 | 992 × 744 |
-
STERE. The authors collected 1250 stereo-scopic images from Flickr, [NVIDIA 3D Vision Live](http://photos.3dvisionlive
.com/), and the Stereoscopic Image Gallery. The most salient objects in each image were annotated by three users. All annotated images were then sorted based on the overlapping salient regions and the top 1000 images were selected to construct the final dataset.
This was the first collection of stereoscopic images in this field. -
GIT consists of 80 color and depth images, collected using a mobile-manipulator robot in a real-world home environment. Each image is annotated
based on pixel-level segmentation of its objects. -
DES consists of 135 indoor RGB-D images, taken by Kinect at a resolution of 640 × 640. When collecting this dataset, three users were asked to label the salient object in each image, and overlapping labeled areas were regarded as the ground truth.
-
NLPR consists of 1000 RGB images and corresponding depth maps, obtained by a standard Microsoft Kinect. This dataset includes a series of outdoor and indoor locations, e.g., offices, supermarkets, campuses, streets, and so on.
-
LFSD includes 100 light fields collected using a Lytro light field camera, and consists of 60 indoor and 40 outdoor scenes. To label this dataset, three individuals were asked to manually segment salient regions; the segmented results were deemed ground truth when the overlap of the three results was over 90%.
-
NJUD consists of 1985 stereo image pairs, collected from the Internet, 3D movies, and photographs taken by a Fuji W3 stereo camera.
-
SSD was constructed using three stereo movies and includes indoor and outdoor scenes. It includes 80 samples; each image has resolution of 960 × 1080.
-
DUT-RGBD consists of 800 indoor and 400 outdoor scenes with corresponding depth images. This dataset provides several challenging factors: multiple and transparent objects, complex backgrounds, similar foregrounds to backgrounds, and low-intensity environments.
-
SIP consists of 929 annotated high-resolution images, with multiple salient persons in each image. In this dataset, depth maps were captured using a smart phone (Huawei Mate10). This dataset covers diverse scenes and various challenging factors, and is annotated with pixel-level ground truth.
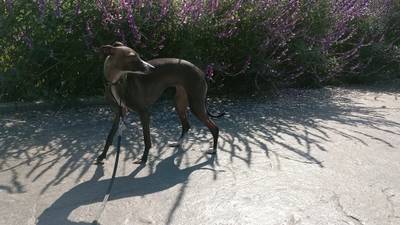
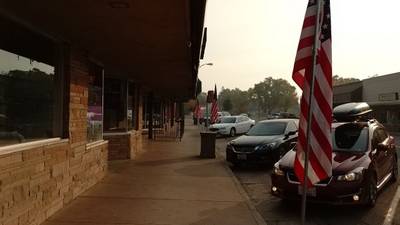
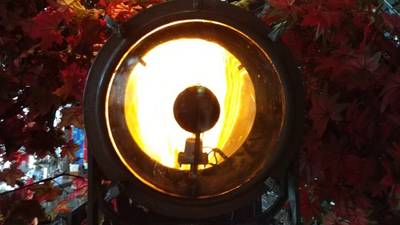
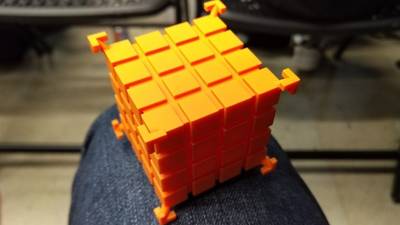
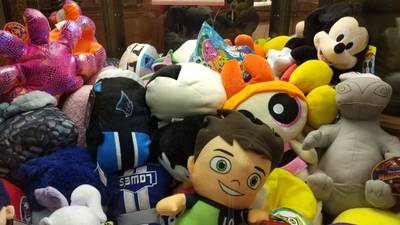
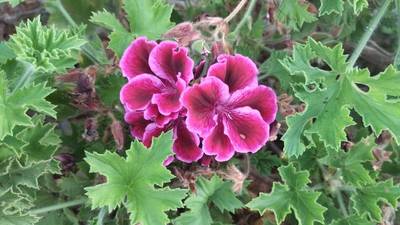
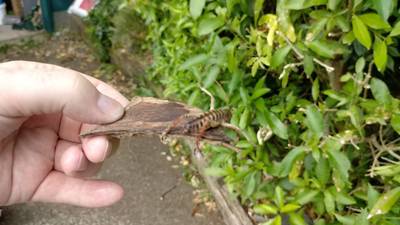
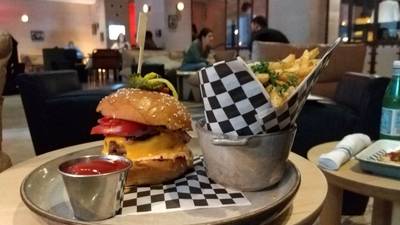
Examples of RGB images, depth maps, and annotations from RGB-D datasets.
 Homepage
 Research Paper
 Kaggle
Summary #
RGB-D SOD: RGB-Depth Salient Object Detection Dataset is a dataset for semantic segmentation, monocular depth estimation, and object detection tasks. It is applicable or relevant across various domains. The dataset presented here is not the original one. Learn more on the dataset’s homepage.
The dataset consists of 38943 images with 34352 labeled objects belonging to 1 single class (salient object).
Images in the RGBD-SOD dataset have pixel-level semantic segmentation annotations. There are 4591 (12% of the total) unlabeled images (i.e. without annotations). There are 2 splits in the dataset: test (22893 images) and train (16050 images). Additionally, every image marked with its im_id and source_dataset tags. The dataset was released in 2020 by the Inception Institute of Artificial Intelligence, United Arab Emirates and Nankai University, China.
Explore #
RGBD-SOD dataset has 38943 images. Click on one of the examples below or open "Explore" tool anytime you need to view dataset images with annotations. This tool has extended visualization capabilities like zoom, translation, objects table, custom filters and more. Hover the mouse over the images to hide or show annotations.


Class balance #
There are 1 annotation classes in the dataset. Find the general statistics and balances for every class in the table below. Click any row to preview images that have labels of the selected class. Sort by column to find the most rare or prevalent classes.

Class ㅤ | Images ㅤ | Objects ㅤ | Count on image average | Area on image average |
|---|---|---|---|---|
salient object➔ mask | 34352 | 34352 | 1 | 22.71% |
Images #
Explore every single image in the dataset with respect to the number of annotations of each class it has. Click a row to preview selected image. Sort by any column to find anomalies and edge cases. Use horizontal scroll if the table has many columns for a large number of classes in the dataset.
Object distribution #
Interactive heatmap chart for every class with object distribution shows how many images are in the dataset with a certain number of objects of a specific class. Users can click cell and see the list of all corresponding images.
Class sizes #
The table below gives various size properties of objects for every class. Click a row to see the image with annotations of the selected class. Sort columns to find classes with the smallest or largest objects or understand the size differences between classes.
Class | Object count | Avg area | Max area | Min area | Min height | Min height | Max height | Max height | Avg height | Avg height | Min width | Min width | Max width | Max width |
|---|---|---|---|---|---|---|---|---|---|---|---|---|---|---|
salient object mask | 34352 | 22.71% | 94.53% | 0.01% | 24px | 6.25% | 1280px | 100% | 429.08px | 74.8% | 21px | 2.81% | 1280px | 100% |
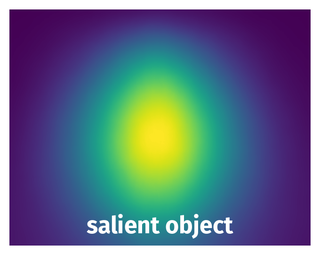
Spatial Heatmap #
The heatmaps below give the spatial distributions of all objects for every class. These visualizations provide insights into the most probable and rare object locations on the image. It helps analyze objects' placements in a dataset.
Objects #
Table contains all 34352 objects. Click a row to preview an image with annotations, and use search or pagination to navigate. Sort columns to find outliers in the dataset.
Object ID ㅤ | Class ㅤ | Image name click row to open | Image size height x width | Height ㅤ | Height ㅤ | Width ㅤ | Width ㅤ | Area ㅤ |
|---|---|---|---|---|---|---|---|---|
1➔ | salient object mask | COME_Train_4347.jpg | 720 x 1280 | 422px | 58.61% | 271px | 21.17% | 8.92% |
2➔ | salient object mask | COME_Train_7618.png | 720 x 1280 | 479px | 66.53% | 686px | 53.59% | 24.15% |
3➔ | salient object mask | COME_Train_7620.jpg | 720 x 1280 | 658px | 91.39% | 741px | 57.89% | 26.81% |
4➔ | salient object mask | COME_Train_5839.png | 360 x 640 | 265px | 73.61% | 404px | 63.12% | 28.03% |
5➔ | salient object mask | COME_Train_6141.png | 720 x 1280 | 389px | 54.03% | 804px | 62.81% | 21.43% |
6➔ | salient object mask | COME_Train_5718.jpg | 720 x 1280 | 562px | 78.06% | 457px | 35.7% | 15.06% |
7➔ | salient object mask | COME_Train_3930.png | 720 x 1280 | 707px | 98.19% | 539px | 42.11% | 21.78% |
8➔ | salient object mask | COME_Train_6970.jpg | 720 x 1280 | 602px | 83.61% | 440px | 34.38% | 20.85% |
9➔ | salient object mask | COME_Train_861.png | 360 x 640 | 254px | 70.56% | 295px | 46.09% | 14.6% |
10➔ | salient object mask | COME_Train_6133.jpg | 720 x 1280 | 620px | 86.11% | 337px | 26.33% | 13.8% |
License #
License is unknown for the RGBD-SOD Dataset dataset.
Citation #
If you make use of the RGBD-SOD data, please cite the following reference:
@dataset{RGBD-SOD,
  author={Tao Zhou and Deng Ping Fan and Ming Ming Cheng and Jianbing Shen and Ling Shao},
  title={RGBD-SOD Dataset},
  year={2020},
  url={https://www.kaggle.com/datasets/thinhhuynh3108/rgbdsod-set1}
}
If you are happy with Dataset Ninja and use provided visualizations and tools in your work, please cite us:
@misc{ visualization-tools-for-rgbd-sod-dataset,
  title = { Visualization Tools for RGBD-SOD Dataset },
  type = { Computer Vision Tools },
  author = { Dataset Ninja },
  howpublished = { \url{ https://datasetninja.com/rgbd-sod } },
  url = { https://datasetninja.com/rgbd-sod },
  journal = { Dataset Ninja },
  publisher = { Dataset Ninja },
  year = { 2026 },
  month = { aug },
  note = { visited on 2026-08-02 },
}
Download #
Please visit dataset homepage to download the data.
Disclaimer #
Our gal from the legal dep told us we need to post this:
Dataset Ninja provides visualizations and statistics for some datasets that can be found online and can be downloaded by general audience. Dataset Ninja is not a dataset hosting platform and can only be used for informational purposes. The platform does not claim any rights for the original content, including images, videos, annotations and descriptions. Joint publishing is prohibited.
You take full responsibility when you use datasets presented at Dataset Ninja, as well as other information, including visualizations and statistics we provide. You are in charge of compliance with any dataset license and all other permissions. You are required to navigate datasets homepage and make sure that you can use it. In case of any questions, get in touch with us at hello@datasetninja.com.