

Introduction #
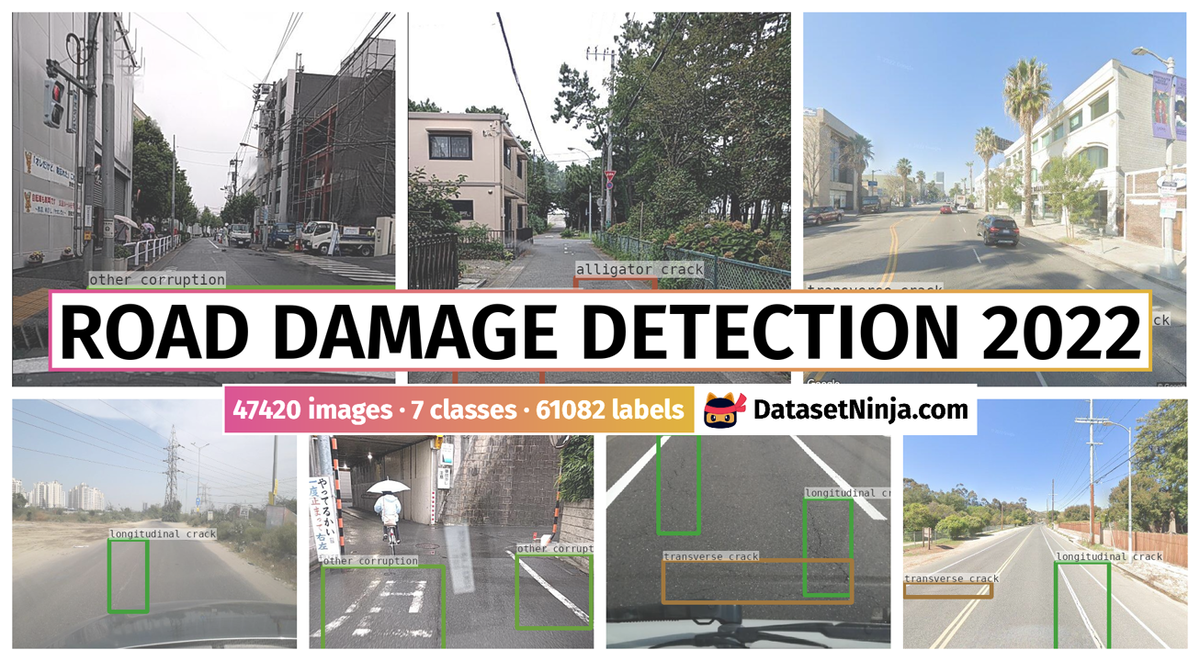
RDD2022: The Multi-National Road Damage Dataset 2022 comprises 47,420 road images from six countries, Japan, India, the Czech Republic, Norway, the United States, and China. The images have been annotated with more than 55,000 instances of road damage. Five types of road damage, namely longitudinal crack, transverse crack, alligator crack, pothole and other corruption are captured in the dataset. The annotated dataset is envisioned for developing deep learning-based methods to detect and classify road damage automatically. The dataset has been released as a part of the Crowd sensing-based Road Damage Detection Challenge (CRDDC’2022). The challenge CRDDC’2022 invites researchers from across the globe to propose solutions for automatic road damage detection in multiple countries.
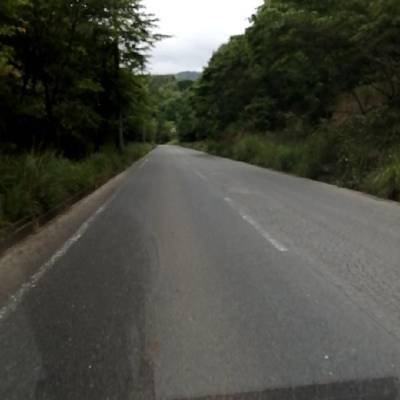
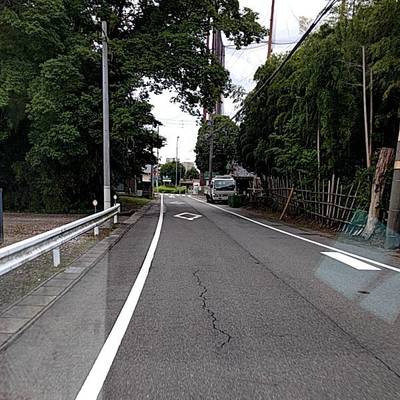
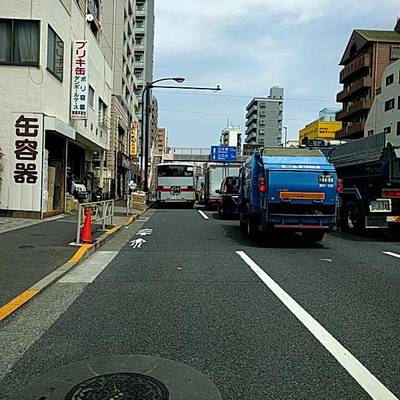
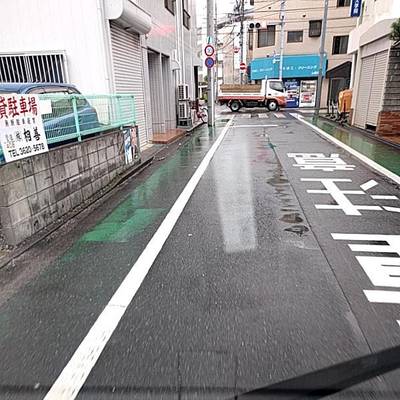
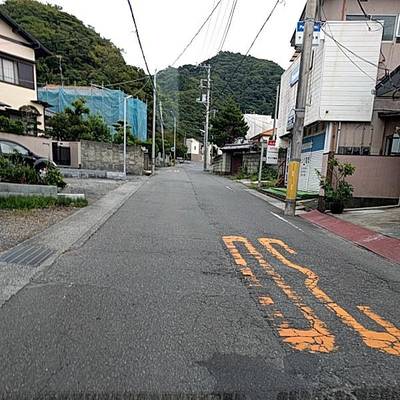
Sample images for road damage categories considered in the data. a. Longitudinal Crack (D00), b. Transverse Crack (D10), c. Alligator Crack (D20), d. Pothole (D40).
Dataset Description
-
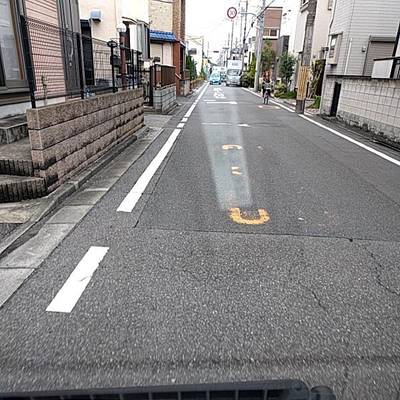
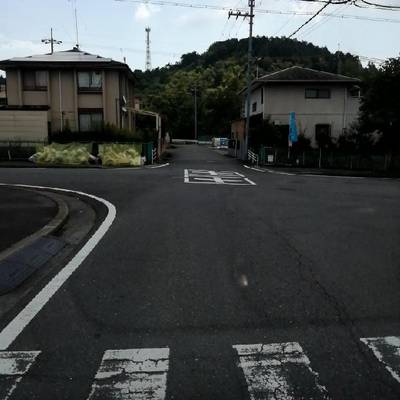
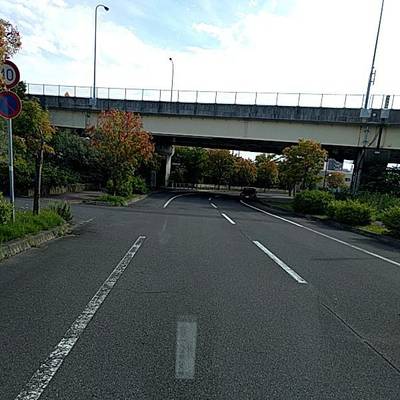
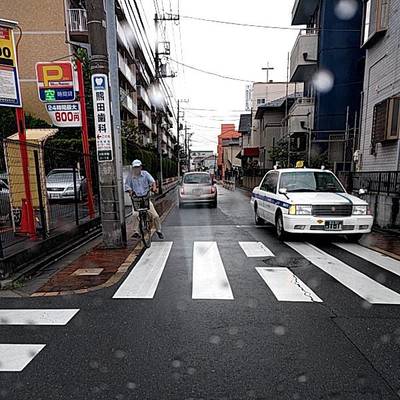
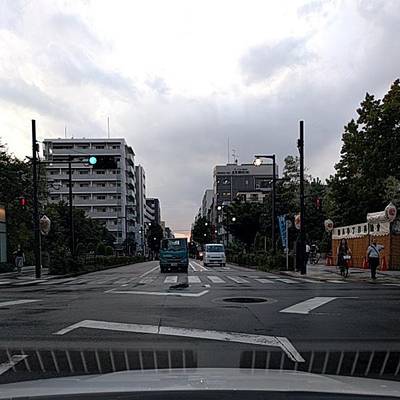
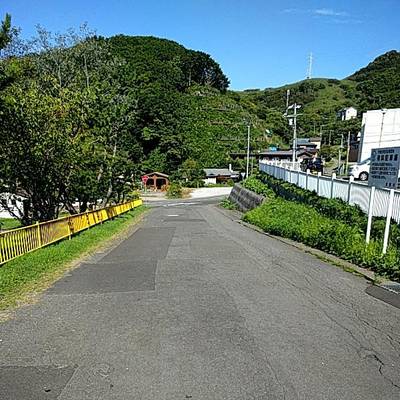
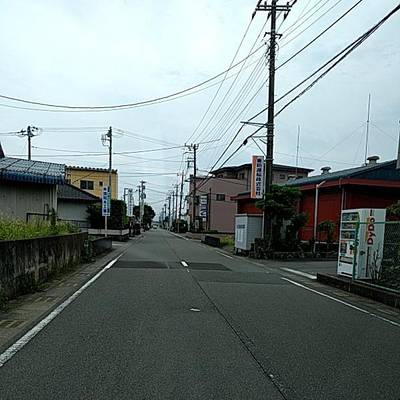
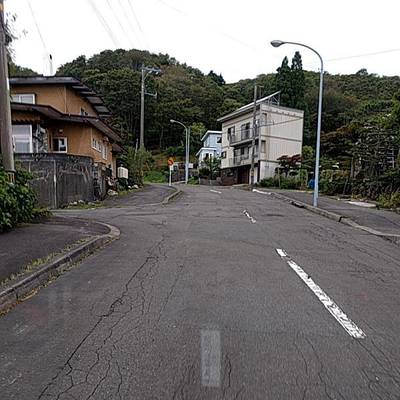
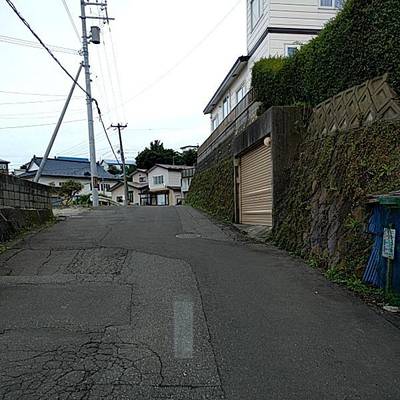
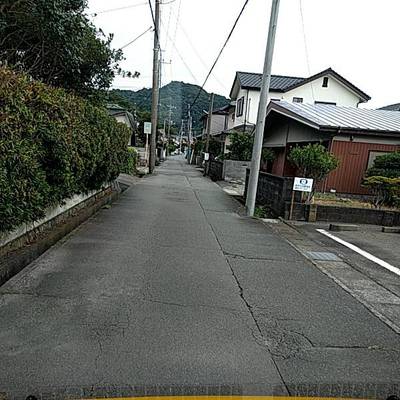
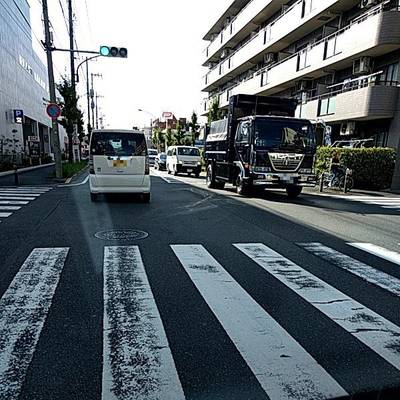
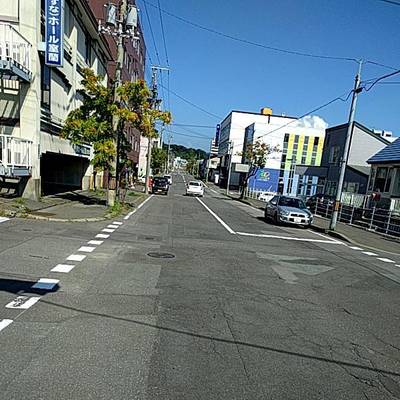
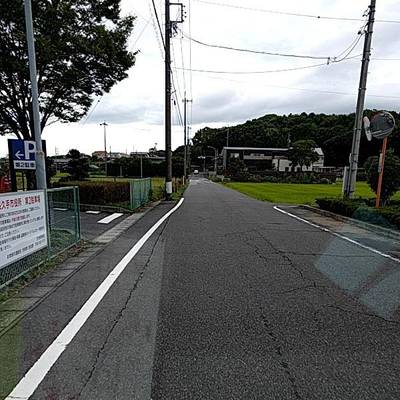
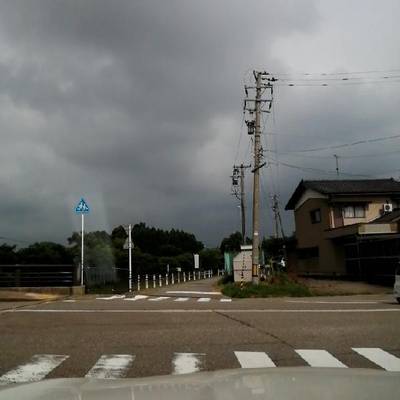
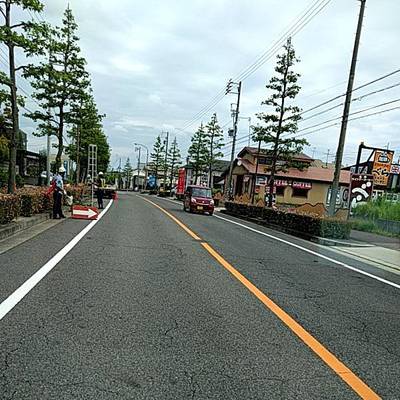
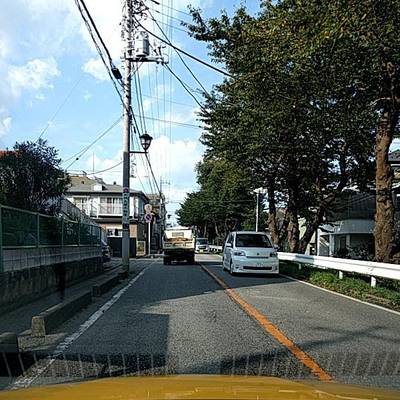
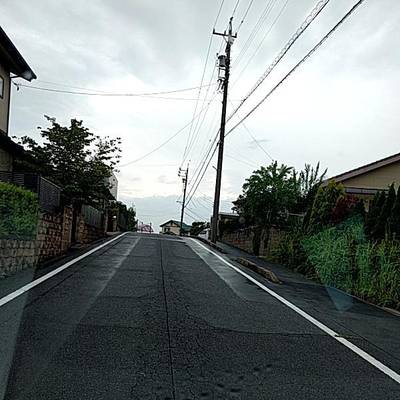
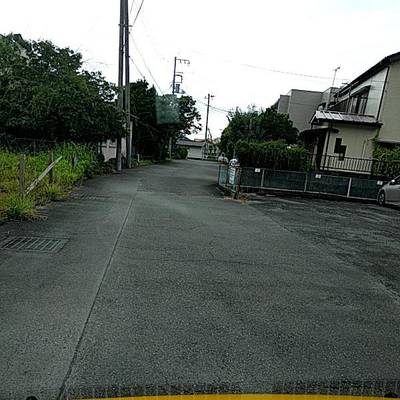
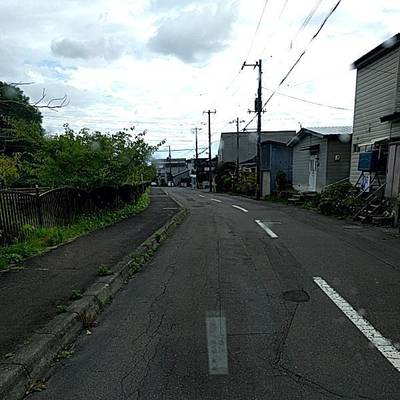
Japan: The data is collected from seven local governments in Japan (Ichihara city, Chiba city, Sumida ward, Nagakute city, Adachi city, Muroran city, and Numazu city). The municipalities have snowy and urban areas that vary widely from the perspective of regional characteristics like weather and budgetary constraints.
-
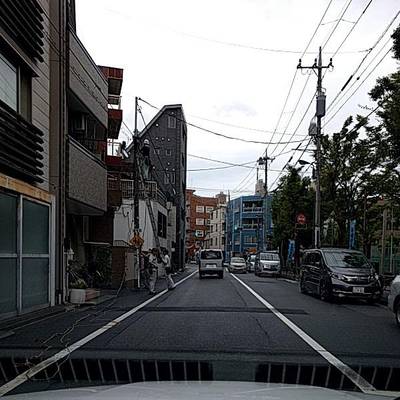
India: The data from India includes images captured from local roads, state highways, and national highways, covering the metropolitan (Delhi, Gurugram) as well as non-metropolitan regions (mainly from the state of Haryana). All these images have been collected from plain areas. Road selection and time of data collection were decided based on road accessibility, atmospheric conditions, and traffic volume.
-
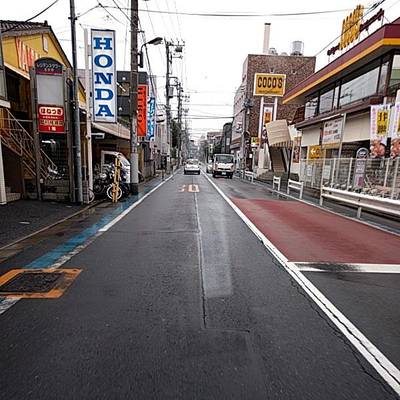
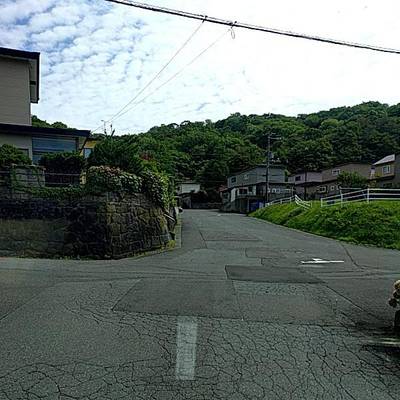
Czech Republic: A substantial portion of road images was collected in Olomouc, Prague, and Bratislava municipalities and covered a mix of first-class, second-class, and third-class roads and local roads. A smaller portion of the road image dataset was collected along D1, D2, and D46 motorways to enhance the resilience of the targeted model.
-
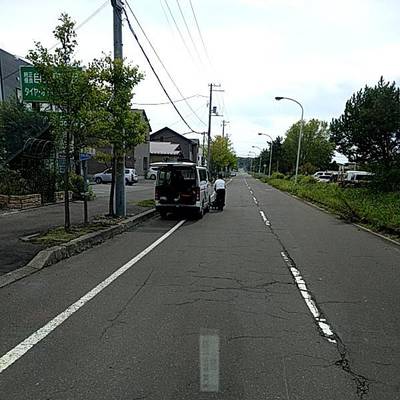
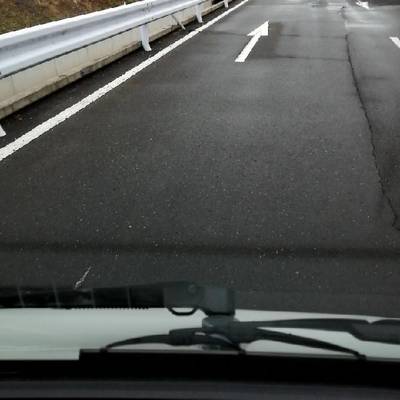
Norway: The data from Norway consists of two classes of roads Expressways and County Roads (or Low Volume Roads). Both types of road classes are asphalt pavements. Data collection is done by the Norwegian Public Road Administration (Statens Vegvesen, SVV) and Inlandet Fylkeskommune (IFK). Images provided by SVV were collected on European Route E14, connecting the city of Trondheim in Norway to Sundsvall in Sweden. At the same time, the images from IFK belong to different county roads within Inllanndet County in Norway. The images were collected without any control over daytime/light, and all the images are natural without further processing. Further, the dataset captures diverse backgrounds, including clear grass fields, snow-covered areas, and conditions after rain. Furthermore, images with different illuminances, such as high sunlight and overcast weather resulting in daylight, are considered.
-
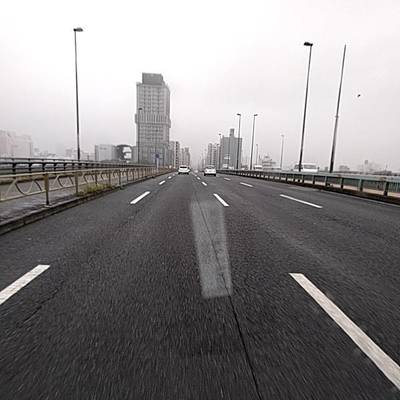
United States: The data from the United States consists of Google Street View images covering multiple locations, including California, Massachusetts, and New York.
-
China: RDD2022 considers two types of data from China: (a) images captured by drone(China_Drone), and (b) the images captured using Smartphone-mounted motorbike(China_MotorBike). The China_Drone images were obtained from Dongji Avenue in Nanjing, China. The China_MotorBike images were collected on Jiu long hu campus, Southeast University. Images with normal light, under a shadow environment, and wet stains are covered.
Asphalt concrete pavement is considered with a few exceptions in all six subsets of RDD2022. Each road damage in dataset has detail definitions.
Damage Category-based data statistics for RDD2022.
Image Acquisition
The images in RDD2022 have been acquired using different methods for different countries. For India, Japan, and the Czech Republic, smartphone-mounted vehicles (cars) were utilized to capture road images. In some cases, the setup with the smartphone mounted on the windshield (inside the car) was also used. Images of resolution 600x600 are captured for Japan and the Czech Republic. For India, images are captured at a resolution of 960x720 and later resized to 720x720 to maintain uniformity with the data from Japan and the Czech Republic.
Sample Installation Setup of the smartphone in the car: Image acquisition for data from India, Japan, and the Czech Republic.
For Norway, instead of smartphones, high-resolution cameras mounted inside the windshield of a specialized vehicle, ViaPPS, were used for data collection.
ViaPPS vehicle used to collect data from Norway.
ViaPPS System employs two Basler_Ace2040gc cameras with Complementary metal oxide semiconductor (CMOS) sensor to capture images and then stitches them into one wide view image of a typical resolution 3650x2044.
Camera set-up in the ViaPPS vehicle used to collect data from Norway.
In contrast, the data for the United States comprises Google Street View Images (vehiclebased) of the resolution 640x640. Likewise, for China, two types of image-acquisition methods are considered. The first method includes a camera mounted on motorbikes moving at an average speed of 30km/h; the corresponding dataset is referred to as China_MotorBike or China_M. The second method uses a six-motor UAV manufactured by DJI (M600 Pro) for pavement image collection, resulting in China_Drone (or China_D) data. A controllable three-axis gimbal was mounted at the bottom of the UAV to hold the camera and allow 360-degree rotation for capturing the China_Drone data. The resolution of images for the data from China is 512x512.
The drone and camera set-up used to capture China_Drone data included in RDD2022.
Dataset Annotation
RDD2022 includes annotation for road damage present in the image. The software LabelImg has been used to annotate the images except for the data from Norway. For Norway, another software Computer Vision Annotation Tool (CVAT), was utilized. All recognized damage instances were annotated by enclosing them with bounding boxes and classified by attaching the proper class label. Class labels and bounding box coordinates, defined by four decimal numbers (xmin, ymin, xmax, ymax), were stored in the XML format.
Annotation Pipeline (a) input image, (b) image with bounding boxes, (c) final annotated image containing bounding boxes and class label (D00 in this case)
 Homepage
 Research Paper
 GitHubFigshare
Summary #
RDD2022: The Multi-National Road Damage Dataset 2022 is a dataset for an object detection task. It is used in the automotive and utilities industries.
The dataset consists of 47420 images with 61082 labeled objects belonging to 7 different classes including longitudinal crack, alligator crack, transverse crack, and other: other corruption, pothole, block crack, and repair.
Images in the RDD2022 dataset have bounding box annotations. There are 21693 (46% of the total) unlabeled images (i.e. without annotations). There are 2 splits in the dataset: train (38385 images) and test (9035 images). Alternatively, the dataset could be split into 7 countries: Japan (13133 images), Norway (10201 images), India (9665 images), United States (6005 images), Czech (3538 images), China_MotorBike (2477 images), and China_Drone (2401 images). Additionally, images labels have detail tag. Explore it in supervisely labeling tool. The dataset was released in 2022 by the JP-IN joint research group.
Explore #
RDD2022 dataset has 47420 images. Click on one of the examples below or open "Explore" tool anytime you need to view dataset images with annotations. This tool has extended visualization capabilities like zoom, translation, objects table, custom filters and more. Hover the mouse over the images to hide or show annotations.


Class balance #
There are 7 annotation classes in the dataset. Find the general statistics and balances for every class in the table below. Click any row to preview images that have labels of the selected class. Sort by column to find the most rare or prevalent classes.

Class ㅤ | Images ㅤ | Objects ㅤ | Count on image average | Area on image average |
|---|---|---|---|---|
longitudinal crack➔ rectangle | 13657 | 26196 | 1.92 | 5.04% |
alligator crack➔ rectangle | 8412 | 10617 | 1.26 | 15.41% |
transverse crack➔ rectangle | 7744 | 11875 | 1.53 | 3.35% |
other corruption➔ rectangle | 4708 | 5850 | 1.24 | 10.8% |
pothole➔ rectangle | 3674 | 6544 | 1.78 | 2.76% |
Co-occurrence matrix #
Co-occurrence matrix is an extremely valuable tool that shows you the images for every pair of classes: how many images have objects of both classes at the same time. If you click any cell, you will see those images. We added the tooltip with an explanation for every cell for your convenience, just hover the mouse over a cell to preview the description.
Images #
Explore every single image in the dataset with respect to the number of annotations of each class it has. Click a row to preview selected image. Sort by any column to find anomalies and edge cases. Use horizontal scroll if the table has many columns for a large number of classes in the dataset.
Object distribution #
Interactive heatmap chart for every class with object distribution shows how many images are in the dataset with a certain number of objects of a specific class. Users can click cell and see the list of all corresponding images.
Class sizes #
The table below gives various size properties of objects for every class. Click a row to see the image with annotations of the selected class. Sort columns to find classes with the smallest or largest objects or understand the size differences between classes.
Class | Object count | Avg area | Max area | Min area | Min height | Min height | Max height | Max height | Avg height | Avg height | Min width | Min width | Max width | Max width |
|---|---|---|---|---|---|---|---|---|---|---|---|---|---|---|
longitudinal crack rectangle | 26196 | 2.67% | 67.25% | 0% | 9px | 0.44% | 983px | 99.8% | 160px | 19.15% | 5px | 0.22% | 1728px | 99.8% |
transverse crack rectangle | 11875 | 2.19% | 67.25% | 0% | 5px | 0.24% | 1106px | 67.38% | 42px | 5.78% | 14px | 0.77% | 2376px | 99.8% |
alligator crack rectangle | 10617 | 12.25% | 94.27% | 0% | 2px | 0.33% | 1017px | 99.8% | 172px | 26.53% | 1px | 0.17% | 1334px | 99.9% |
pothole rectangle | 6544 | 1.56% | 38.89% | 0% | 8px | 0.44% | 467px | 85.74% | 58px | 8% | 7px | 0.52% | 803px | 99.72% |
other corruption rectangle | 5850 | 8.75% | 60.51% | 0.08% | 12px | 2% | 458px | 84.81% | 149px | 24.26% | 11px | 1.83% | 716px | 99.83% |
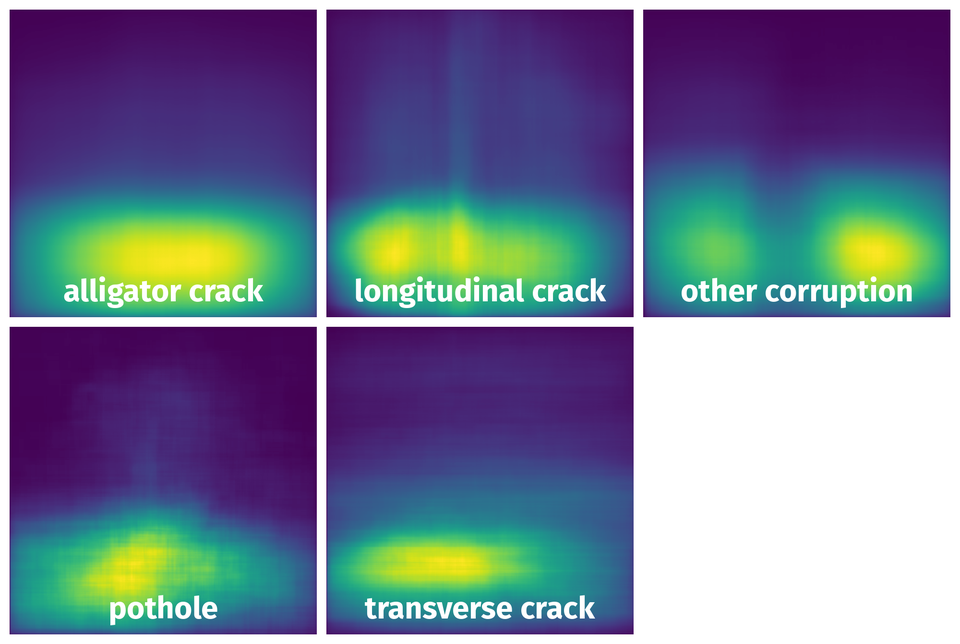
Spatial Heatmap #
The heatmaps below give the spatial distributions of all objects for every class. These visualizations provide insights into the most probable and rare object locations on the image. It helps analyze objects' placements in a dataset.
Objects #
Table contains all 61082 objects. Click a row to preview an image with annotations, and use search or pagination to navigate. Sort columns to find outliers in the dataset.
Object ID ㅤ | Class ㅤ | Image name click row to open | Image size height x width | Height ㅤ | Height ㅤ | Width ㅤ | Width ㅤ | Area ㅤ |
|---|---|---|---|---|---|---|---|---|
1➔ | longitudinal crack rectangle | Japan_007011.jpg | 600 x 600 | 42px | 7% | 61px | 10.17% | 0.71% |
2➔ | longitudinal crack rectangle | United_States_003376.jpg | 640 x 640 | 53px | 8.28% | 41px | 6.41% | 0.53% |
3➔ | longitudinal crack rectangle | China_MotorBike_000378.jpg | 512 x 512 | 248px | 48.44% | 113px | 22.07% | 10.69% |
4➔ | longitudinal crack rectangle | China_MotorBike_000378.jpg | 512 x 512 | 185px | 36.13% | 98px | 19.14% | 6.92% |
5➔ | longitudinal crack rectangle | Norway_002422.jpg | 2044 x 3650 | 75px | 3.67% | 44px | 1.21% | 0.04% |
6➔ | longitudinal crack rectangle | Norway_002422.jpg | 2044 x 3650 | 116px | 5.68% | 94px | 2.58% | 0.15% |
7➔ | longitudinal crack rectangle | Norway_002422.jpg | 2044 x 3650 | 284px | 13.89% | 54px | 1.48% | 0.21% |
8➔ | longitudinal crack rectangle | Norway_002422.jpg | 2044 x 3650 | 126px | 6.16% | 69px | 1.89% | 0.12% |
9➔ | longitudinal crack rectangle | Norway_002422.jpg | 2044 x 3650 | 102px | 4.99% | 76px | 2.08% | 0.1% |
10➔ | longitudinal crack rectangle | China_Drone_000074.jpg | 512 x 512 | 177px | 34.57% | 34px | 6.64% | 2.3% |
License #
The multi-national Road Damage Dataset 2022 is under CC BY-SA 4.0 license.
Citation #
If you make use of the Road Damage Detection 2022 data, please cite the following reference:
@inproceedings{arya2022crowdsensing,
  title={Crowdsensing-based Road Damage Detection Challenge (CRDDC’2022)},
  author={Arya, Deeksha and Maeda, Hiroya and Ghosh, Sanjay Kumar and Toshniwal, Durga and Omata, Hiroshi and Kashiyama, Takehiro and Sekimoto, Yoshihide},
  booktitle={2022 IEEE International Conference on Big Data (Big Data)},
  pages={6378--6386},
  year={2022},
  organization={IEEE}
}

@article{arya2022rdd2022,
  title={RDD2022: A multi-national image dataset for automatic Road Damage Detection},
  author={Arya, Deeksha and Maeda, Hiroya and Ghosh, Sanjay Kumar and Toshniwal, Durga and Sekimoto, Yoshihide},
  journal={arXiv preprint arXiv:2209.08538},
  year={2022}
}

@article{arya2021deep,
  title={Deep learning-based road damage detection and classification for multiple countries},
  author={Arya, Deeksha and Maeda, Hiroya and Ghosh, Sanjay Kumar and Toshniwal, Durga and Mraz, Alexander and Kashiyama, Takehiro and Sekimoto, Yoshihide},
  journal={Automation in Construction},
  volume={132},
  pages={103935},
  year={2021},
  publisher={Elsevier}
}

@article{arya2021rdd2020,
  title={RDD2020: An annotated image dataset for automatic road damage detection using deep learning},
  author={Arya, Deeksha and Maeda, Hiroya and Ghosh, Sanjay Kumar and Toshniwal, Durga and Sekimoto, Yoshihide},
  journal={Data in brief},
  volume={36},
  pages={107133},
  year={2021},
  publisher={Elsevier}

@inproceedings{arya2020global,
  title={Global road damage detection: State-of-the-art solutions},
  author={Arya, Deeksha and Maeda, Hiroya and Ghosh, Sanjay Kumar and Toshniwal, Durga and Omata, Hiroshi and Kashiyama, Takehiro and Sekimoto, Yoshihide},
  booktitle={2020 IEEE International Conference on Big Data (Big Data)},
  pages={5533--5539},
  year={2020},
  organization={IEEE}
}
If you are happy with Dataset Ninja and use provided visualizations and tools in your work, please cite us:
@misc{ visualization-tools-for-road-damage-detector-dataset,
  title = { Visualization Tools for RDD2022 Dataset },
  type = { Computer Vision Tools },
  author = { Dataset Ninja },
  howpublished = { \url{ https://datasetninja.com/road-damage-detector } },
  url = { https://datasetninja.com/road-damage-detector },
  journal = { Dataset Ninja },
  publisher = { Dataset Ninja },
  year = { 2026 },
  month = { jul },
  note = { visited on 2026-07-24 },
}
Download #
Dataset RDD2022 can be downloaded in Supervisely format:
As an alternative, it can be downloaded with dataset-tools package:
pip install --upgrade dataset-tools
… using following python code:
import dataset_tools as dtools

dtools.download(dataset='RDD2022', dst_dir='~/dataset-ninja/')
Make sure not to overlook the python code example available on the Supervisely Developer Portal. It will give you a clear idea of how to effortlessly work with the downloaded dataset.
The data in original format can be downloaded here.
Disclaimer #
Our gal from the legal dep told us we need to post this:
Dataset Ninja provides visualizations and statistics for some datasets that can be found online and can be downloaded by general audience. Dataset Ninja is not a dataset hosting platform and can only be used for informational purposes. The platform does not claim any rights for the original content, including images, videos, annotations and descriptions. Joint publishing is prohibited.
You take full responsibility when you use datasets presented at Dataset Ninja, as well as other information, including visualizations and statistics we provide. You are in charge of compliance with any dataset license and all other permissions. You are required to navigate datasets homepage and make sure that you can use it. In case of any questions, get in touch with us at hello@datasetninja.com.