

Introduction #
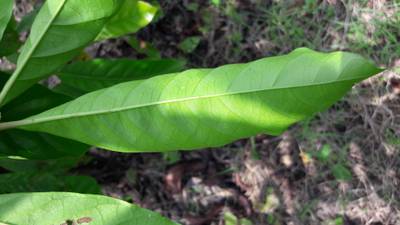
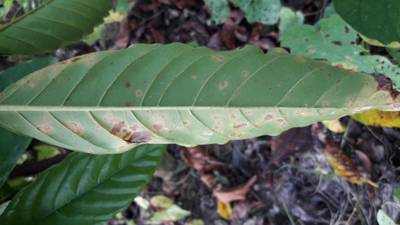
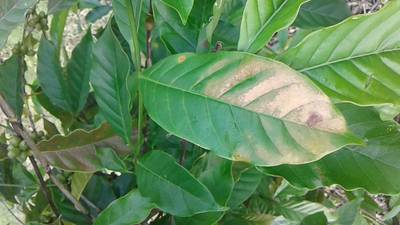
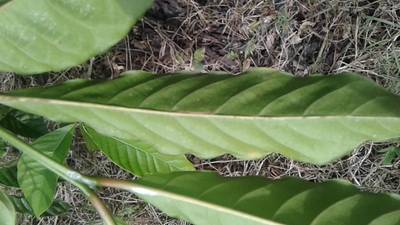
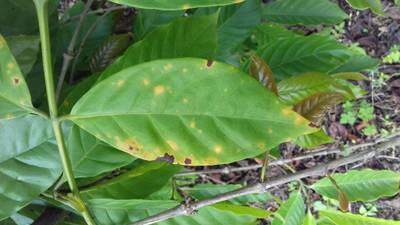
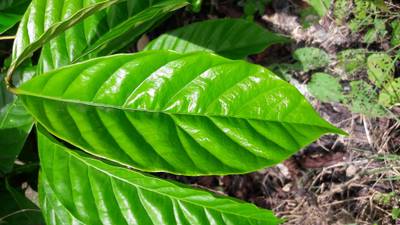
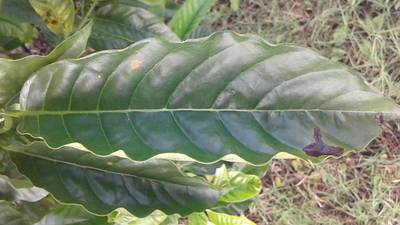
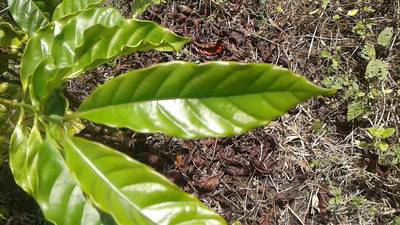
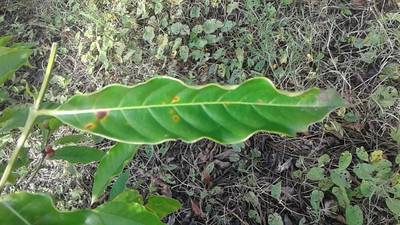
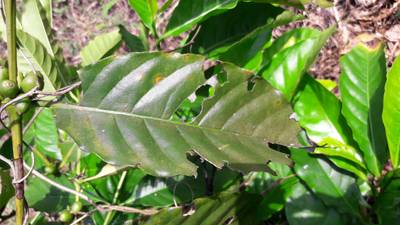
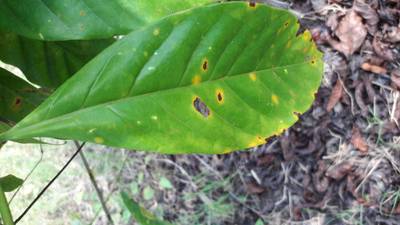
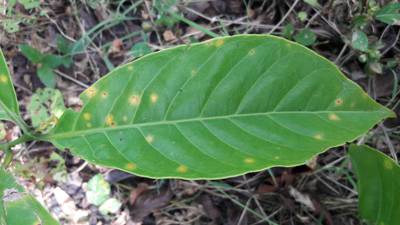
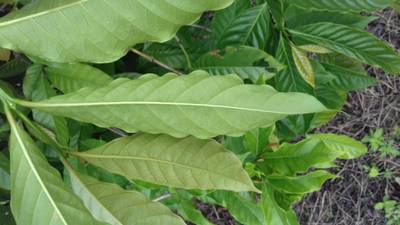
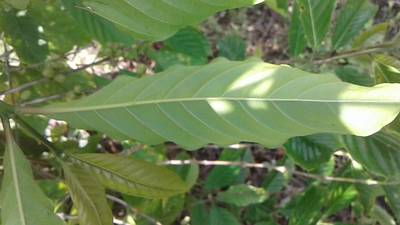
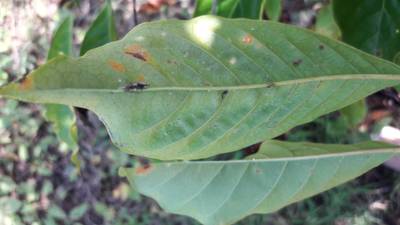
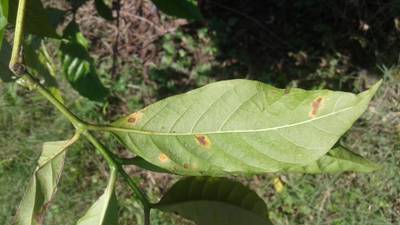
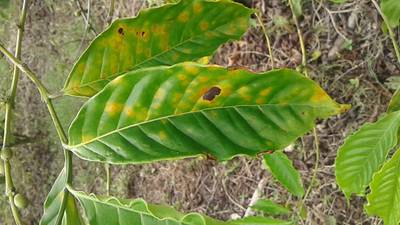
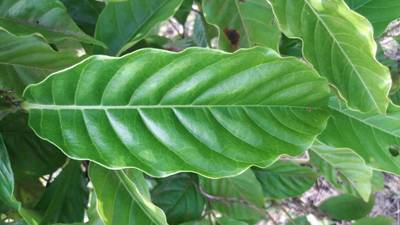
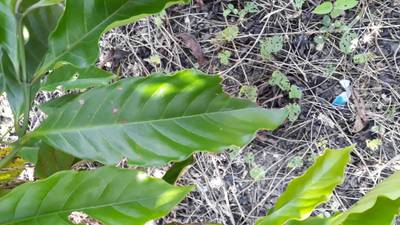
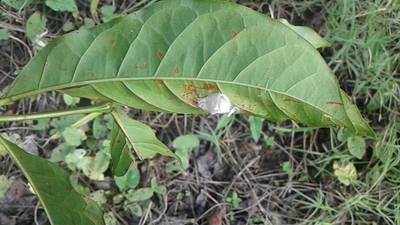
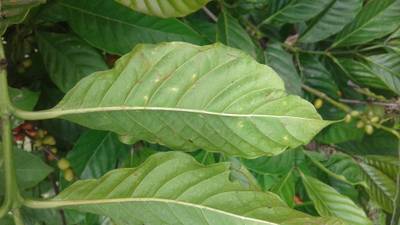
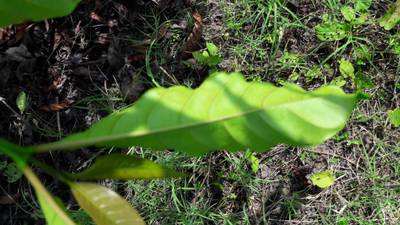
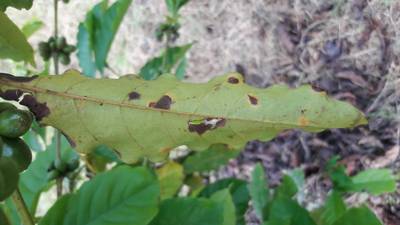
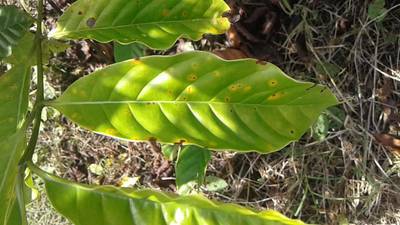
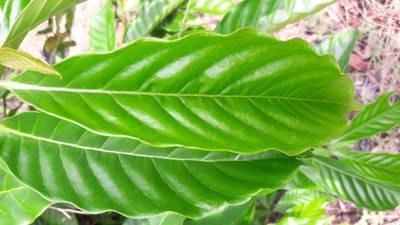
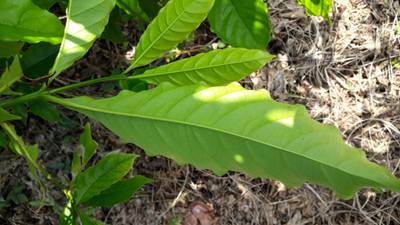
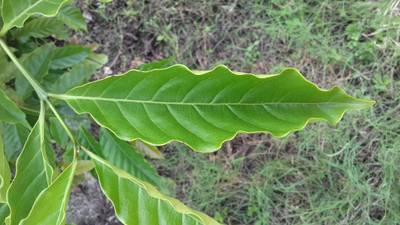
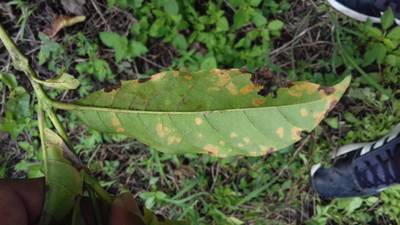
The authors present RoCoLe: A Robusta Coffee Leaf Images Dataset. It comprises 1560 leaf images that exhibit visible red mites and spots to indicate the presence of coffee leaf rust in infection cases. For healthy cases, the dataset includes images without such structures. The dataset also contains annotations describing objects (leaves), their state (healthy or unhealthy), and the severity of disease based on the leaf area with spots. All images were captured under real-world conditions in the same coffee plant field using a smartphone camera. The RoCoLe dataset serves as a valuable resource for assessing the performance of machine learning algorithms in image segmentation and classification tasks related to plant disease recognition.
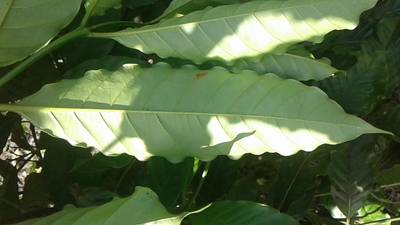
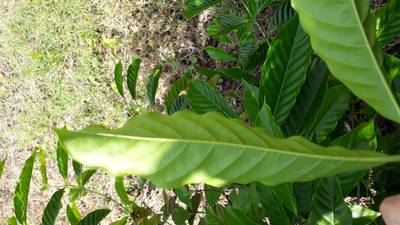
RoCoLe offers a collection of images in binary and multiclass classification problems, as well as segmentation tasks related to plant disease recognition. This dataset encompasses images of both the upper and back sides of coffee leaves collected from robusta coffee crops, representing various states (healthy and unhealthy), the presence of diseases (rust and red_spider_mite), and varying levels of infection severity. Specifically, there are four images available for each of the 390 coffee plants included in the study, resulting in a total of 1560 robusta coffee leaf images in the dataset.
Experimental Design, Materials, and Methods
The images of healthy and unhealthy coffee plant leaves were captured using a 5-MP smartphone camera at a working distance of 200-300 mm, without employing zoom. These images were taken under diverse real-world conditions, including variations in lighting (cloudy, sunny, and windy days), backgrounds (other plants and weeds), and temperature levels (high and low humidity). This diversity ensures that the dataset includes real and representative samples of coffee plants. The study area featured a crop with 390 coffee plants, and for each coffee plant, images of both the upper and back sides of healthy and infected leaves were obtained, resulting in the collection of 1560 images in total.
To enhance RoCoLe’s capabilities for evaluating machine learning methods, a comprehensive annotation process was conducted to label all 1560 coffee leaf images. This annotation process was carried out using a Labelbox and encompassed two types of annotations: object segmentation and classification.
The RoCoLe dataset features annotations for object segmentation, where each object (leaf) is recognized and segmented. Additionally, each object is classified as healthy, exhibiting red mite presence, or manifesting rust at various severity levels, namely rust_level_1, rust_level_2, rust_level_3, and rust_level_4. The determination of rust infection severity was based on the OIRSA method, summarized in the following table:
| Level | Affected leaf area (spots) |
|---|---|
| 1 | 1–5% |
| 2 | 6–20% |
| 3 | 21–50% |
| 4 | >50% |
 Homepage
 Research Paper
Summary #
RoCoLe: A Robusta Coffee Leaf Images Dataset is a dataset for a semantic segmentation task. It is used in the agricultural and biological research.
The dataset consists of 1560 images with 2329 labeled objects belonging to 7 different classes including healthy, unhealthy, rust_level_1, and other: red_spider_mite, rust_level_2, rust_level_3, and rust_level_4.
Images in the RoCoLe dataset have pixel-level semantic segmentation annotations. All images are labeled (i.e. with annotations). There are no pre-defined train/val/test splits in the dataset. The dataset was released in 2019 by the Escuela Superior Politecnica Agropecuaria de Manabi, Equador and Universidad de Santiago de Chile.
Here is the visualized example grid with animated annotations:
Explore #
RoCoLe dataset has 1560 images. Click on one of the examples below or open "Explore" tool anytime you need to view dataset images with annotations. This tool has extended visualization capabilities like zoom, translation, objects table, custom filters and more. Hover the mouse over the images to hide or show annotations.


Class balance #
There are 7 annotation classes in the dataset. Find the general statistics and balances for every class in the table below. Click any row to preview images that have labels of the selected class. Sort by column to find the most rare or prevalent classes.

Class ㅤ | Images ㅤ | Objects ㅤ | Count on image average | Area on image average |
|---|---|---|---|---|
healthy➔ polygon | 791 | 791 | 1 | 24.49% |
unhealthy➔ polygon | 769 | 769 | 1 | 27.53% |
rust_level_1➔ polygon | 344 | 344 | 1 | 27.63% |
red_spider_mite➔ polygon | 167 | 167 | 1 | 24.64% |
rust_level_2➔ polygon | 166 | 166 | 1 | 29.12% |
rust_level_3➔ polygon | 62 | 62 | 1 | 29.68% |
rust_level_4➔ polygon | 30 | 30 | 1 | 28.84% |
Co-occurrence matrix #
Co-occurrence matrix is an extremely valuable tool that shows you the images for every pair of classes: how many images have objects of both classes at the same time. If you click any cell, you will see those images. We added the tooltip with an explanation for every cell for your convenience, just hover the mouse over a cell to preview the description.
Images #
Explore every single image in the dataset with respect to the number of annotations of each class it has. Click a row to preview selected image. Sort by any column to find anomalies and edge cases. Use horizontal scroll if the table has many columns for a large number of classes in the dataset.
Object distribution #
Interactive heatmap chart for every class with object distribution shows how many images are in the dataset with a certain number of objects of a specific class. Users can click cell and see the list of all corresponding images.
Class sizes #
The table below gives various size properties of objects for every class. Click a row to see the image with annotations of the selected class. Sort columns to find classes with the smallest or largest objects or understand the size differences between classes.
Class | Object count | Avg area | Max area | Min area | Min height | Min height | Max height | Max height | Avg height | Avg height | Min width | Min width | Max width | Max width |
|---|---|---|---|---|---|---|---|---|---|---|---|---|---|---|
healthy polygon | 791 | 24.4% | 58.01% | 6.06% | 198px | 22.91% | 2205px | 94.96% | 603px | 49.64% | 568px | 16.76% | 4058px | 100% |
unhealthy polygon | 769 | 27.45% | 55.37% | 7.79% | 202px | 22.95% | 1926px | 99.58% | 678px | 55.39% | 436px | 33.14% | 4091px | 100% |
rust_level_1 polygon | 344 | 27.54% | 55.37% | 8.5% | 202px | 28.06% | 1818px | 95.75% | 627px | 53.61% | 556px | 33.89% | 4091px | 100% |
red_spider_mite polygon | 167 | 24.58% | 53.9% | 7.79% | 273px | 25.88% | 1926px | 93.84% | 813px | 54.7% | 750px | 33.14% | 3757px | 100% |
rust_level_2 polygon | 166 | 29.04% | 53.45% | 10.59% | 229px | 22.95% | 1510px | 94.58% | 637px | 57.76% | 616px | 36.58% | 3619px | 100% |
rust_level_3 polygon | 62 | 29.6% | 50.13% | 9.37% | 271px | 33.81% | 1245px | 99.58% | 684px | 58.26% | 436px | 34.06% | 2997px | 99.66% |
rust_level_4 polygon | 30 | 28.77% | 47.56% | 13.92% | 322px | 43.8% | 1202px | 95.69% | 758px | 60.89% | 654px | 47.48% | 3204px | 95.39% |
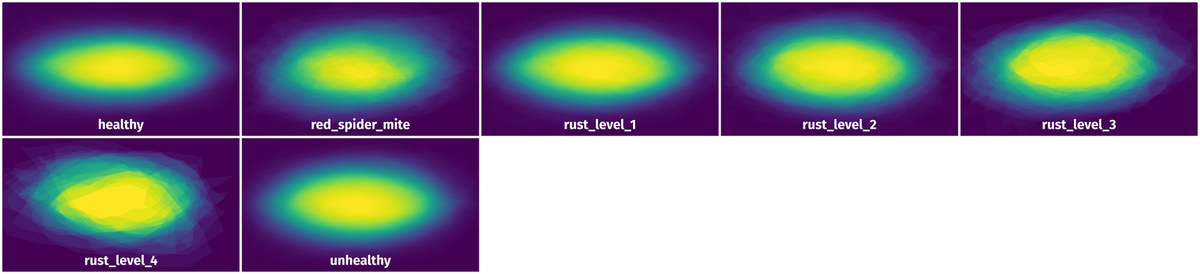
Spatial Heatmap #
The heatmaps below give the spatial distributions of all objects for every class. These visualizations provide insights into the most probable and rare object locations on the image. It helps analyze objects' placements in a dataset.
Objects #
Table contains all 2329 objects. Click a row to preview an image with annotations, and use search or pagination to navigate. Sort columns to find outliers in the dataset.
Object ID ㅤ | Class ㅤ | Image name click row to open | Image size height x width | Height ㅤ | Height ㅤ | Width ㅤ | Width ㅤ | Area ㅤ |
|---|---|---|---|---|---|---|---|---|
1➔ | healthy polygon | cjvqu5atniqn50804yaf615x2.jpeg | 1152 x 2048 | 545px | 47.31% | 1552px | 75.78% | 23.01% |
2➔ | unhealthy polygon | cjvnypugkphy10804bi8r0iea.jpeg | 2322 x 4128 | 1064px | 45.82% | 2445px | 59.23% | 17.77% |
3➔ | red_spider_mite polygon | cjvnypugkphy10804bi8r0iea.jpeg | 2322 x 4128 | 1064px | 45.82% | 2445px | 59.23% | 17.77% |
4➔ | unhealthy polygon | cjvqrdazphxgb0a08yzfef0ib.jpeg | 720 x 1280 | 343px | 47.64% | 1074px | 83.91% | 26.08% |
5➔ | rust_level_2 polygon | cjvqrdazphxgb0a08yzfef0ib.jpeg | 720 x 1280 | 343px | 47.64% | 1074px | 83.91% | 26.08% |
6➔ | unhealthy polygon | cjvnf8dd6fz1s0828a8zwknn1.jpeg | 1152 x 2048 | 524px | 45.49% | 1388px | 67.77% | 18.89% |
7➔ | rust_level_2 polygon | cjvnf8dd6fz1s0828a8zwknn1.jpeg | 1152 x 2048 | 524px | 45.49% | 1388px | 67.77% | 18.89% |
8➔ | unhealthy polygon | cjvqw64e3j3tr0828u6quizmg.jpeg | 1152 x 2048 | 508px | 44.1% | 1890px | 92.29% | 26.56% |
9➔ | rust_level_2 polygon | cjvqw64e3j3tr0828u6quizmg.jpeg | 1152 x 2048 | 508px | 44.1% | 1890px | 92.29% | 26.56% |
10➔ | unhealthy polygon | cjvqtum7cinqh080417541ev4.jpeg | 720 x 1280 | 587px | 81.53% | 622px | 48.59% | 22.28% |
License #
Citation #
If you make use of the RoCoLe data, please cite the following reference:
Parraga-Alava, Jorge; Cusme, Kevin; Loor, Angélica; Santander, Esneider (2019), “RoCoLe: A robusta coffee leaf images dataset ”, Mendeley Data, V2, doi: 10.17632/c5yvn32dzg.2
If you are happy with Dataset Ninja and use provided visualizations and tools in your work, please cite us:
@misc{ visualization-tools-for-rocole-dataset,
  title = { Visualization Tools for RoCoLe Dataset },
  type = { Computer Vision Tools },
  author = { Dataset Ninja },
  howpublished = { \url{ https://datasetninja.com/rocole } },
  url = { https://datasetninja.com/rocole },
  journal = { Dataset Ninja },
  publisher = { Dataset Ninja },
  year = { 2026 },
  month = { jul },
  note = { visited on 2026-07-21 },
}
Download #
Dataset RoCoLe can be downloaded in Supervisely format:
As an alternative, it can be downloaded with dataset-tools package:
pip install --upgrade dataset-tools
… using following python code:
import dataset_tools as dtools

dtools.download(dataset='RoCoLe', dst_dir='~/dataset-ninja/')
Make sure not to overlook the python code example available on the Supervisely Developer Portal. It will give you a clear idea of how to effortlessly work with the downloaded dataset.
The data in original format can be downloaded here.
Disclaimer #
Our gal from the legal dep told us we need to post this:
Dataset Ninja provides visualizations and statistics for some datasets that can be found online and can be downloaded by general audience. Dataset Ninja is not a dataset hosting platform and can only be used for informational purposes. The platform does not claim any rights for the original content, including images, videos, annotations and descriptions. Joint publishing is prohibited.
You take full responsibility when you use datasets presented at Dataset Ninja, as well as other information, including visualizations and statistics we provide. You are in charge of compliance with any dataset license and all other permissions. You are required to navigate datasets homepage and make sure that you can use it. In case of any questions, get in touch with us at hello@datasetninja.com.