

Introduction #
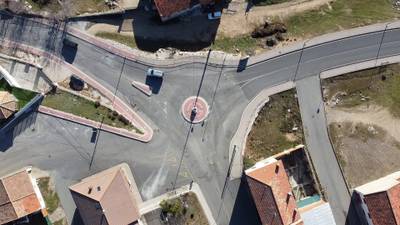
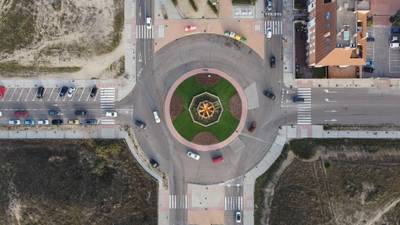
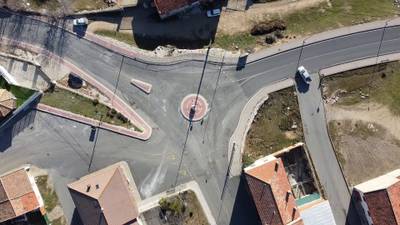
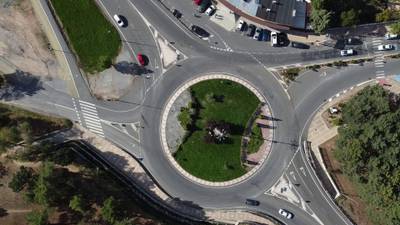
The authors of the Roundabout Aerial Images for Vehicle Detection dataset have compiled a comprehensive collection containing 985,260 instances across 61,896 color images. These images consist of both real captures (15,474) and augmented data (46,422), all in JPG format. These images were sourced from eight distinct roundabouts, each representing various traffic flow conditions. The presented dataset contains real captures only.
| Roundabout (scenes) | Frames | Car | Truck | Cycle | Bus | Empty |
|---|---|---|---|---|---|---|
| 1 (00001) | 1,996 | 34,558 | 0 | 4229 | 0 | 0 |
| 2 (00002) | 514 | 743 | 0 | 0 | 0 | 157 |
| 3 (00003-00017) | 1,795 | 4822 | 58 | 0 | 0 | 0 |
| 4 (00018-00033) | 1,027 | 6615 | 0 | 0 | 0 | 0 |
| 5 (00034-00049) | 1,261 | 2248 | 0 | 550 | 0 | 81 |
| 6 (00050-00052) | 5,501 | 180,342 | 1420 | 120 | 1376 | 0 |
| 7 (00053) | 2,036 | 5,789 | 562 | 0 | 226 | 92 |
| 8 (00054) | 1,344 | 1,733 | 222 | 0 | 150 | 222 |
| Total | 15,474 | 236,850 | 2,262 | 4,899 | 1,752 | 552 |
| Data augmentation (*) | x4 | x4 | x4 | x4 | x4 | x4 |
| Total | 61,896 | 947,400 | 9,048 | 19,596 | 7,008 | 2,208 |
(*) Data augmentation: Augmented data is available in the first version of the dataset.
Given the meticulous nature of image annotation, the authors employed an effective methodology to streamline the process which minimizes manual annotation efforts. This involves annotating a limited number of images to train Convolutional Neural Network (CNN) models capable of auto-annotating additional cases. Although these auto-annotations necessitate review, this approach reduces the need for extensive manual work. To further enhance dataset diversity without additional annotation, the authors applied data augmentation techniques, generating apparent new images.
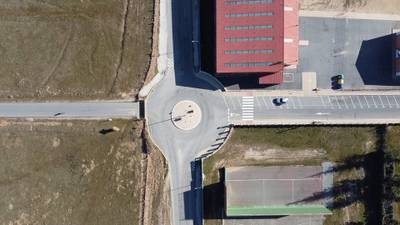
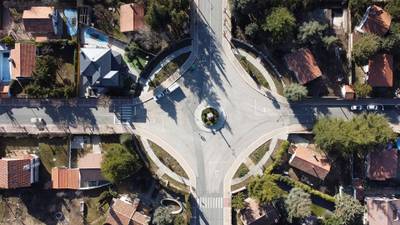
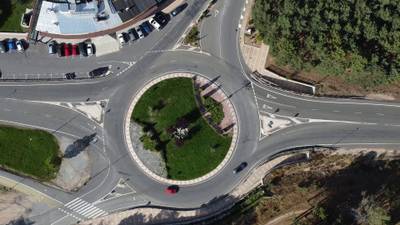
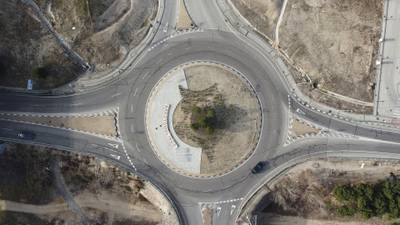
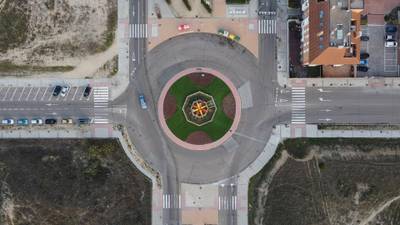
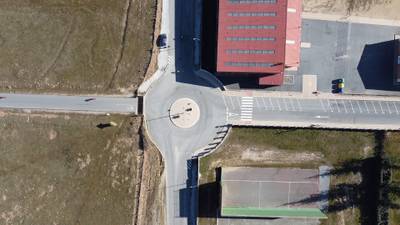
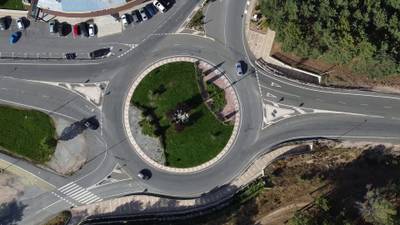
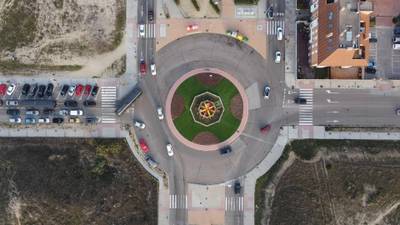
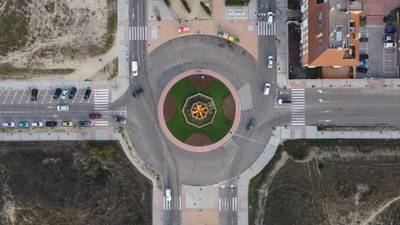
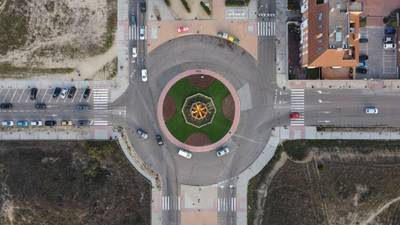
The data collection process began by recording aerial videos of roundabouts and filtering out poor-quality segments. Captured using a DJI Mavic Mini 2 drone under varying conditions, these videos were shot during daylight from different heights. Heights between 100 and 120 meters were chosen to maintain the roundabout’s visibility with entrances and exits discernible. This height range corresponded to a ground sampling distance (GSD) of 6.67 to 8 cm per image pixel.
Subsequent steps involved manual annotation of frames extracted from the videos using a Python script and annotation software. Annotations were created in PASCAL VOC XML format, generating an individual XML file for each image. To enhance dataset volume, data augmentation was applied using the OpenCV library and Python scripting. Synthetic images were generated by employing various flips, including horizontal, vertical, and combined orientations. This is a technique widely used to create seemingly new examples with the least amount of work.
 Homepage
 Research Paper
Summary #
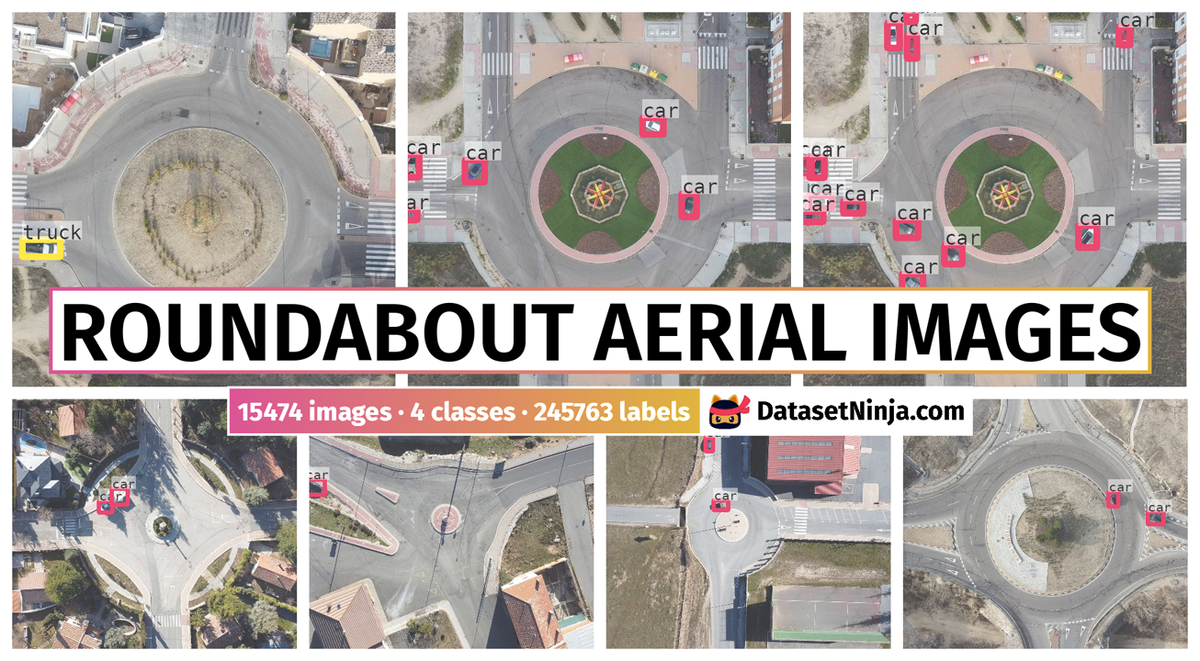
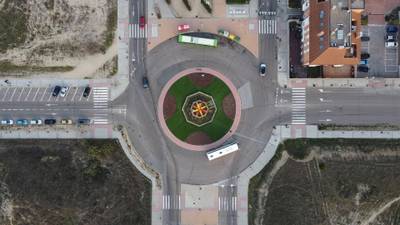
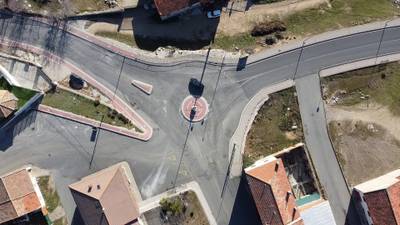
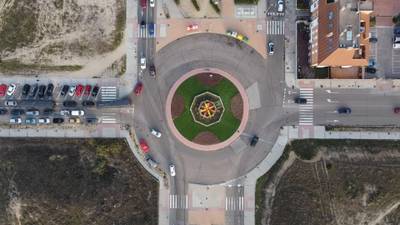
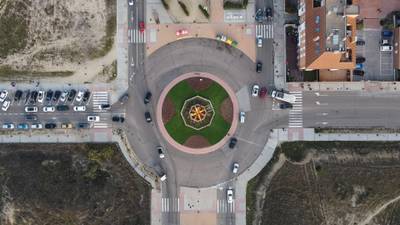
Roundabout Aerial Images for Vehicle Detection is a dataset for an object detection task. It is used in the vehicle detection domain.
The dataset consists of 15474 images with 245763 labeled objects belonging to 4 different classes including car, cycle, truck, and other: bus.
Images in the Roundabout Aerial Images dataset have bounding box annotations. There are 552 (4% of the total) unlabeled images (i.e. without annotations). There are no pre-defined train/val/test splits in the dataset. Additionally, the meta data about roundabout id (8 unique roundabouts), Drone’s lattitude and longitude, its height of exposure and height with zoom is provided. The dataset was released in 2022 by the Universidad Europea de Madrid, SICE Canada Inc., Toronto, and Universidad Francisco de Vitoria, Spain.
Explore #
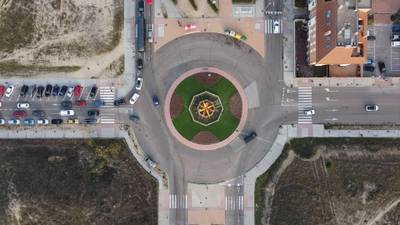
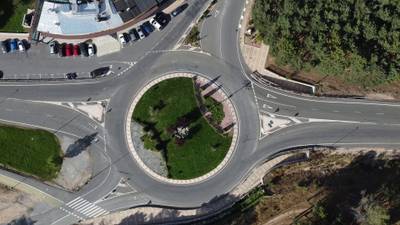
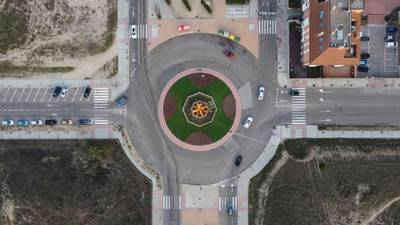
Roundabout Aerial Images dataset has 15474 images. Click on one of the examples below or open "Explore" tool anytime you need to view dataset images with annotations. This tool has extended visualization capabilities like zoom, translation, objects table, custom filters and more. Hover the mouse over the images to hide or show annotations.


Class balance #
There are 4 annotation classes in the dataset. Find the general statistics and balances for every class in the table below. Click any row to preview images that have labels of the selected class. Sort by column to find the most rare or prevalent classes.

Class ㅤ | Images ㅤ | Objects ㅤ | Count on image average | Area on image average |
|---|---|---|---|---|
car➔ rectangle | 14739 | 236850 | 16.07 | 1.86% |
cycle➔ rectangle | 2406 | 4899 | 2.04 | 0.06% |
truck➔ rectangle | 1900 | 2262 | 1.19 | 0.53% |
bus➔ rectangle | 1506 | 1752 | 1.16 | 0.69% |
Co-occurrence matrix #
Co-occurrence matrix is an extremely valuable tool that shows you the images for every pair of classes: how many images have objects of both classes at the same time. If you click any cell, you will see those images. We added the tooltip with an explanation for every cell for your convenience, just hover the mouse over a cell to preview the description.
Images #
Explore every single image in the dataset with respect to the number of annotations of each class it has. Click a row to preview selected image. Sort by any column to find anomalies and edge cases. Use horizontal scroll if the table has many columns for a large number of classes in the dataset.
Object distribution #
Interactive heatmap chart for every class with object distribution shows how many images are in the dataset with a certain number of objects of a specific class. Users can click cell and see the list of all corresponding images.
Class sizes #
The table below gives various size properties of objects for every class. Click a row to see the image with annotations of the selected class. Sort columns to find classes with the smallest or largest objects or understand the size differences between classes.
Class | Object count | Avg area | Max area | Min area | Min height | Min height | Max height | Max height | Avg height | Avg height | Min width | Min width | Max width | Max width |
|---|---|---|---|---|---|---|---|---|---|---|---|---|---|---|
car rectangle | 236850 | 0.12% | 1.57% | 0% | 2px | 0.19% | 146px | 13.52% | 48px | 4.46% | 2px | 0.1% | 227px | 11.82% |
cycle rectangle | 4899 | 0.03% | 0.1% | 0% | 8px | 0.74% | 44px | 4.07% | 29px | 2.71% | 8px | 0.42% | 69px | 3.59% |
truck rectangle | 2262 | 0.44% | 2.04% | 0% | 5px | 0.46% | 202px | 18.7% | 85px | 7.85% | 4px | 0.21% | 262px | 13.65% |
bus rectangle | 1752 | 0.6% | 1.68% | 0.04% | 23px | 2.13% | 211px | 19.54% | 106px | 9.86% | 31px | 1.61% | 269px | 14.01% |
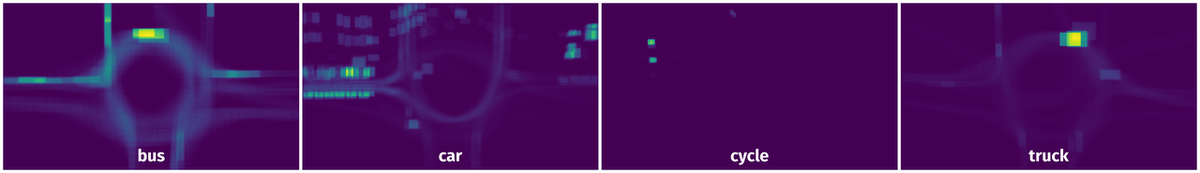
Spatial Heatmap #
The heatmaps below give the spatial distributions of all objects for every class. These visualizations provide insights into the most probable and rare object locations on the image. It helps analyze objects' placements in a dataset.
Objects #
Table contains all 245763 objects. Click a row to preview an image with annotations, and use search or pagination to navigate. Sort columns to find outliers in the dataset.
Object ID ㅤ | Class ㅤ | Image name click row to open | Image size height x width | Height ㅤ | Height ㅤ | Width ㅤ | Width ㅤ | Area ㅤ |
|---|---|---|---|---|---|---|---|---|
1➔ | car rectangle | 00001_frame000258_original.jpg | 1080 x 1920 | 66px | 6.11% | 69px | 3.59% | 0.22% |
2➔ | car rectangle | 00001_frame000258_original.jpg | 1080 x 1920 | 61px | 5.65% | 56px | 2.92% | 0.16% |
3➔ | car rectangle | 00001_frame000258_original.jpg | 1080 x 1920 | 62px | 5.74% | 55px | 2.86% | 0.16% |
4➔ | car rectangle | 00001_frame000258_original.jpg | 1080 x 1920 | 57px | 5.28% | 64px | 3.33% | 0.18% |
5➔ | car rectangle | 00001_frame000258_original.jpg | 1080 x 1920 | 72px | 6.67% | 43px | 2.24% | 0.15% |
6➔ | car rectangle | 00001_frame000258_original.jpg | 1080 x 1920 | 37px | 3.43% | 76px | 3.96% | 0.14% |
7➔ | car rectangle | 00001_frame000258_original.jpg | 1080 x 1920 | 74px | 6.85% | 42px | 2.19% | 0.15% |
8➔ | car rectangle | 00001_frame000258_original.jpg | 1080 x 1920 | 74px | 6.85% | 54px | 2.81% | 0.19% |
9➔ | car rectangle | 00001_frame000258_original.jpg | 1080 x 1920 | 72px | 6.67% | 38px | 1.98% | 0.13% |
10➔ | car rectangle | 00001_frame000258_original.jpg | 1080 x 1920 | 62px | 5.74% | 61px | 3.18% | 0.18% |
License #
Roundabout Aerial Images for Vehicle Detection is under CC BY-NC-SA 4.0 license.
Citation #
If you make use of the Roundabout Aerial Images data, please cite the following reference:
Puertas, E.; De-Las-Heras, G.; Fernández-Andrés, J.; Sánchez-Soriano, J. Dataset: Roundabout Aerial Images for Vehicle Detection. Data 2022, 7, 47. https://doi.org/10.3390/data7040047
If you are happy with Dataset Ninja and use provided visualizations and tools in your work, please cite us:
@misc{ visualization-tools-for-roundabout-aerial-images-for-vehicle-detection-dataset,
  title = { Visualization Tools for Roundabout Aerial Images Dataset },
  type = { Computer Vision Tools },
  author = { Dataset Ninja },
  howpublished = { \url{ https://datasetninja.com/roundabout-aerial-images-for-vehicle-detection } },
  url = { https://datasetninja.com/roundabout-aerial-images-for-vehicle-detection },
  journal = { Dataset Ninja },
  publisher = { Dataset Ninja },
  year = { 2026 },
  month = { jul },
  note = { visited on 2026-07-27 },
}
Download #
Dataset Roundabout Aerial Images can be downloaded in Supervisely format:
As an alternative, it can be downloaded with dataset-tools package:
pip install --upgrade dataset-tools
… using following python code:
import dataset_tools as dtools

dtools.download(dataset='Roundabout Aerial Images', dst_dir='~/dataset-ninja/')
Make sure not to overlook the python code example available on the Supervisely Developer Portal. It will give you a clear idea of how to effortlessly work with the downloaded dataset.
The data in original format can be downloaded here.
Disclaimer #
Our gal from the legal dep told us we need to post this:
Dataset Ninja provides visualizations and statistics for some datasets that can be found online and can be downloaded by general audience. Dataset Ninja is not a dataset hosting platform and can only be used for informational purposes. The platform does not claim any rights for the original content, including images, videos, annotations and descriptions. Joint publishing is prohibited.
You take full responsibility when you use datasets presented at Dataset Ninja, as well as other information, including visualizations and statistics we provide. You are in charge of compliance with any dataset license and all other permissions. You are required to navigate datasets homepage and make sure that you can use it. In case of any questions, get in touch with us at hello@datasetninja.com.