

Introduction #
The authors introduce the RUGD: Robot Unstructured Ground Driving Dataset with video sequences captured from a small, unmanned mobile robot traversing in unstructured environments. This data differs from existing autonomous driving benchmark data in that it contains significantly more terrain types, irregular class boundaries, minimal structured markings, and presents challenging visual properties often experienced in off road navigation, e.g., blurred frames. Over 7, 000 frames of pixel-wise annotation are included with this dataset.
Motivation
The development of extensive, labeled visual benchmark datasets has played a pivotal role in advancing the state-of-the-art in recognition, detection, and semantic segmentation. The success of these techniques has elevated visual perception to a primary information source for making navigation decisions on autonomous vehicles. Consequently, a multitude of benchmark datasets tailored specifically for autonomous navigation have emerged, featuring real-world scenarios where vehicles navigate through urban environments, interacting with pedestrians, bicycles, and other vehicles on roadways. These datasets serve as essential tools for evaluating progress toward the release of safe and reliable autonomous products.
Despite substantial strides in autonomous driving technologies, the current state-of-the-art is primarily tailored to well-paved and clearly outlined roadways. However, applications like Humanitarian Assistance and Disaster Relief (HADR), agricultural robotics, environmental surveying in hazardous areas, and humanitarian demining present environments that lack the structured and easily identifiable features commonly found in urban cities. Operating in these unstructured, off-road driving scenarios necessitates a visual perception system capable of semantically segmenting scenes with highly irregular class boundaries. This system must precisely localize and recognize terrain, vegetation, man-made structures, debris, and other hazards to assess traversability and ensure safety.
Irregular boundaries are common in unstructured environments as seen in this example image and annotation. This challenging property exists throughout all sequences in the RUGD dataset and arises because of the natural growth and pourous-like texture of vegetation and occlusion.
Because existing benchmark datasets for self-driving vehicles are collected from urban cities, they seldom contain elements that may be present in unstructured environments. As such, there is a need for an entirely new dataset relevant to these driving conditions, where structured cues cannot be readily relied on by the autonomous system.
Dataset description
Robot Unstructured Ground Driving (RUGD) dataset, is composed of a set of video sequences collected from a small unmanned ground robot performing an exploration task in a variety of natural, unstructured environments and semi-urban areas. In addition to the raw frame sequences, RUGD contains dense pixel-wise annotations for every fifth frame in a sequence, providing a total of 7, 453 labeled images for learning and evaluation in this new driving scenario.
Example ground truth annotations provided in the RUGD dataset. Frames from the video sequences are densely annotated with pixel-wise labels from 24 different visual classes.
The unique characteristics, and thus, major contributions, of the RUGD dataset can be summarized as follows:
- The majority of scenes contain no discernible geometric edges or vanishing points, and semantic boundaries are highly irregular.
- Robot exploration traversal creates irregular routes that do not adhere to a single terrain type; eight distinct terrains are traversed.
- Unique frame viewpoints are encountered due to sloped terrains and vegetation occlusion.
- Off-road traversal of rough terrain results in challenging frame focus.
These characteristics provide realistic off-road driving scenarios that present a variety of new challenges to the research community in addition to existing ones, e.g., illumination changes and harsh shadows. The authors provide an initial semantic segmentation benchmark using several current state-of-the-art semantic segmentation architectures, originally developed for indoor and urban scene segmentation.
Dataset collection
The robot used to collect the RUGD dataset is based on a Clearpath ‘Husky’ platform. The robot chassis is equipped with a sensor payload consisting of a Velodyne HDL-32 LiDAR, a Garmin GPS receiver, a Microstrain GX3-25 IMU, and a Prosilica GT2750C camera. The camera is capable of 6.1 megapixels at 19.8 frames per second, but most sequences are collected at half resolution and approximately 15 frames per second. This reduction in resolution and frame rate provides a compromise between file size and quality. The images are collected through an 8mm lens with a wide depth of field for outdoor lighting conditions, with exposure and gain settings for minimized motion blur. The robot typically operated at its top speed of 1.0 m/s. This platform provides a unique camera viewpoint compared to existing data. The Husky is significantly smaller than vehicles commonly used in urban environments, with external dimensions of 990 x 670 x 390 mm. The camera sensor is mounted on the front of the platform just above the external height of the robot, resulting in an environment viewpoint from less than 25 centimeters off the ground.
Robot used to collect the RUGD dataset.
RUGD is a collection of robot exploration video sequences captured as a human teleoperates the robot in the environment. The exploration task is defined such that the human operator maneuvers the robot to mimic autonomous behavior aimed at trying to visually observe different regions of the environment. Given this definition, the sequences depict the robot traversing not only on what may be commonly defined as a road, but also through vegetation, over small obstacles,
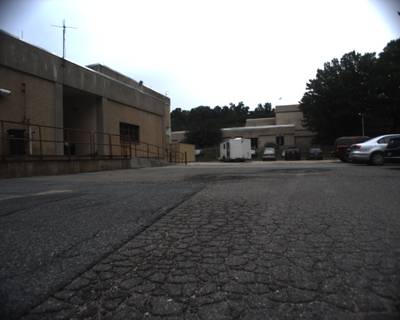
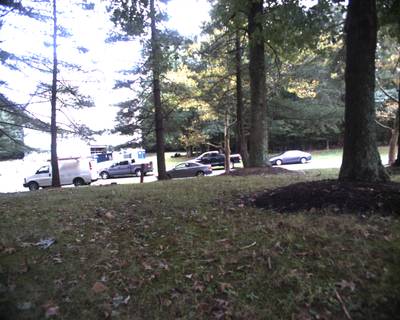
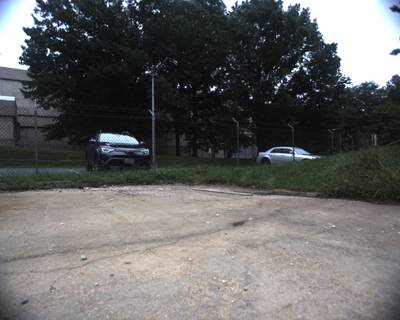
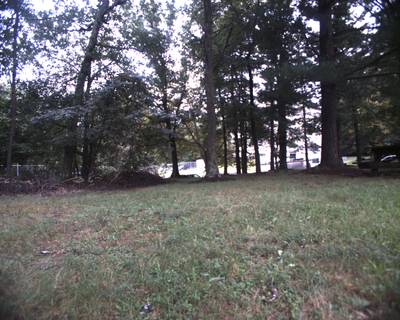
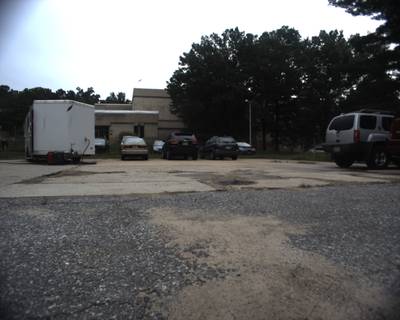
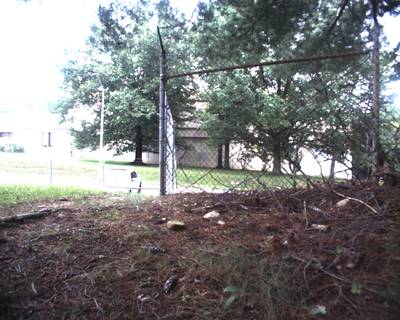
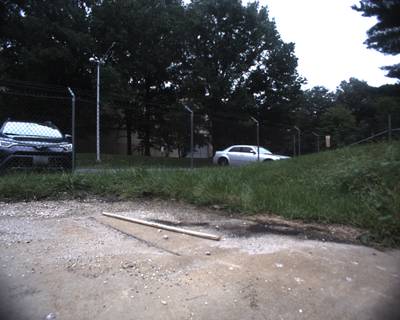
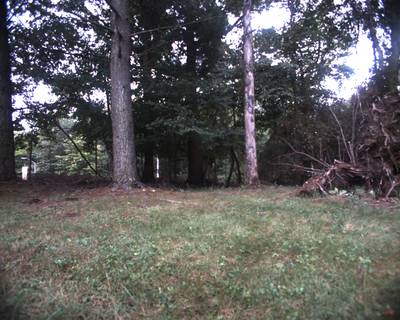
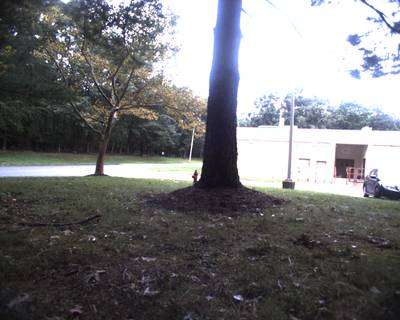
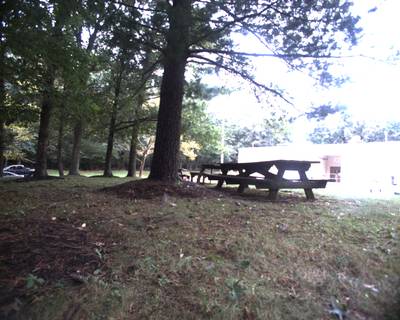
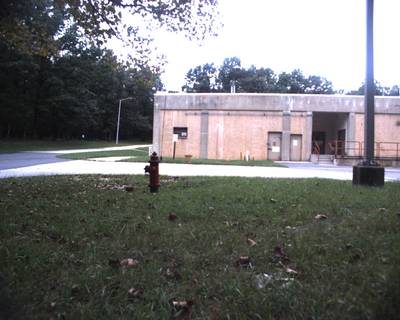
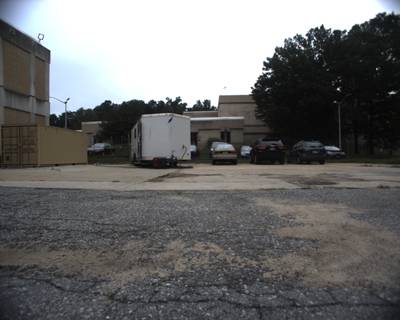
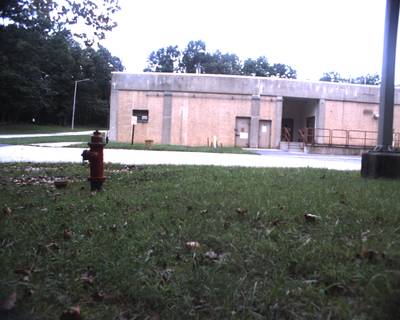
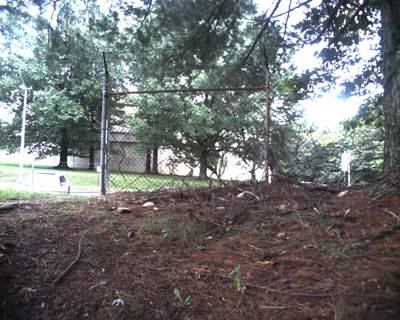
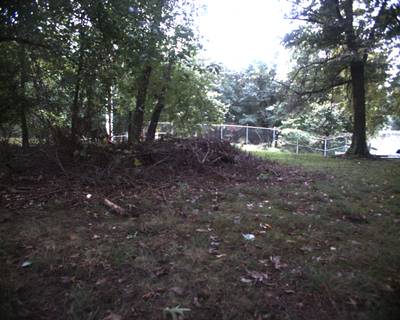
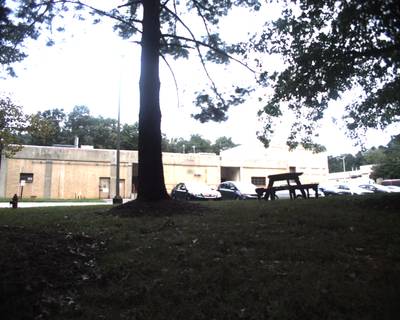
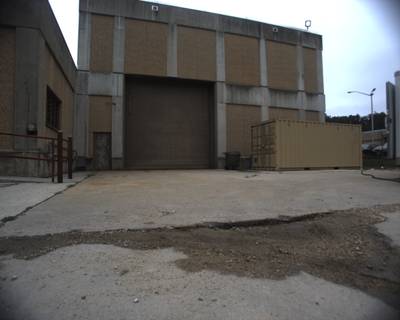
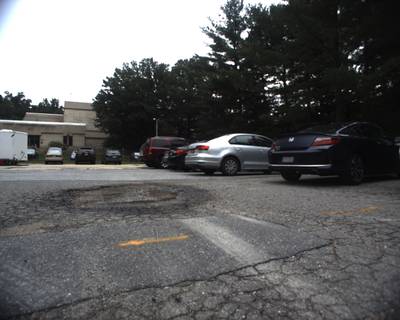
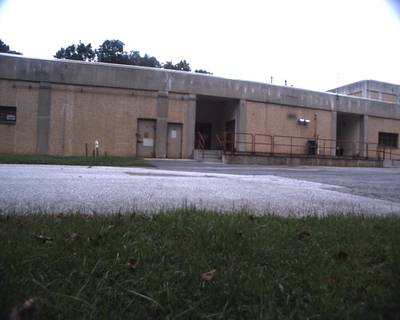
and other terrain present in the area. The average duration of a video sequence is just over 3 minutes. Exploration traversals are performed in areas that represent four general environment categories: creek - areas near a body of water with some vegetation, park - woodsy areas with buildings and paved roads, trail - areas representing non-paved, gravel terrain in woods, village - areas with buildings and limited paved roads.
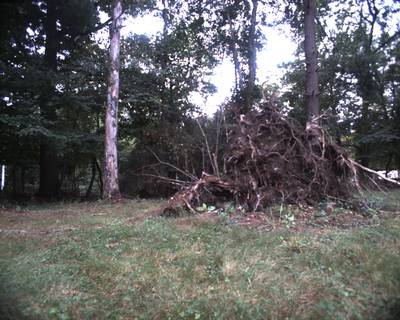
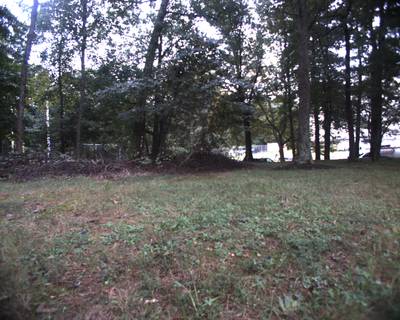
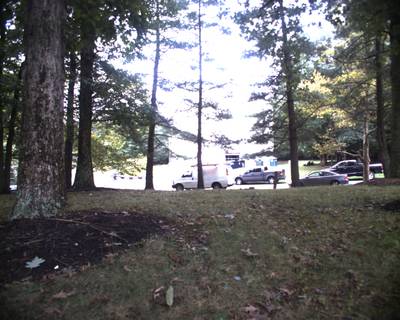
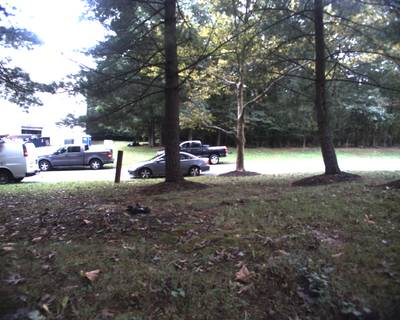
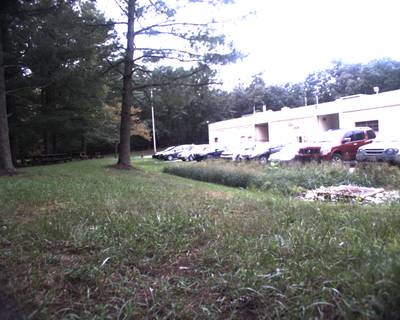
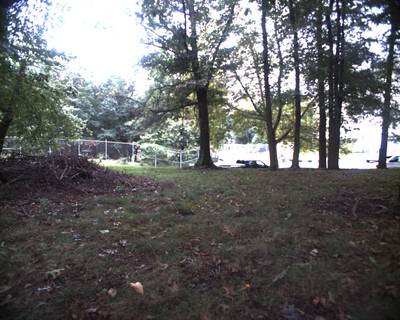
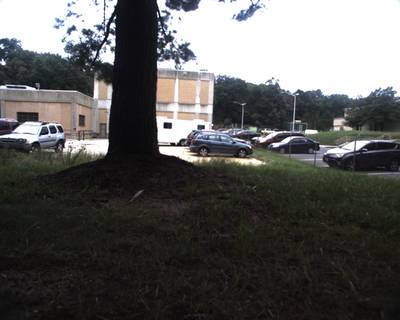
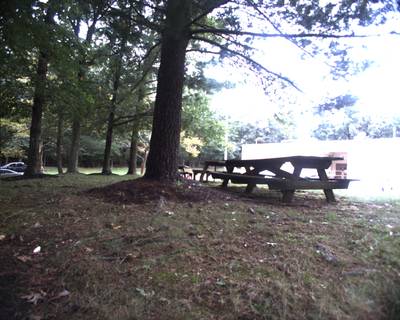
Example frames from robot exploration traversal videos from each of the four environment categories.
The robot’s onboard camera sensor records videos of each traversal at a frame rate of 15Hz, except for the village scenario, which is captured at a lower frequency of 1Hz, featuring a frame resolution of 1376x1110. These videos not only showcase various terrain types but also capture challenging conditions such as harsh shadows, blurred frames, changes in illumination, washed-out regions, orientation shifts resulting from sloped planes, and occluded perspectives due to traversal through areas with tall vegetation. The deliberate inclusion of these diverse scenes ensures that the dataset faithfully mirrors the realistic conditions encountered in these environments.
Dataset split
Videos from the RUGD dataset are partitioned into train/val/test splits for our benchmark experimental evaluation. ∼64% of the total annotated frames used for training, ∼10% for validation, and the remaining ∼26% for testing. While the selection of videos for each split was decided to roughly produce specific sizes of each split, two videos were specifically placed in the test split to test realistic challenges faced in many motivating applications. First, the creek sequence is the only example with significant rock bed terrain. Reserving this as a testing video demonstrates how existing architectures are able to learn from sparse label instances. This is a highly realistic scenario in unstructured environment applications as it is difficult to collect large amounts of training data for all possible terrain a priori. Second, the trail 7 sequence represents significantly more off-road jitter than others, producing many frames that appear to be quite blurry. This property is also present in training sequences, but again we reserve the difficult video to determine how well the techniques are able to perform under these harsh conditions.
| C | P1 | P2 | P8 | T | T3 | T4 | T5 | T6 | T7 | T9 | T10 | T11 | T12 | T13 | T14 | T15 | V | Total | % | |
|---|---|---|---|---|---|---|---|---|---|---|---|---|---|---|---|---|---|---|---|---|
| train | x | x | x | x | x | x | x | x | x | x | x | x | 4759 | 63.83 | ||||||
| val | x | x | 33 | 9.83 | ||||||||||||||||
| test | x | x | x | x | 1964 | 26.34 |
Training, validation and testing splits. VIDEO SEQUENCES (C: CREEK, P: PARK, T: TRAIL, V: VILLAGE) THAT FALL INTO EACH SPLIT ARE DENOTED WITH AN X. THE TOTAL NUMBER OF FRAMES AND PERCENTAGE OF EACH SPLIT WITHIN THE WHOLE DATASET ARE SEEN IN THE LAST TWO COLUMNS.
 Homepage
 Research Paper
Summary #
RUGD: Robot Unstructured Ground Driving Dataset is a dataset for a semantic segmentation task. It is used in the safety and robotics industries.
The dataset consists of 7436 images with 50032 labeled objects belonging to 24 different classes including tree, sky, grass, and other: mulch, gravel, bush, pole, log, building, vehicle, container, fence, asphalt, water, rock, sign, concrete, rock-bed, picnic-table, dirt, bridge, sand, person, and bicycle.
Images in the RUGD dataset have pixel-level semantic segmentation annotations. All images are labeled (i.e. with annotations). There are 3 splits in the dataset: train (4779 images), test (1924 images), and val (733 images). Alternatively, the dataset could be split into 4 general environment categories: trail (4843 images), park (1640 images), creek (836 images), and village (117 images). The dataset was released in 2019 by the US joint research group.
Here are the visualized examples for the classes:
Explore #
RUGD dataset has 7436 images. Click on one of the examples below or open "Explore" tool anytime you need to view dataset images with annotations. This tool has extended visualization capabilities like zoom, translation, objects table, custom filters and more. Hover the mouse over the images to hide or show annotations.


Class balance #
There are 24 annotation classes in the dataset. Find the general statistics and balances for every class in the table below. Click any row to preview images that have labels of the selected class. Sort by column to find the most rare or prevalent classes.

Class ㅤ | Images ㅤ | Objects ㅤ | Count on image average | Area on image average |
|---|---|---|---|---|
tree➔ mask | 7408 | 7408 | 1 | 38.89% |
sky➔ mask | 7035 | 7035 | 1 | 8.19% |
grass➔ mask | 6798 | 6798 | 1 | 24.78% |
mulch➔ mask | 4113 | 4113 | 1 | 19.07% |
gravel➔ mask | 3595 | 3595 | 1 | 14.31% |
bush➔ mask | 2958 | 2958 | 1 | 11.62% |
pole➔ mask | 2565 | 2565 | 1 | 0.3% |
log➔ mask | 2546 | 2546 | 1 | 1.81% |
building➔ mask | 2407 | 2407 | 1 | 4.42% |
vehicle➔ mask | 1969 | 1969 | 1 | 2.34% |
Co-occurrence matrix #
Co-occurrence matrix is an extremely valuable tool that shows you the images for every pair of classes: how many images have objects of both classes at the same time. If you click any cell, you will see those images. We added the tooltip with an explanation for every cell for your convenience, just hover the mouse over a cell to preview the description.
Images #
Explore every single image in the dataset with respect to the number of annotations of each class it has. Click a row to preview selected image. Sort by any column to find anomalies and edge cases. Use horizontal scroll if the table has many columns for a large number of classes in the dataset.
Object distribution #
Interactive heatmap chart for every class with object distribution shows how many images are in the dataset with a certain number of objects of a specific class. Users can click cell and see the list of all corresponding images.
Class sizes #
The table below gives various size properties of objects for every class. Click a row to see the image with annotations of the selected class. Sort columns to find classes with the smallest or largest objects or understand the size differences between classes.
Class | Object count | Avg area | Max area | Min area | Min height | Min height | Max height | Max height | Avg height | Avg height | Min width | Min width | Max width | Max width |
|---|---|---|---|---|---|---|---|---|---|---|---|---|---|---|
tree mask | 7408 | 38.89% | 91.15% | 0.02% | 6px | 1.09% | 550px | 100% | 313px | 56.86% | 14px | 2.03% | 688px | 100% |
sky mask | 7035 | 8.19% | 42.9% | 0% | 2px | 0.36% | 550px | 100% | 205px | 37.28% | 1px | 0.15% | 688px | 100% |
grass mask | 6798 | 24.78% | 73.78% | 0% | 1px | 0.18% | 550px | 100% | 236px | 42.91% | 1px | 0.15% | 688px | 100% |
mulch mask | 4113 | 19.07% | 89.61% | 0% | 1px | 0.18% | 550px | 100% | 184px | 33.47% | 1px | 0.15% | 688px | 100% |
gravel mask | 3595 | 14.31% | 52.86% | 0% | 1px | 0.18% | 543px | 98.73% | 175px | 31.88% | 1px | 0.15% | 688px | 100% |
bush mask | 2958 | 11.62% | 95.73% | 0% | 1px | 0.18% | 550px | 100% | 173px | 31.46% | 1px | 0.15% | 688px | 100% |
pole mask | 2565 | 0.3% | 12.15% | 0% | 1px | 0.18% | 493px | 89.64% | 130px | 23.58% | 1px | 0.15% | 688px | 100% |
log mask | 2546 | 1.81% | 19.1% | 0% | 1px | 0.18% | 503px | 91.45% | 96px | 17.43% | 1px | 0.15% | 688px | 100% |
building mask | 2407 | 4.42% | 55.5% | 0.01% | 5px | 0.91% | 550px | 100% | 101px | 18.31% | 4px | 0.58% | 688px | 100% |
vehicle mask | 1969 | 2.34% | 38.03% | 0% | 2px | 0.36% | 550px | 100% | 70px | 12.79% | 4px | 0.58% | 688px | 100% |
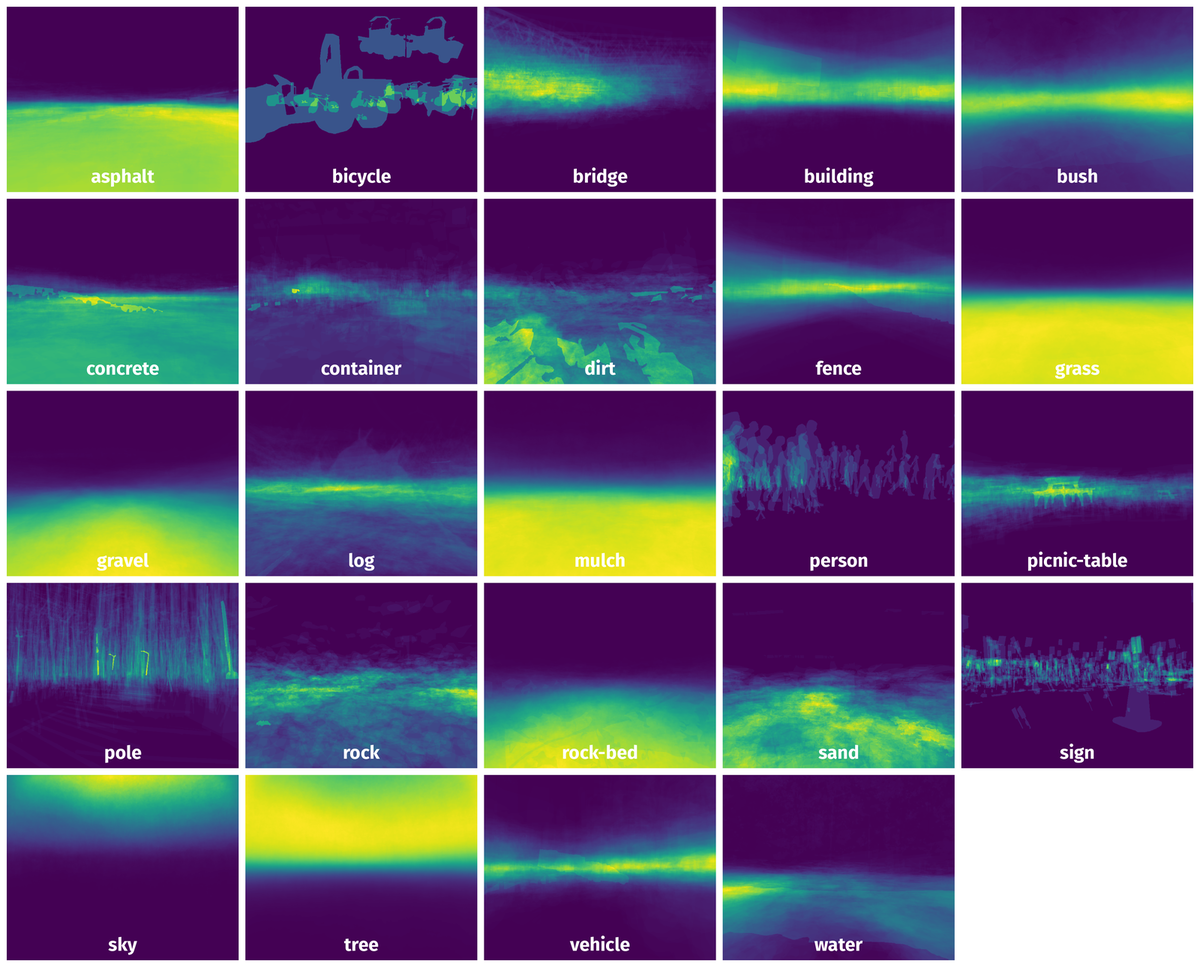
Spatial Heatmap #
The heatmaps below give the spatial distributions of all objects for every class. These visualizations provide insights into the most probable and rare object locations on the image. It helps analyze objects' placements in a dataset.
Objects #
Table contains all 50032 objects. Click a row to preview an image with annotations, and use search or pagination to navigate. Sort columns to find outliers in the dataset.
Object ID ㅤ | Class ㅤ | Image name click row to open | Image size height x width | Height ㅤ | Height ㅤ | Width ㅤ | Width ㅤ | Area ㅤ |
|---|---|---|---|---|---|---|---|---|
1➔ | sky mask | trail-11_02156.png | 550 x 688 | 280px | 50.91% | 688px | 100% | 6.84% |
2➔ | tree mask | trail-11_02156.png | 550 x 688 | 366px | 66.55% | 688px | 100% | 42.76% |
3➔ | mulch mask | trail-11_02156.png | 550 x 688 | 252px | 45.82% | 688px | 100% | 39.54% |
4➔ | bush mask | trail-11_02156.png | 550 x 688 | 197px | 35.82% | 615px | 89.39% | 10.86% |
5➔ | sky mask | trail-11_01626.png | 550 x 688 | 245px | 44.55% | 662px | 96.22% | 7.31% |
6➔ | grass mask | trail-11_01626.png | 550 x 688 | 291px | 52.91% | 688px | 100% | 23.51% |
7➔ | water mask | trail-11_01626.png | 550 x 688 | 185px | 33.64% | 366px | 53.2% | 6.68% |
8➔ | tree mask | trail-11_01626.png | 550 x 688 | 296px | 53.82% | 688px | 100% | 42.72% |
9➔ | dirt mask | trail-11_01626.png | 550 x 688 | 169px | 30.73% | 480px | 69.77% | 10.13% |
10➔ | person mask | trail-11_01626.png | 550 x 688 | 93px | 16.91% | 26px | 3.78% | 0.38% |
License #
The RUGD: Robot Unstructured Ground Driving Dataset is publicly available.
Citation #
If you make use of the RUGD data, please cite the following reference:
@inproceedings{RUGD2019IROS,
  author = {Wigness, Maggie and Eum, Sungmin and Rogers, John G and Han, David and Kwon, Heesung},
  title = {A RUGD Dataset for Autonomous Navigation and Visual Perception in Unstructured Outdoor Environments},
  booktitle = {International Conference on Intelligent Robots and Systems (IROS)},
  year = {2019}
}
If you are happy with Dataset Ninja and use provided visualizations and tools in your work, please cite us:
@misc{ visualization-tools-for-rugd-dataset,
  title = { Visualization Tools for RUGD Dataset },
  type = { Computer Vision Tools },
  author = { Dataset Ninja },
  howpublished = { \url{ https://datasetninja.com/rugd } },
  url = { https://datasetninja.com/rugd },
  journal = { Dataset Ninja },
  publisher = { Dataset Ninja },
  year = { 2026 },
  month = { jul },
  note = { visited on 2026-07-23 },
}
Download #
Dataset RUGD can be downloaded in Supervisely format:
As an alternative, it can be downloaded with dataset-tools package:
pip install --upgrade dataset-tools
… using following python code:
import dataset_tools as dtools

dtools.download(dataset='RUGD', dst_dir='~/dataset-ninja/')
Make sure not to overlook the python code example available on the Supervisely Developer Portal. It will give you a clear idea of how to effortlessly work with the downloaded dataset.
The data in original format can be downloaded here:
Disclaimer #
Our gal from the legal dep told us we need to post this:
Dataset Ninja provides visualizations and statistics for some datasets that can be found online and can be downloaded by general audience. Dataset Ninja is not a dataset hosting platform and can only be used for informational purposes. The platform does not claim any rights for the original content, including images, videos, annotations and descriptions. Joint publishing is prohibited.
You take full responsibility when you use datasets presented at Dataset Ninja, as well as other information, including visualizations and statistics we provide. You are in charge of compliance with any dataset license and all other permissions. You are required to navigate datasets homepage and make sure that you can use it. In case of any questions, get in touch with us at hello@datasetninja.com.