
Introduction #
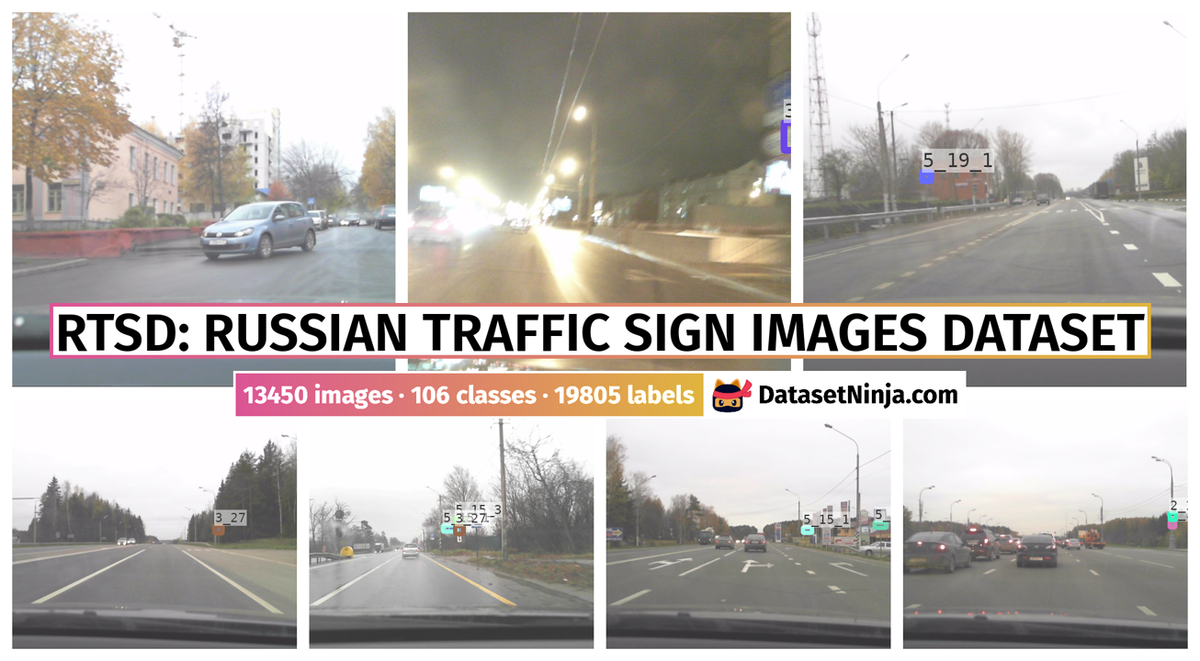
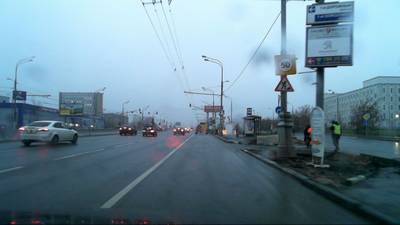
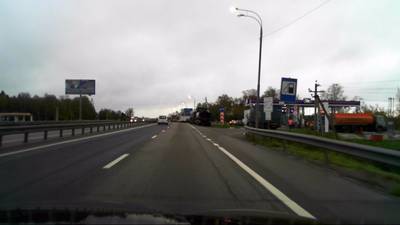
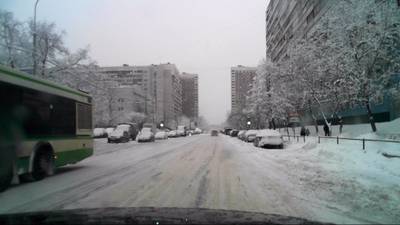
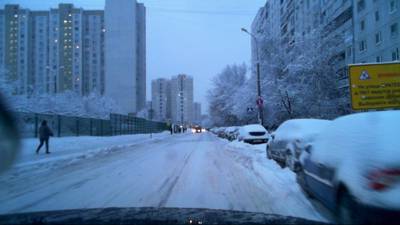
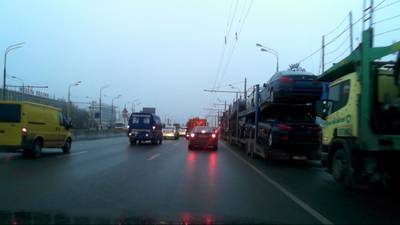
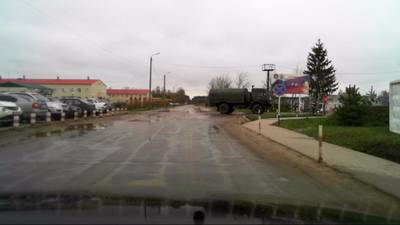
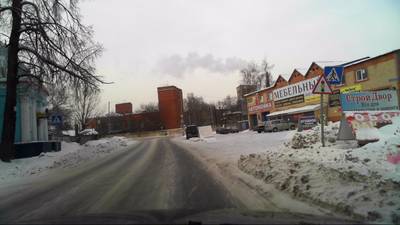
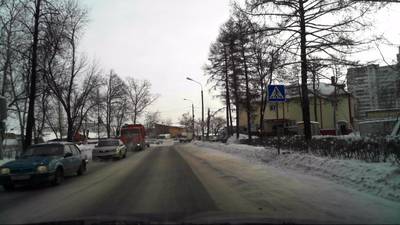
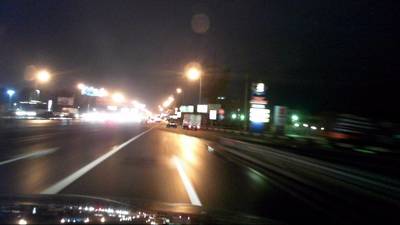
This RTSD: Russian Traffic Sign Images Dataset was created for training and testing the algorithms of traffic sign recognition. Frames are obtained from widescreen digital video recorder which captures 5 frames per second. Frame resolution is from 1280×720 to 1920×1080. Frames are captured in different seasons (spring, autumn, winter), time of day (morning, afternoon, evening) and in different weather conditions (rain, snow, bright sun).
Motivation
Recently, the development of control systems for self-driving cars has been progressing rapidly. A critical component of these systems is the algorithm for recognizing road signs. Beyond autonomous vehicles, sign recognition is also used in driver assistance systems and to automate road maintenance services. Modern methods of object recognition in images rely on deep learning models. To create a high-quality detection model, a well-labeled dataset is essential. However, the process of annotating datasets is both expensive and time-consuming, requiring meticulous manual work and verification to account for human errors.
Synthetic data offers a solution by simplifying data collection. It can be generated quickly, at no cost, without annotation errors, and in virtually unlimited quantities, significantly reducing the cost of obtaining data. The task of recognizing road signs inherently involves highly unbalanced classes. Many classes of signs are underrepresented in training samples, complicating the model training process. Previous research has demonstrated that using realistic synthetic datasets with augmentations of rare classes of road images can enhance traffic sign recognition models.
Dataset description
The authors explore the recognition of both common and rare road signs, emphasizing that the importance of rare signs is equal to that of common ones. Firstly, they enhance the current markup of the Russian traffic signs dataset in a semi-automatic mode, adding 9,000 new signs: 4,000 to the test set and 5,000 to the training set. Secondly, they conduct an experimental evaluation of modern methods for the classification and detection of road signs. Instead of using a combined classification method, the authors employ a single neural network trained on a mixture of real and synthetic data. To boost the performance of road sign detection and classification, they utilize stochastic weight averaging. This approach results in a significant improvement in recognition metrics for both rare and common signs.
This dataset is designed for training and testing traffic sign recognition algorithms. The frames are captured using a widescreen digital video recorder at a rate of 5 frames per second, with resolutions ranging from 1280×720 to 1920×1080. The frames are taken in various seasons (spring, autumn, winter), at different times of the day (morning, afternoon, evening), and under diverse weather conditions (rain, snow, bright sun). This dataset exceeds other public traffic sign datasets in terms of the number of frames, sign classes, physical signs, and images of signs. The sign labeling process is conducted in two stages. In the first stage, tracks of physical objects are identified in sequential frames. In the second stage, indistinguishable signs are discarded, and each physical sign is assigned a class.
The problem of recognizing road signs is unsolved for a large number of classes of signs, since there are many rare classes of signs. For systems that recognize road signs, the ability to quickly adapt in the event of a new type of road signs is important. With the emergence of a new class of signs, it is difficult to collect a sufficient number of real training examples. In the presence of synthetically generated images of this sign, the ability to classify a new type of sign can be quickly introduced into the system. High-quality synthetic samples allow us to solve the problem with missing classes and data collection with examples of these signs. The quality of the detectors can also be improved with synthetic signs. In this task, the consistency of the appearance of the sign with the background is especially important. The correct positioning of the new synthetic road sign is also very important.
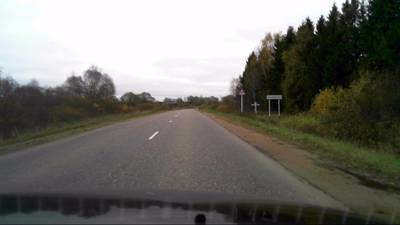
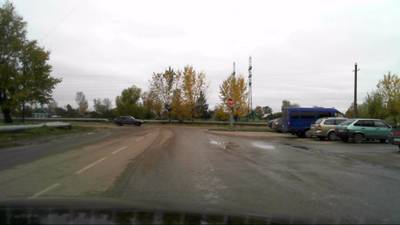
| Real image | Image with additional signs |
|---|---|
Note: Сlasses of the specified Russian road signs comply with GOST requirements.
 Homepage
 Research Paper
Summary #
RTSD: Russian Traffic Sign Images Dataset is a dataset for an object detection task. It is used in the automotive industry.
The dataset consists of 13450 images with 19805 labeled objects belonging to 106 different classes including 5_19_1, 2_1, 5_16, and other: 3_27, 4_1_1, 1_23, 3_20, 3_24_n40, 5_15_3, 5_15_2, 5_20, 5_15_1, 5_15_2_2, 5_15_5, 4_2_3, 7_3, 1_17, 3_1, 4_2_1, 2_3_2, 1_25, 6_4, 4_1_4, 1_22, 5_5, 6_6, 3_24_n20, 2_3_3, and 78 more.
Images in the RTSD: Russian Traffic Sign Images Dataset dataset have bounding box annotations. There are 2844 (21% of the total) unlabeled images (i.e. without annotations). There are 2 splits in the dataset: train (10367 images) and test (3083 images). Alternatively, the dataset could be split into 6 sign types: blue rect (8949 instances), prohibitory (2822 instances), danger (2466 instances), main road (2138 instances), mandatory (1721 instances), and blue border (1709 instances). The dataset was released in 2019 by the Lomonosov Moscow State University, Russia and NRU Higher School of Economics, Russia.
Explore #
RTSD: Russian Traffic Sign Images Dataset dataset has 13450 images. Click on one of the examples below or open "Explore" tool anytime you need to view dataset images with annotations. This tool has extended visualization capabilities like zoom, translation, objects table, custom filters and more. Hover the mouse over the images to hide or show annotations.


Class balance #
There are 106 annotation classes in the dataset. Find the general statistics and balances for every class in the table below. Click any row to preview images that have labels of the selected class. Sort by column to find the most rare or prevalent classes.

Class ㅤ | Images ㅤ | Objects ㅤ | Count on image average | Area on image average |
|---|---|---|---|---|
5_19_1➔ rectangle | 3035 | 5201 | 1.71 | 0.17% |
2_1➔ rectangle | 2004 | 2023 | 1.01 | 0.15% |
5_16➔ rectangle | 1168 | 1236 | 1.06 | 0.09% |
3_27➔ rectangle | 741 | 773 | 1.04 | 0.09% |
4_1_1➔ rectangle | 498 | 527 | 1.06 | 0.09% |
1_23➔ rectangle | 496 | 510 | 1.03 | 0.13% |
3_20➔ rectangle | 412 | 417 | 1.01 | 0.07% |
3_24_n40➔ rectangle | 388 | 410 | 1.06 | 0.11% |
5_15_3➔ rectangle | 365 | 373 | 1.02 | 0.1% |
5_15_2➔ rectangle | 355 | 1135 | 3.2 | 0.2% |
Images #
Explore every single image in the dataset with respect to the number of annotations of each class it has. Click a row to preview selected image. Sort by any column to find anomalies and edge cases. Use horizontal scroll if the table has many columns for a large number of classes in the dataset.
Object distribution #
Interactive heatmap chart for every class with object distribution shows how many images are in the dataset with a certain number of objects of a specific class. Users can click cell and see the list of all corresponding images.
Class sizes #
The table below gives various size properties of objects for every class. Click a row to see the image with annotations of the selected class. Sort columns to find classes with the smallest or largest objects or understand the size differences between classes.
Class | Object count | Avg area | Max area | Min area | Min height | Min height | Max height | Max height | Avg height | Avg height | Min width | Min width | Max width | Max width |
|---|---|---|---|---|---|---|---|---|---|---|---|---|---|---|
5_19_1 rectangle | 5201 | 0.1% | 2.5% | 0.01% | 17px | 1.57% | 219px | 21.94% | 32.11px | 3.88% | 17px | 0.89% | 221px | 11.51% |
2_1 rectangle | 2023 | 0.15% | 3.21% | 0.01% | 17px | 1.57% | 182px | 23.06% | 35.46px | 4.44% | 17px | 0.89% | 205px | 13.91% |
5_16 rectangle | 1236 | 0.08% | 0.82% | 0.02% | 18px | 1.85% | 124px | 17.22% | 32.81px | 4.26% | 17px | 0.89% | 88px | 6.17% |
5_15_2 rectangle | 1135 | 0.06% | 0.52% | 0.03% | 17px | 2.36% | 69px | 9.58% | 22.86px | 3.17% | 17px | 1.33% | 70px | 5.47% |
3_27 rectangle | 773 | 0.09% | 1.47% | 0.02% | 17px | 1.67% | 110px | 15.28% | 27.73px | 3.74% | 17px | 1.04% | 123px | 9.61% |
4_1_1 rectangle | 527 | 0.09% | 0.96% | 0.01% | 17px | 1.57% | 113px | 13.06% | 27.07px | 3.62% | 17px | 0.89% | 112px | 7.34% |
1_23 rectangle | 510 | 0.13% | 2.37% | 0.02% | 17px | 1.67% | 165px | 18.19% | 33.35px | 4.08% | 17px | 0.99% | 183px | 13.05% |
3_20 rectangle | 417 | 0.07% | 1.15% | 0.02% | 17px | 1.85% | 114px | 13.89% | 23.4px | 3.21% | 17px | 1.04% | 118px | 8.28% |
3_24_n40 rectangle | 410 | 0.11% | 1.55% | 0.01% | 17px | 1.57% | 129px | 16.81% | 30.91px | 3.75% | 17px | 0.89% | 140px | 9.77% |
5_15_3 rectangle | 373 | 0.1% | 1.63% | 0.02% | 17px | 1.85% | 107px | 14.86% | 27.17px | 3.74% | 17px | 0.94% | 146px | 11.41% |
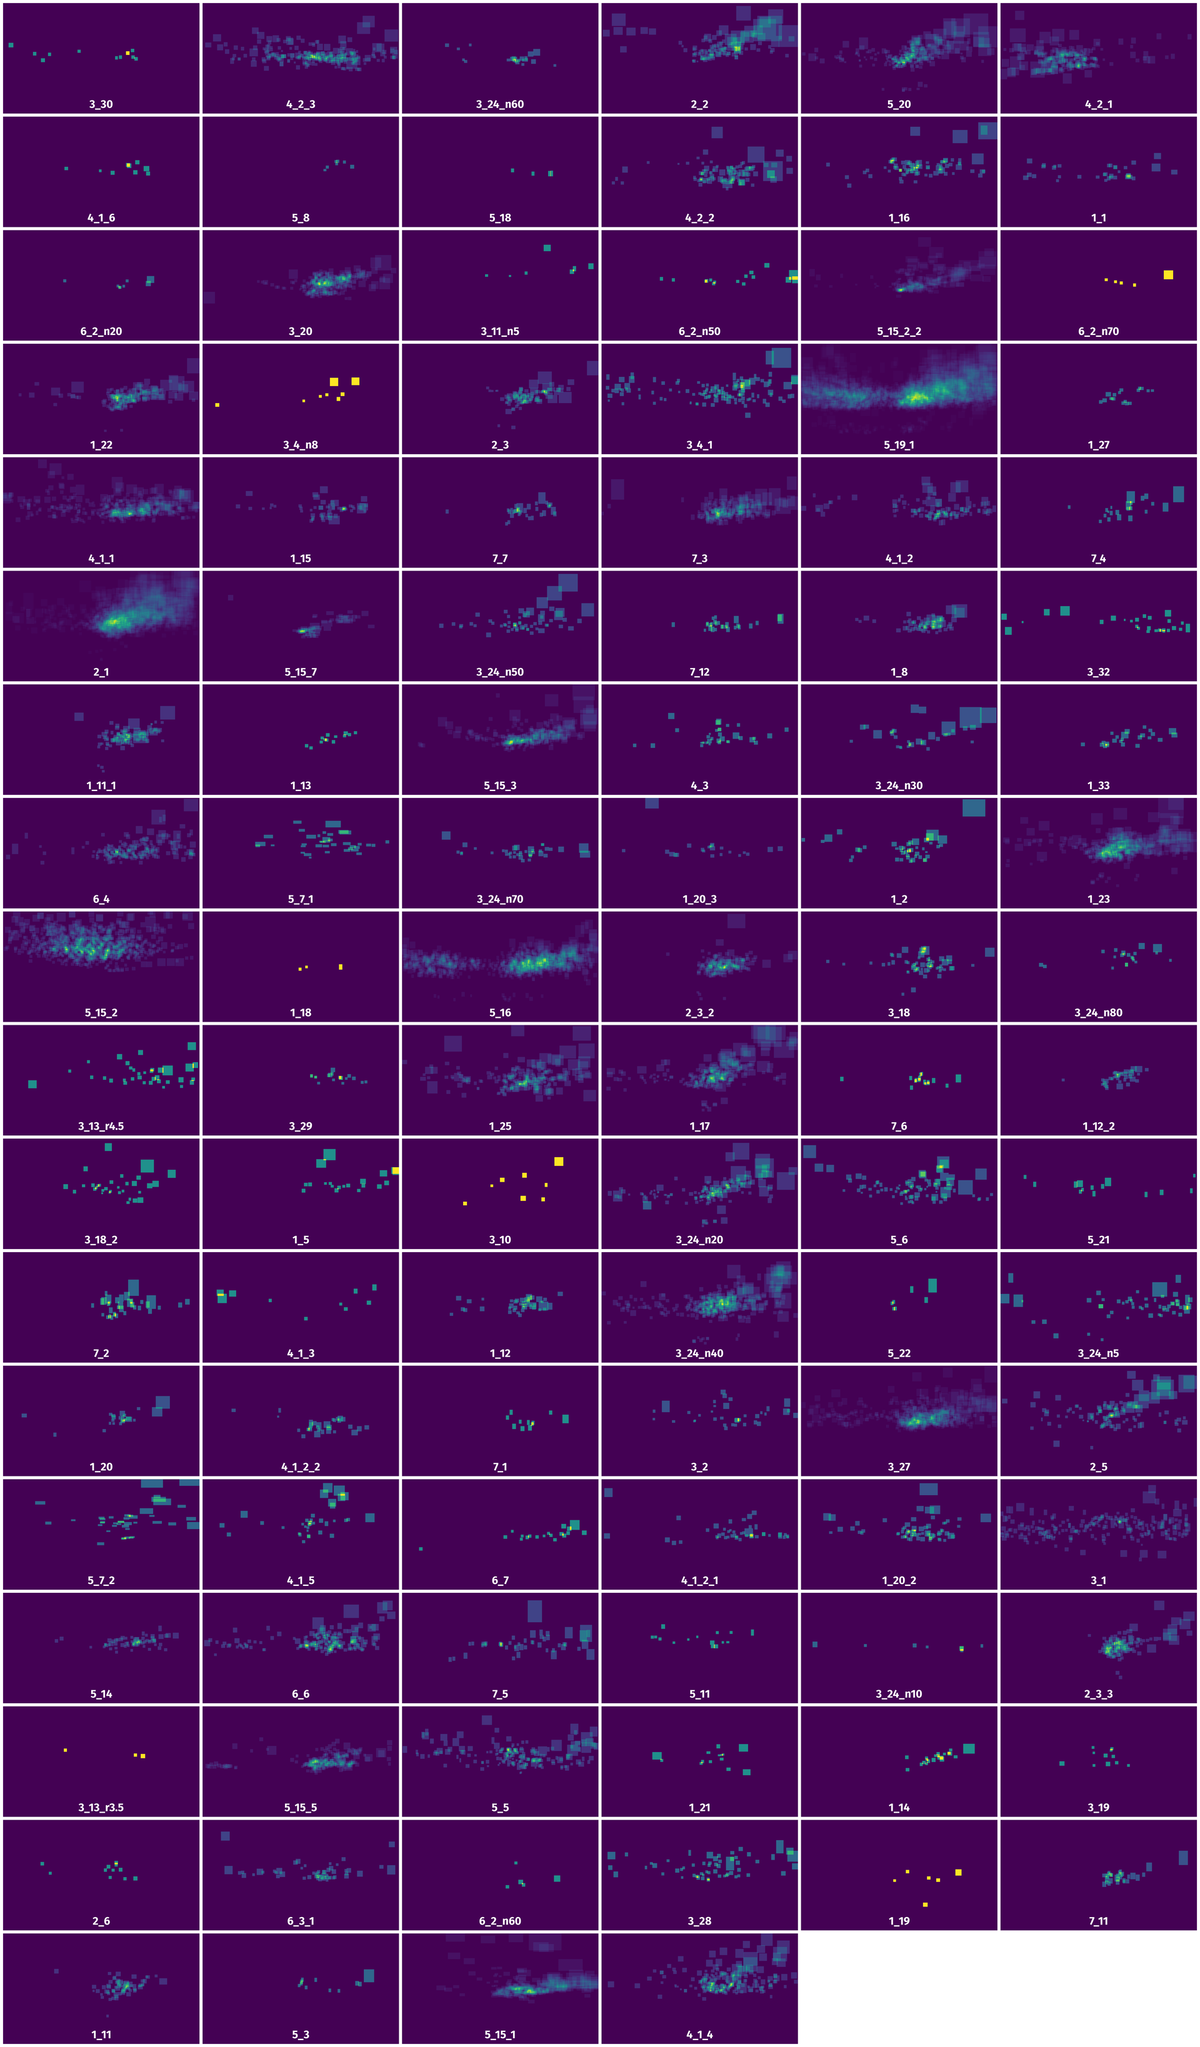
Spatial Heatmap #
The heatmaps below give the spatial distributions of all objects for every class. These visualizations provide insights into the most probable and rare object locations on the image. It helps analyze objects' placements in a dataset.
Objects #
Table contains all 19805 objects. Click a row to preview an image with annotations, and use search or pagination to navigate. Sort columns to find outliers in the dataset.
Object ID ㅤ | Class ㅤ | Image name click row to open | Image size height x width | Height ㅤ | Height ㅤ | Width ㅤ | Width ㅤ | Area ㅤ |
|---|---|---|---|---|---|---|---|---|
1➔ | 2_1 rectangle | autosave10_10_2012_12_52_21_0.jpg | 720 x 1280 | 32px | 4.44% | 31px | 2.42% | 0.11% |
2➔ | 1_2 rectangle | autosave09_10_2012_11_29_51_2.jpg | 720 x 1280 | 20px | 2.78% | 21px | 1.64% | 0.05% |
3➔ | 3_24_n40 rectangle | autosave09_10_2012_11_29_51_2.jpg | 720 x 1280 | 19px | 2.64% | 19px | 1.48% | 0.04% |
4➔ | 1_2 rectangle | autosave09_10_2012_11_29_51_2.jpg | 720 x 1280 | 24px | 3.33% | 24px | 1.88% | 0.06% |
5➔ | 3_1 rectangle | autosave01_02_2012_12_59_37.jpg | 720 x 1280 | 32px | 4.44% | 32px | 2.5% | 0.11% |
6➔ | 4_1_1 rectangle | autosave16_10_2012_11_12_38_0.jpg | 720 x 1280 | 31px | 4.31% | 30px | 2.34% | 0.1% |
7➔ | 4_1_1 rectangle | autosave16_10_2012_11_12_38_0.jpg | 720 x 1280 | 17px | 2.36% | 19px | 1.48% | 0.04% |
8➔ | 2_1 rectangle | autosave16_10_2012_11_12_38_0.jpg | 720 x 1280 | 42px | 5.83% | 41px | 3.2% | 0.19% |
9➔ | 2_5 rectangle | autosave01_02_2012_11_11_32.jpg | 720 x 1280 | 22px | 3.06% | 22px | 1.72% | 0.05% |
10➔ | 5_19_1 rectangle | autosave09_10_2012_12_50_32_2.jpg | 720 x 1280 | 36px | 5% | 17px | 1.33% | 0.07% |
License #
License is unknown for the RTSD: Russian Traffic Sign Images Dataset dataset.
Citation #
If you make use of the RTSD: Russian Traffic Sign Images Dataset data, please cite the following reference:
@dataset{RTSD: Russian Traffic Sign Images Dataset,
  author={Tingir Badmaev and Vlad Shakhuro and Anton Konushin},
  title={RTSD: Russian Traffic Sign Images Dataset},
  year={2019},
  url={https://graphics.cs.msu.ru/projects/traffic-sign-recognition.html}
}
If you are happy with Dataset Ninja and use provided visualizations and tools in your work, please cite us:
@misc{ visualization-tools-for-russian-traffic-sign-dataset,
  title = { Visualization Tools for RTSD: Russian Traffic Sign Images Dataset Dataset },
  type = { Computer Vision Tools },
  author = { Dataset Ninja },
  howpublished = { \url{ https://datasetninja.com/russian-traffic-sign } },
  url = { https://datasetninja.com/russian-traffic-sign },
  journal = { Dataset Ninja },
  publisher = { Dataset Ninja },
  year = { 2026 },
  month = { jul },
  note = { visited on 2026-07-22 },
}
Download #
Please visit dataset homepage to download the data.
Disclaimer #
Our gal from the legal dep told us we need to post this:
Dataset Ninja provides visualizations and statistics for some datasets that can be found online and can be downloaded by general audience. Dataset Ninja is not a dataset hosting platform and can only be used for informational purposes. The platform does not claim any rights for the original content, including images, videos, annotations and descriptions. Joint publishing is prohibited.
You take full responsibility when you use datasets presented at Dataset Ninja, as well as other information, including visualizations and statistics we provide. You are in charge of compliance with any dataset license and all other permissions. You are required to navigate datasets homepage and make sure that you can use it. In case of any questions, get in touch with us at hello@datasetninja.com.