

Introduction #
The STARE: Structured Analysis of the Retina Dataset concerns a system to automatically diagnose diseases of the human eye. It was conceived and initiated in 1975. During its history, over thirty people contributed to the project, with backgrounds ranging from medicine to science to engineering. Images and clinical data were provided by the Shiley Eye Center at the University of California, San Diego, and by the Veterans Administration Medical Center in San Diego.
Motivation
Blood vessel appearance is an important indicator for many diagnoses, including diabetes, hypertension, and arteriosclerosis. Vessels and arteries have many observable features, including diameter, color, tortuosity (relative curvature), and opacity (reflectivity). Artery-vein crossings and patterns of small vessels can also serve as diagnostic indicators. An accurate delineation of the boundaries of blood vessels makes precise measurements of these features possible. These measurements may then be applied to a variety of tasks, including diagnosis, treatment evaluation, and clinical study.
Dataset description
The authors present an automated approach for identifying and delineating blood vessels within ocular fundus images. This tool offers the potential to facilitate broader screenings for vessel abnormalities among populations by eyecare specialists. Additionally, it enables more precise measurements, which are crucial for treatment evaluation and clinical research. Moreover, utilizing such a tool ensures a more systematic and reproducible approach to observations. Unlike previous methods that focused mainly on local attributes, this method considers various characteristics of vessels such as color, shape, gradient, and contrast with the background.
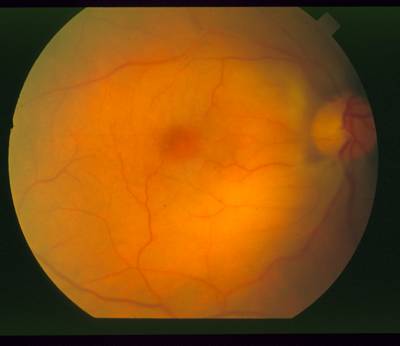
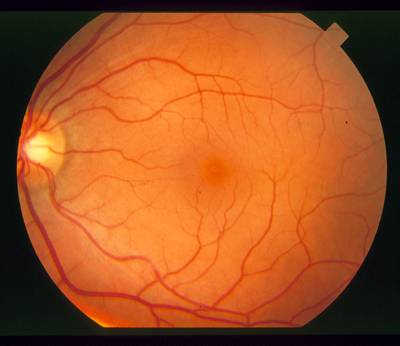
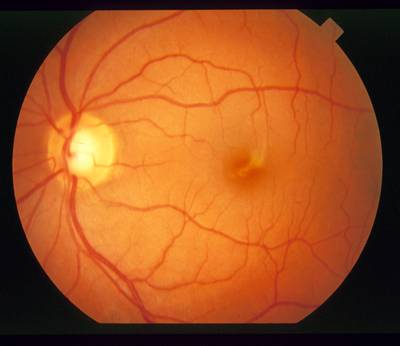
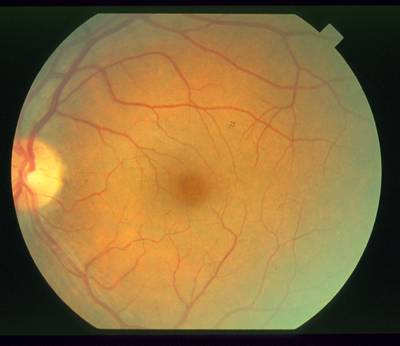
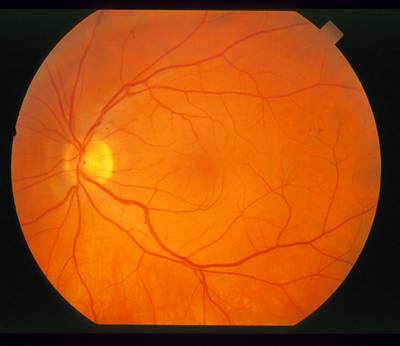
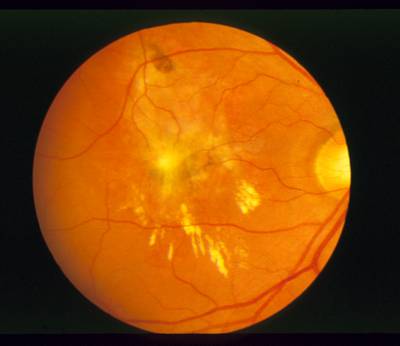
In a healthy retina, the optic nerve has a readily identifiable size, shape, color, and location relative to the blood vessels.
The optic nerve appears toward the of this image as a circular area, roughly one-sixth the width of the image in diameter, brighter than the surrounding area, as the convergent area of the blood vessel network. In an image of a healthy retina, all these properties (shape, color, size, convergence) help contribute to the identification of the nerve. However, these features show a large variance that makes simple detection methods brittle, particularly in the presence of retinal disease.
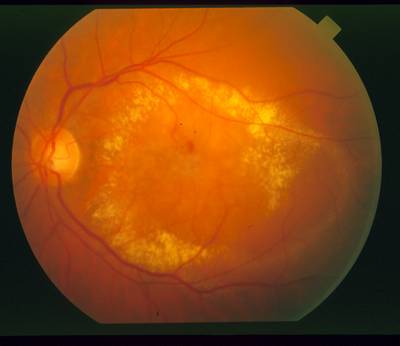
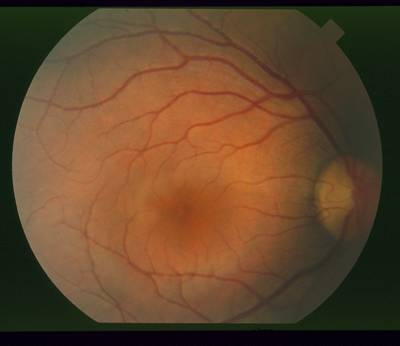
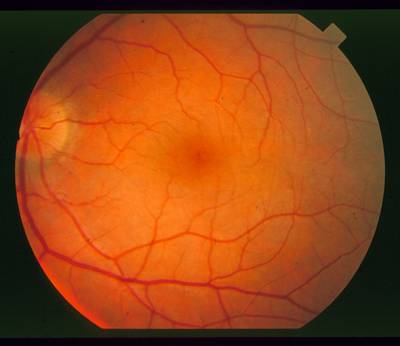
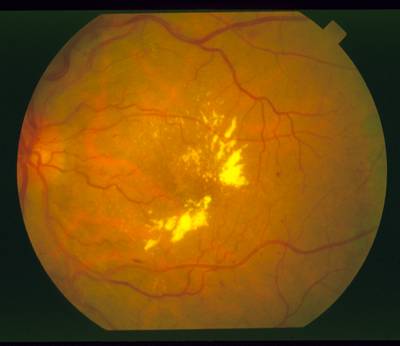
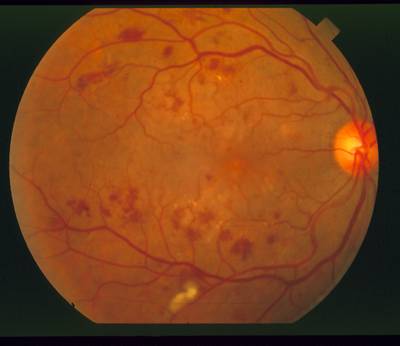
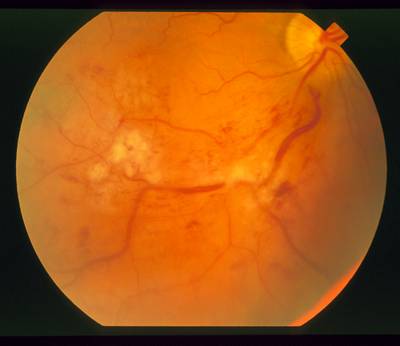
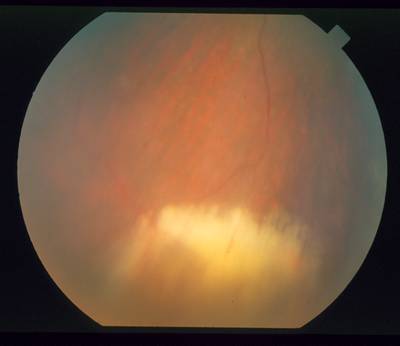
Retina containing lesions of the same brightness as the nerve.
This image of the retina containing drusen. The brightness of these lesions overlaps the brightness of the nerve, so that using brightness as a lone feature for detection is difficult.
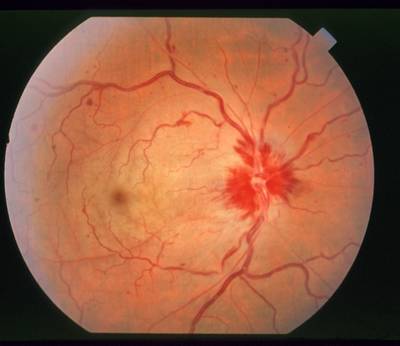
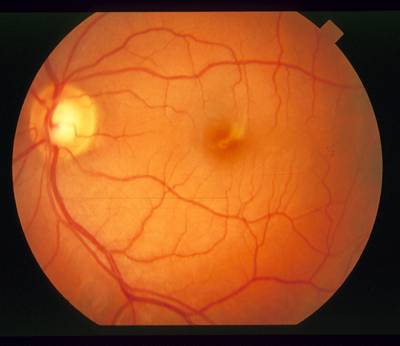
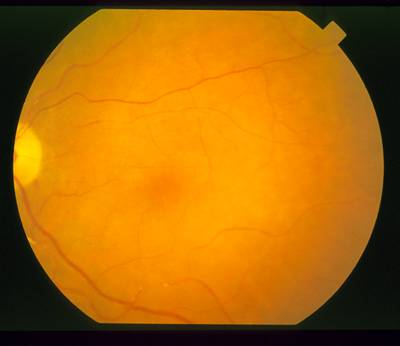
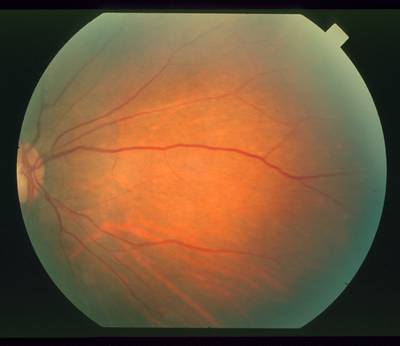
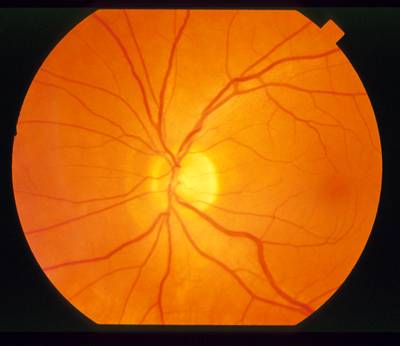
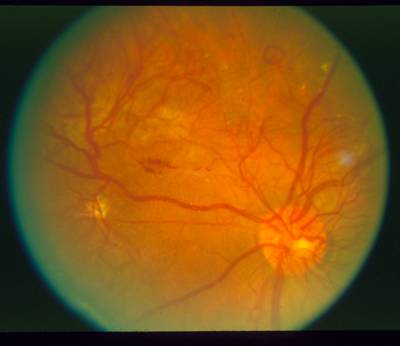
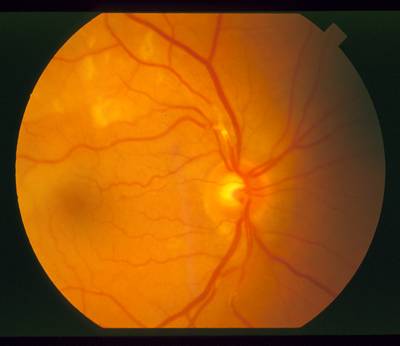
Swollen nerve, showing a distorted size and shape.
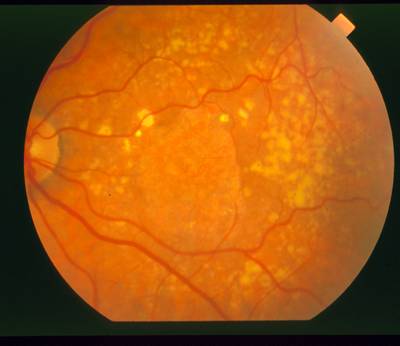
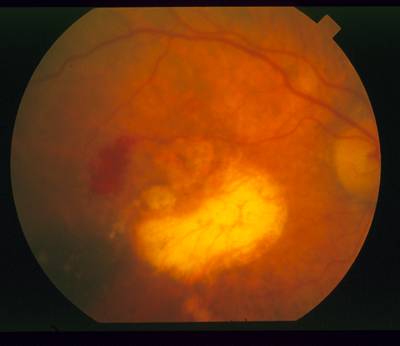
Bright circular lesion that looks similar to an optic nerve.
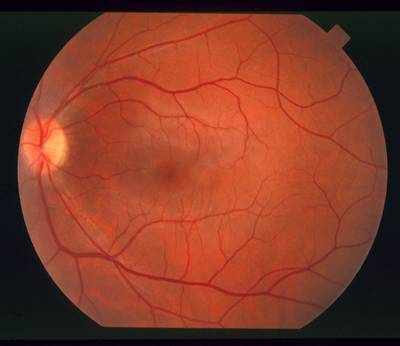
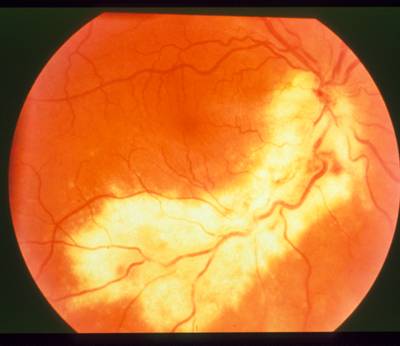
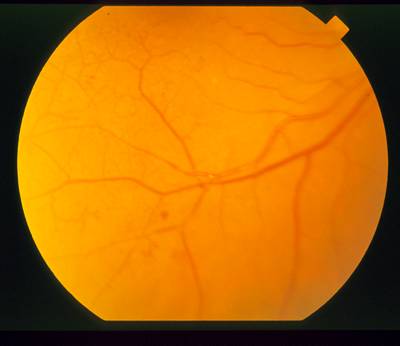
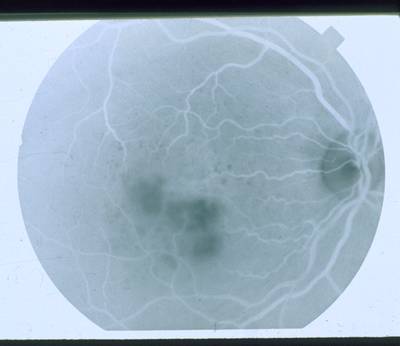
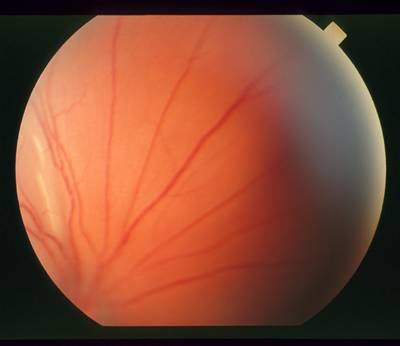
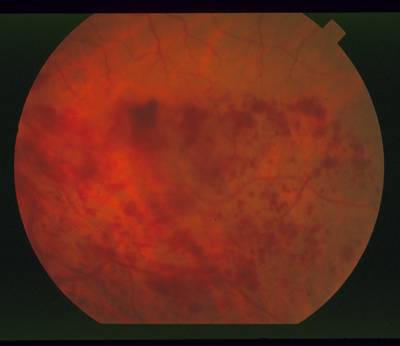
Nerve that is completely obscured by hemorrhaging.
These cases underscore the challenge in detecting the optic nerve and emphasize the necessity for a robust method capable of functioning effectively in the presence of various retinal diseases. Since the optic nerve’s most consistent feature is its role as the convergence point of the blood vessel network, the authors have developed a method for optic nerve detection based on identifying this convergence. When a unique and strongly identifiable convergence isn’t present, brightness serves as a secondary feature for optic nerve detection.
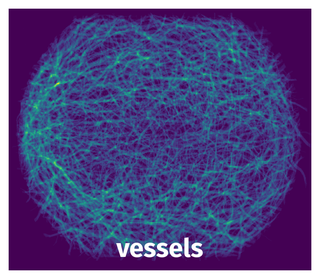
The authors employ multiple vessel segmentations of the same image to enhance the detection of convergent points. The concept is that the convergence should be discernible across vessel segmentations at different scales. To locate the convergence of the vessel network, they introduce a novel algorithm named “fuzzy convergence.” This algorithm operates as a voting-type method within the spatial domain of the image. The input consists of a binary segmentation of the blood vessels, with each vessel being represented by a fuzzy segment contributing to a cumulative voting image. The algorithm outputs a convergence image, which is then thresholded to identify the most prominent point(s) of convergence.
Binary segmentation of blood vessels. (a) Sparser scale. (b) Denser scale.
The authors rely primarily on a pioneering algorithm dubbed “fuzzy convergence” for optic nerve detection. This innovative approach pinpoints the optic nerve as the central hub of the blood vessel network. When a distinct convergence point is lacking, the authors’ method identifies the optic nerve as the brightest area in the image following illumination equalization.
 Homepage
 Research Paper 1Research Paper 2
 Academic Torrents
Summary #
STARE: Structured Analysis of the Retina Dataset is a dataset for a semantic segmentation task. It is used in the medical research.
The dataset consists of 397 images with 60 labeled objects belonging to 1 single class (vessels).
Images in the STARE dataset have pixel-level semantic segmentation annotations. There are 377 (95% of the total) unlabeled images (i.e. without annotations). There are no pre-defined train/val/test splits in the dataset. Alternatively, the dataset could be split into 3 labelers: adam hoover (20 objects), filter probing algorithm (20 objects), and valentina kouznetsova (20 objects). Additionally, every image contains information about patient diagnos. Explore it in supervisely labeling tool. The dataset was released in 2000 by the University of California, USA.
Explore #
STARE dataset has 397 images. Click on one of the examples below or open "Explore" tool anytime you need to view dataset images with annotations. This tool has extended visualization capabilities like zoom, translation, objects table, custom filters and more. Hover the mouse over the images to hide or show annotations.


Class balance #
There are 1 annotation classes in the dataset. Find the general statistics and balances for every class in the table below. Click any row to preview images that have labels of the selected class. Sort by column to find the most rare or prevalent classes.

Class ㅤ | Images ㅤ | Objects ㅤ | Count on image average | Area on image average |
|---|---|---|---|---|
vessels➔ mask | 20 | 60 | 3 | 13.54% |
Images #
Explore every single image in the dataset with respect to the number of annotations of each class it has. Click a row to preview selected image. Sort by any column to find anomalies and edge cases. Use horizontal scroll if the table has many columns for a large number of classes in the dataset.
Object distribution #
Interactive heatmap chart for every class with object distribution shows how many images are in the dataset with a certain number of objects of a specific class. Users can click cell and see the list of all corresponding images.
Class sizes #
The table below gives various size properties of objects for every class. Click a row to see the image with annotations of the selected class. Sort columns to find classes with the smallest or largest objects or understand the size differences between classes.
Class | Object count | Avg area | Max area | Min area | Min height | Min height | Max height | Max height | Avg height | Avg height | Min width | Min width | Max width | Max width |
|---|---|---|---|---|---|---|---|---|---|---|---|---|---|---|
vessels mask | 60 | 8.81% | 15.28% | 4.31% | 505px | 83.47% | 559px | 92.4% | 545px | 90.12% | 604px | 86.29% | 684px | 97.71% |
Spatial Heatmap #
The heatmaps below give the spatial distributions of all objects for every class. These visualizations provide insights into the most probable and rare object locations on the image. It helps analyze objects' placements in a dataset.
Objects #
Table contains all 60 objects. Click a row to preview an image with annotations, and use search or pagination to navigate. Sort columns to find outliers in the dataset.
Object ID ㅤ | Class ㅤ | Image name click row to open | Image size height x width | Height ㅤ | Height ㅤ | Width ㅤ | Width ㅤ | Area ㅤ |
|---|---|---|---|---|---|---|---|---|
1➔ | vessels mask | im0077.png | 605 x 700 | 551px | 91.07% | 646px | 92.29% | 8.01% |
2➔ | vessels mask | im0077.png | 605 x 700 | 552px | 91.24% | 647px | 92.43% | 12.99% |
3➔ | vessels mask | im0077.png | 605 x 700 | 535px | 88.43% | 636px | 90.86% | 8.07% |
4➔ | vessels mask | im0044.png | 605 x 700 | 557px | 92.07% | 665px | 95% | 6.96% |
5➔ | vessels mask | im0044.png | 605 x 700 | 559px | 92.4% | 684px | 97.71% | 11.42% |
6➔ | vessels mask | im0044.png | 605 x 700 | 539px | 89.09% | 670px | 95.71% | 8.18% |
7➔ | vessels mask | im0004.png | 605 x 700 | 545px | 90.08% | 615px | 87.86% | 7.41% |
8➔ | vessels mask | im0004.png | 605 x 700 | 544px | 89.92% | 633px | 90.43% | 7.23% |
9➔ | vessels mask | im0004.png | 605 x 700 | 528px | 87.27% | 619px | 88.43% | 8.67% |
10➔ | vessels mask | im0005.png | 605 x 700 | 555px | 91.74% | 633px | 90.43% | 9.03% |
License #
The STARE: Structured Analysis of the Retina Dataset is publicly available.
Citation #
If you make use of the STARE data, please cite the following reference:
@dataset{STARE,
  author={A. Hoover and V. Kouznetsova and M. Goldbaum},
  title={STARE: Structured Analysis of the Retina Dataset},
  year={2000},
  url={https://cecas.clemson.edu/~ahoover/stare/}
}
If you are happy with Dataset Ninja and use provided visualizations and tools in your work, please cite us:
@misc{ visualization-tools-for-stare-dataset,
  title = { Visualization Tools for STARE Dataset },
  type = { Computer Vision Tools },
  author = { Dataset Ninja },
  howpublished = { \url{ https://datasetninja.com/stare } },
  url = { https://datasetninja.com/stare },
  journal = { Dataset Ninja },
  publisher = { Dataset Ninja },
  year = { 2026 },
  month = { jul },
  note = { visited on 2026-07-20 },
}
Download #
Dataset STARE can be downloaded in Supervisely format:
As an alternative, it can be downloaded with dataset-tools package:
pip install --upgrade dataset-tools
… using following python code:
import dataset_tools as dtools

dtools.download(dataset='STARE', dst_dir='~/dataset-ninja/')
Make sure not to overlook the python code example available on the Supervisely Developer Portal. It will give you a clear idea of how to effortlessly work with the downloaded dataset.
The data in original format can be downloaded here:
Disclaimer #
Our gal from the legal dep told us we need to post this:
Dataset Ninja provides visualizations and statistics for some datasets that can be found online and can be downloaded by general audience. Dataset Ninja is not a dataset hosting platform and can only be used for informational purposes. The platform does not claim any rights for the original content, including images, videos, annotations and descriptions. Joint publishing is prohibited.
You take full responsibility when you use datasets presented at Dataset Ninja, as well as other information, including visualizations and statistics we provide. You are in charge of compliance with any dataset license and all other permissions. You are required to navigate datasets homepage and make sure that you can use it. In case of any questions, get in touch with us at hello@datasetninja.com.