Introduction #
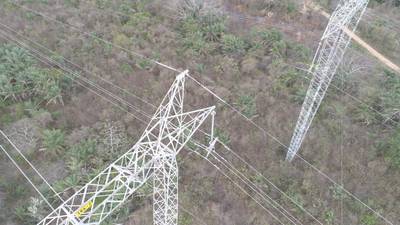
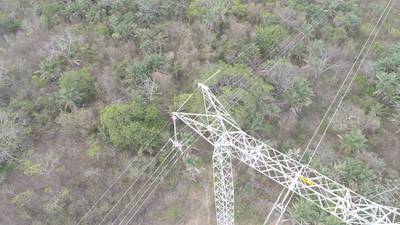
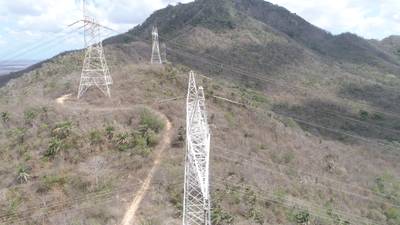
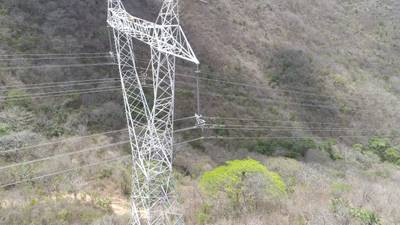
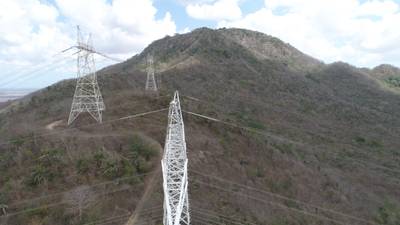
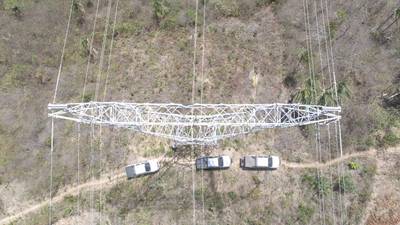
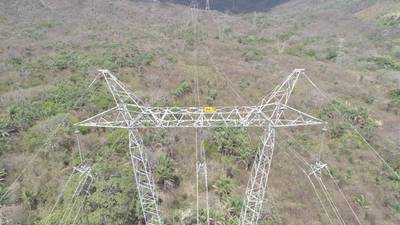
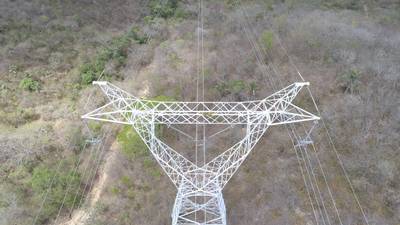
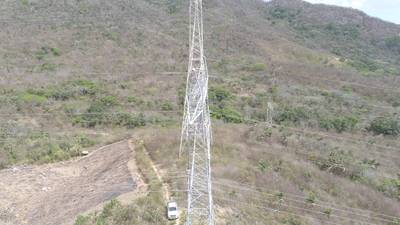
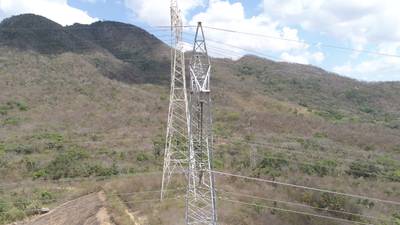
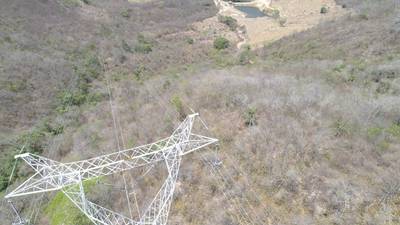
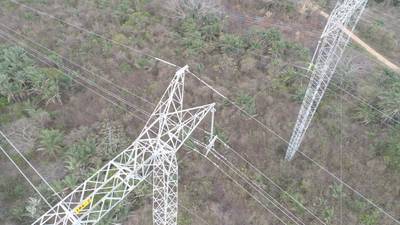
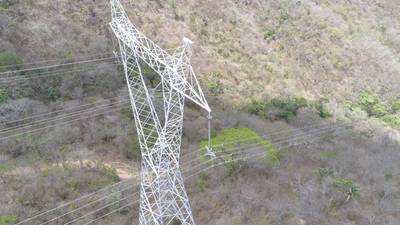
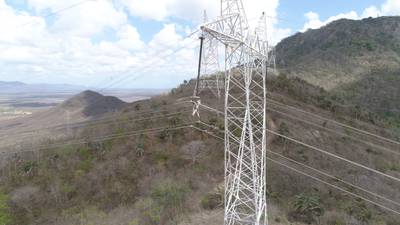
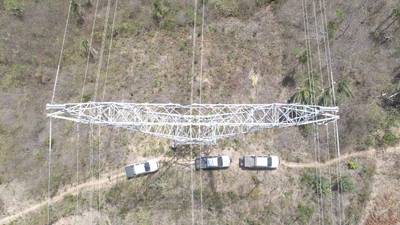
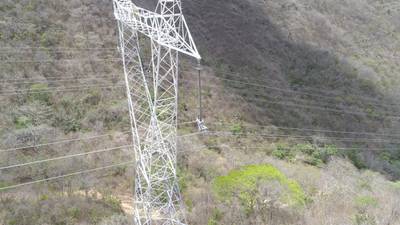
The authors developed the STN PLAD: A Dataset for Multi-Size Power Line Assets Detection in High-Resolution UAV Images to address the need for a reliable dataset for power line inspection using UAVs. The dataset contains high-resolution and real-world images of multiple high-voltage power line components, with 2,409 annotated objects classified into five classes: transmission tower, insulator, spacer, tower plate, and Stockbridge damper. These objects vary in size, orientation, illumination, angulation, and background.
Power line companies are increasingly using UAVs for inspection processes to avoid endangering workers who would otherwise have to climb high-voltage power line towers. Detecting and classifying assets in power transmission lines is a crucial task for inspection purposes, but the scarcity of public data related to power line assets has hindered progress in this area. This dataset aims to facilitate research and advancements in this field.
Power grid blackouts can have severe consequences, affecting critical services such as hospitals, water supplies, and telecommunication. To prevent such situations, regular maintenance of power line equipment is essential. Traditionally, this involved manual inspection by teams, with workers climbing transmission towers to check their condition. However, this process is time-consuming, risky, and costly.
To improve the efficiency and safety of power line inspection, computer vision technologies, particularly deep learning networks, can be applied. Automating the detection of power line assets using UAVs reduces safety risks and allows for more direct analysis of detected components. This dataset plays a crucial role in training deep learning networks, ensuring accuracy in the detection and classification of power line components.
The images in the dataset were captured using a DJI Phantom 4 Pro 1 drone, following a set of policies for data collection to ensure variability and consistency. Certified drone pilots captured the images, maintaining a similar distance to the transmission tower in wide shots to ensure high-resolution quality. The equipped camera is a DJI FC6310 and it can take pictures with a resolution of 5472×3078 (3:2) or 5472×3648 (16:9). Viewing angles, daytime, weather, angulation, and illumination conditions were varied to enhance the learning process for neural network models. Multiple transmission towers were photographed to capture variations in background and power line components.
The dataset contains 133 captured images with 2,409 annotated objects. Each object was carefully surrounded with a bounding box by two annotators to maintain consistency and accuracy. The dataset may seem small in terms of the total number of images, but it contains a reasonable amount of data considering the high-resolution nature of the images and the substantial number of object instances present in each image.
Summary #
STN PLAD: A Dataset for Multi-Size Power Line Assets Detection in High-Resolution UAV Images is a dataset for an object detection task. It is used in the energy industry, and in the drone inspection domain.
The dataset consists of 133 images with 2409 labeled objects belonging to 5 different classes including tower, damper, insulator, and other: spacer and plate.
Images in the STN PLAD dataset have bounding box annotations. All images are labeled (i.e. with annotations). There are no pre-defined train/val/test splits in the dataset. The dataset was released in 2021 by the Sistema de Transmissão do Nordeste S.A., Brazil.

Explore #
STN PLAD dataset has 133 images. Click on one of the examples below or open "Explore" tool anytime you need to view dataset images with annotations. This tool has extended visualization capabilities like zoom, translation, objects table, custom filters and more. Hover the mouse over the images to hide or show annotations.


























Class balance #
There are 5 annotation classes in the dataset. Find the general statistics and balances for every class in the table below. Click any row to preview images that have labels of the selected class. Sort by column to find the most rare or prevalent classes.
Class ㅤ | Images ㅤ | Objects ㅤ | Count on image average | Area on image average |
|---|---|---|---|---|
tower➔ rectangle | 131 | 253 | 1.93 | 28.47% |
damper➔ rectangle | 114 | 1505 | 13.2 | 0.22% |
insulator➔ rectangle | 113 | 312 | 2.76 | 1.4% |
spacer➔ rectangle | 110 | 253 | 2.3 | 0.37% |
plate➔ rectangle | 86 | 86 | 1 | 0.06% |
Co-occurrence matrix #
Co-occurrence matrix is an extremely valuable tool that shows you the images for every pair of classes: how many images have objects of both classes at the same time. If you click any cell, you will see those images. We added the tooltip with an explanation for every cell for your convenience, just hover the mouse over a cell to preview the description.
Images #
Explore every single image in the dataset with respect to the number of annotations of each class it has. Click a row to preview selected image. Sort by any column to find anomalies and edge cases. Use horizontal scroll if the table has many columns for a large number of classes in the dataset.
Object distribution #
Interactive heatmap chart for every class with object distribution shows how many images are in the dataset with a certain number of objects of a specific class. Users can click cell and see the list of all corresponding images.
Class sizes #
The table below gives various size properties of objects for every class. Click a row to see the image with annotations of the selected class. Sort columns to find classes with the smallest or largest objects or understand the size differences between classes.
Class | Object count | Avg area | Max area | Min area | Min height | Min height | Max height | Max height | Avg height | Avg height | Min width | Min width | Max width | Max width |
|---|---|---|---|---|---|---|---|---|---|---|---|---|---|---|
damper rectangle | 1505 | 0.02% | 0.72% | 0% | 10px | 0.3% | 431px | 14% | 48px | 1.49% | 12px | 0.22% | 457px | 8.35% |
insulator rectangle | 312 | 0.51% | 4.66% | 0.07% | 148px | 4.19% | 1505px | 41.26% | 434px | 13.51% | 37px | 0.68% | 2782px | 50.84% |
tower rectangle | 253 | 14.91% | 95.57% | 0.02% | 82px | 2.25% | 3646px | 99.97% | 1656px | 52.1% | 47px | 0.86% | 5244px | 95.83% |
spacer rectangle | 253 | 0.16% | 1.05% | 0% | 19px | 0.62% | 583px | 15.98% | 166px | 5.18% | 17px | 0.31% | 401px | 7.33% |
plate rectangle | 86 | 0.06% | 0.34% | 0.01% | 22px | 0.71% | 229px | 7.44% | 70px | 2.2% | 21px | 0.38% | 293px | 5.35% |
Spatial Heatmap #
The heatmaps below give the spatial distributions of all objects for every class. These visualizations provide insights into the most probable and rare object locations on the image. It helps analyze objects' placements in a dataset.

Objects #
Table contains all 2409 objects. Click a row to preview an image with annotations, and use search or pagination to navigate. Sort columns to find outliers in the dataset.
Object ID ㅤ | Class ㅤ | Image name click row to open | Image size height x width | Height ㅤ | Height ㅤ | Width ㅤ | Width ㅤ | Area ㅤ |
|---|---|---|---|---|---|---|---|---|
1➔ | plate rectangle | DJI_0464.JPG | 3078 x 5472 | 58px | 1.88% | 124px | 2.27% | 0.04% |
2➔ | tower rectangle | DJI_0464.JPG | 3078 x 5472 | 2245px | 72.94% | 2658px | 48.57% | 35.43% |
3➔ | tower rectangle | DJI_0464.JPG | 3078 x 5472 | 2121px | 68.91% | 1106px | 20.21% | 13.93% |
4➔ | insulator rectangle | DJI_0464.JPG | 3078 x 5472 | 369px | 11.99% | 55px | 1.01% | 0.12% |
5➔ | spacer rectangle | DJI_0464.JPG | 3078 x 5472 | 147px | 4.78% | 162px | 2.96% | 0.14% |
6➔ | damper rectangle | DJI_0464.JPG | 3078 x 5472 | 31px | 1.01% | 29px | 0.53% | 0.01% |
7➔ | damper rectangle | DJI_0464.JPG | 3078 x 5472 | 50px | 1.62% | 34px | 0.62% | 0.01% |
8➔ | damper rectangle | DJI_0464.JPG | 3078 x 5472 | 47px | 1.53% | 32px | 0.58% | 0.01% |
9➔ | damper rectangle | DJI_0464.JPG | 3078 x 5472 | 42px | 1.36% | 30px | 0.55% | 0.01% |
10➔ | damper rectangle | DJI_0464.JPG | 3078 x 5472 | 26px | 0.84% | 24px | 0.44% | 0% |
License #
STN PLAD: A Dataset for Multi-Size Power Line Assets Detection in High-Resolution UAV Images is under GNU GPL 3.0 license.
Citation #
If you make use of the STN PLAD data, please cite the following reference:
@INPROCEEDINGS{vieiraesilva2021stn,
    author={{Vieira-e-Silva}, André Luiz Buarque and de Castro Felix, Heitor and de Menezes Chaves, Thiago and Simões, Francisco Paulo Magalhães and Teichrieb, Veronica and dos Santos, Michel Mozinho and da Cunha Santiago, Hemir and Sgotti, Virginia Adélia Cordeiro and Neto, Henrique Baptista Duffles Teixeira Lott},
    booktitle={2021 34th SIBGRAPI Conference on Graphics, Patterns and Images (SIBGRAPI)},
    title={STN PLAD: A Dataset for Multi-Size Power Line Assets Detection in High-Resolution UAV Images},
    year={2021},
    pages={215-222},
    doi={10.1109/SIBGRAPI54419.2021.00037}
}
If you are happy with Dataset Ninja and use provided visualizations and tools in your work, please cite us:
@misc{ visualization-tools-for-stn-plad-dataset,
  title = { Visualization Tools for STN PLAD Dataset },
  type = { Computer Vision Tools },
  author = { Dataset Ninja },
  howpublished = { \url{ https://datasetninja.com/stn-plad } },
  url = { https://datasetninja.com/stn-plad },
  journal = { Dataset Ninja },
  publisher = { Dataset Ninja },
  year = { 2026 },
  month = { feb },
  note = { visited on 2026-02-15 },
}
Download #
Dataset STN PLAD can be downloaded in Supervisely format:
As an alternative, it can be downloaded with dataset-tools package:
pip install --upgrade dataset-tools
… using following python code:
import dataset_tools as dtools

dtools.download(dataset='STN PLAD', dst_dir='~/dataset-ninja/')
Make sure not to overlook the python code example available on the Supervisely Developer Portal. It will give you a clear idea of how to effortlessly work with the downloaded dataset.
The data in original format can be downloaded here:
Disclaimer #
Our gal from the legal dep told us we need to post this:
Dataset Ninja provides visualizations and statistics for some datasets that can be found online and can be downloaded by general audience. Dataset Ninja is not a dataset hosting platform and can only be used for informational purposes. The platform does not claim any rights for the original content, including images, videos, annotations and descriptions. Joint publishing is prohibited.
You take full responsibility when you use datasets presented at Dataset Ninja, as well as other information, including visualizations and statistics we provide. You are in charge of compliance with any dataset license and all other permissions. You are required to navigate datasets homepage and make sure that you can use it. In case of any questions, get in touch with us at hello@datasetninja.com.


