Introduction #
As the authors of Strawberry Dataset for Object Detection discuss, addressing labor shortages in the context of open-field strawberry production is a pressing concern. Introducing robotic solutions holds promise for round-the-clock field operations with minimal human oversight, offering long-term security to strawberry farmers. The paper, which this dataset was collected for, focuses on the critical aspect of detecting garden strawberries to guide a strawberry harvesting robot efficiently. A real-time implementation of a strawberry and peduncle detection system, designed to operate on an edge device, is presented. The paper discusses the prerequisites for the vision system, hardware and model selection, training procedures, and results achieved.
Strawberries are produced in Finland on approximately 4,000 hectares, yielding an annual average of 15 million kg of strawberries. To manage this extensive cultivation, an estimated 15,000 to 20,000 foreign strawberry pickers are employed in Finland annually (Migri 2021). Recruiting these foreign workers is a laborious and complex process, involving bureaucratic hurdles, regulatory compliance, and significant expenses for accommodation and occupational health care. Moreover, communication challenges, cultural differences, and varying work paces pose additional difficulties.
The authors suggest that strawberry farmers often struggle to predict the quality of work provided by seasonal laborers. Introducing a harvesting robot could enhance predictability and efficiency, potentially allowing for continuous, minimally supervised fieldwork. Such automation would mitigate personnel-related risks and ensure long-term operational stability for strawberry farmers.
Developing a robotic solution capable of replacing human labor in horticultural production necessitates a precise and rapid perception system. This is crucial for tasks such as harvesting blueberries, peppers, and tomatoes in the agricultural sector.
The decision to grasp the strawberry’s peduncle imposed specific requirements on the vision system:
-
Continuous Tracking: The method must continuously select, locate, and track a single strawberry as the camera approaches it.
-
Peduncle Identification: Once the camera is within 10-50 centimeters of the strawberry, the vision system must consistently identify the peduncle connected to the strawberry in every frame, even when the camera is in motion.
-
Distance Estimation: The system should calculate the estimated distance from the camera to the peduncle once it is detected.
-
Continuous Detection: While the cutter approaches to grasp the peduncle, the vision system must maintain detection of the peduncle in each frame.
-
Optimal Approach Angle: The system should determine a suitable approach angle to the berry. The camera, attached to the cutter, can be rotated around the strawberry to find this ideal angle.
The authors selected the YOLOv5 object detection model, considering its real-time performance, low memory footprint, quick training, and compatibility with NVIDIA TensorRT for real-time inference. This choice was driven by both computational constraints and project time limitations, enabling efficient development and deployment on the target device.
Summary #
Strawberry Dataset for Object Detection is a dataset for an object detection task. It is used in the agricultural industry.
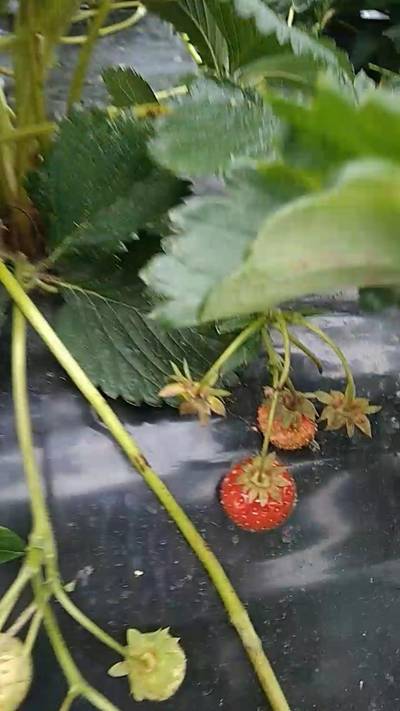
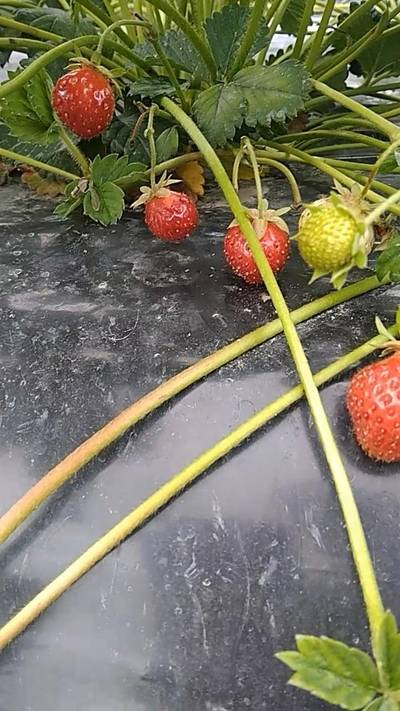
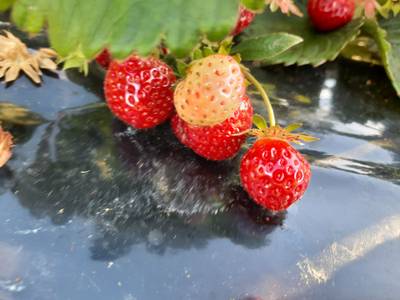
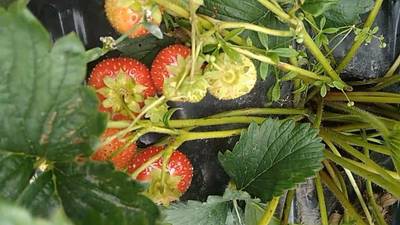
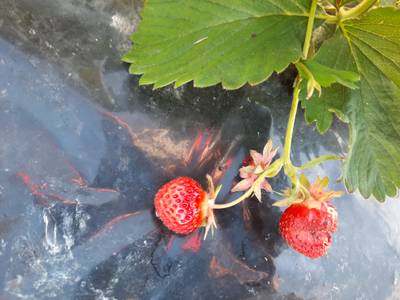
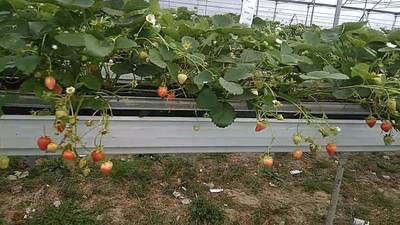
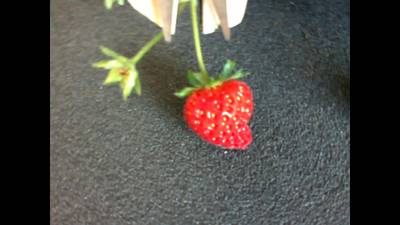
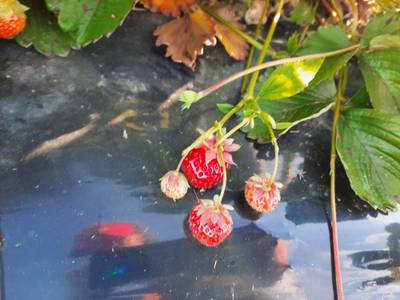
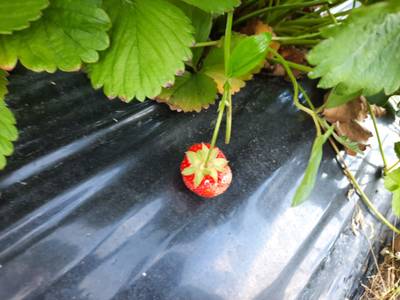
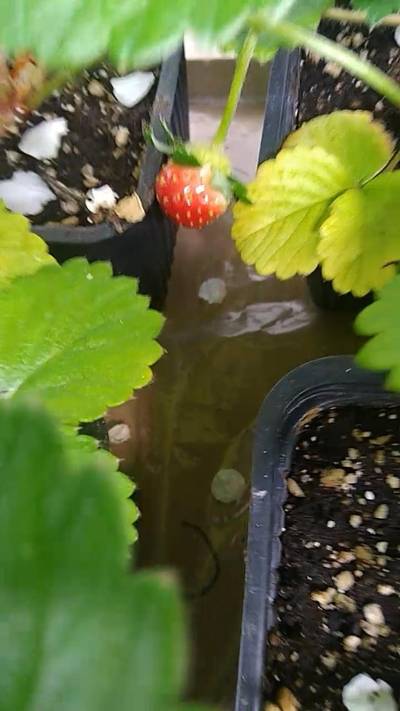
The dataset consists of 813 images with 4568 labeled objects belonging to 3 different classes including ripe, peduncle, and unripe.
Images in the Strawberry Dataset for Object Detection dataset have bounding box annotations. There are 11 (1% of the total) unlabeled images (i.e. without annotations). There are 2 splits in the dataset: training (654 images) and validation (159 images). The dataset was released in 2022 by the Natural Resources Institute Finland (Luke).

Explore #
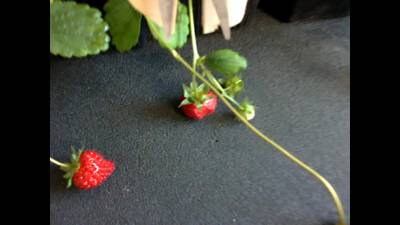
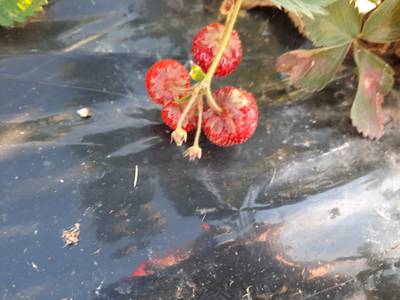
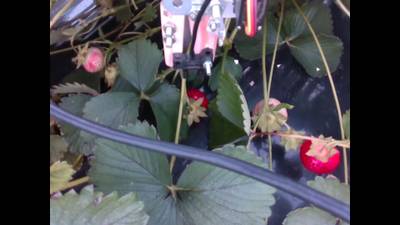
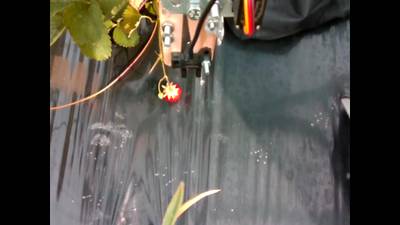
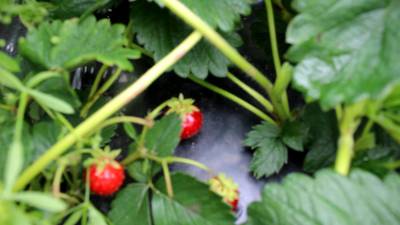
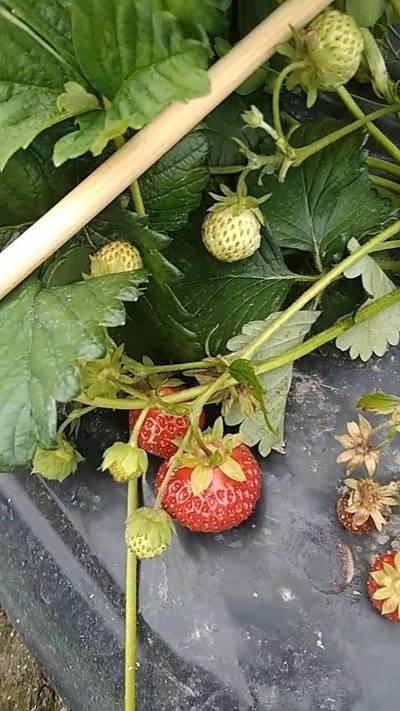
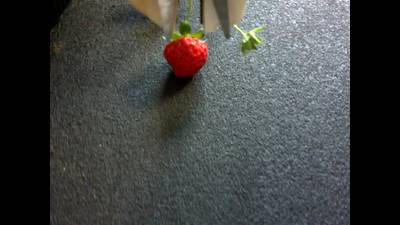
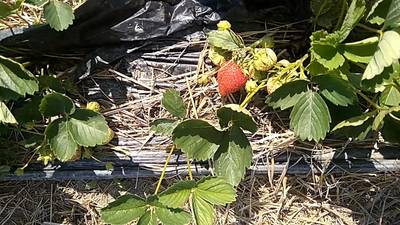
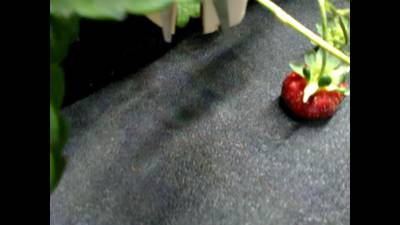
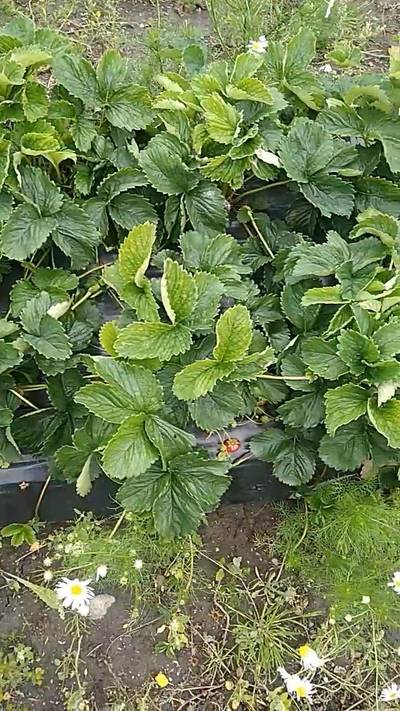
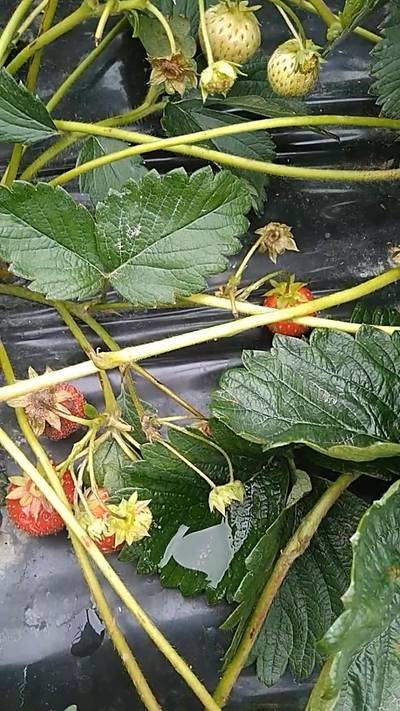
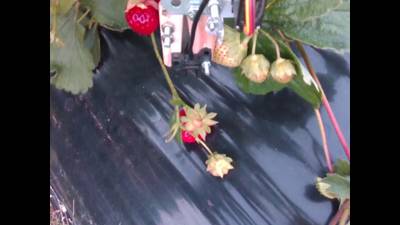
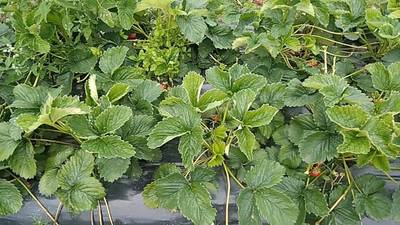
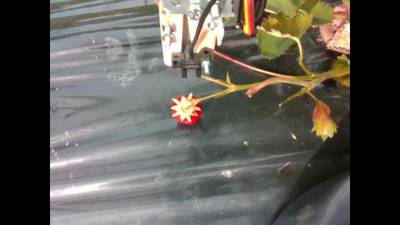
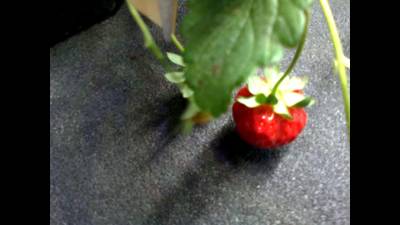
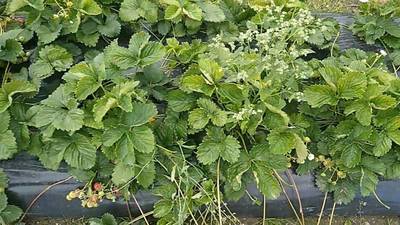
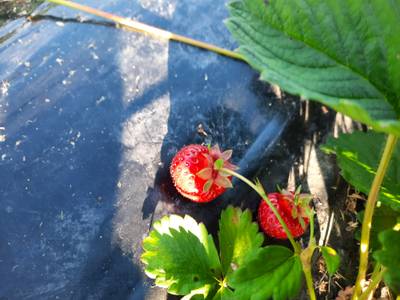
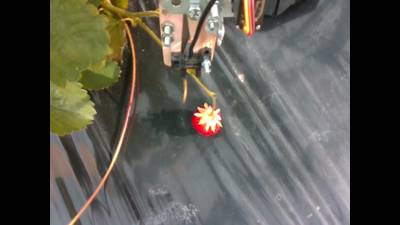
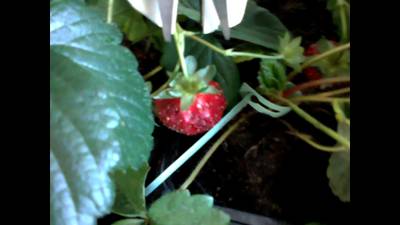
Strawberry Dataset for Object Detection dataset has 813 images. Click on one of the examples below or open "Explore" tool anytime you need to view dataset images with annotations. This tool has extended visualization capabilities like zoom, translation, objects table, custom filters and more. Hover the mouse over the images to hide or show annotations.






























Class balance #
There are 3 annotation classes in the dataset. Find the general statistics and balances for every class in the table below. Click any row to preview images that have labels of the selected class. Sort by column to find the most rare or prevalent classes.
Class ㅤ | Images ㅤ | Objects ㅤ | Count on image average | Area on image average |
|---|---|---|---|---|
ripe➔ rectangle | 798 | 1962 | 2.46 | 5.51% |
peduncle➔ rectangle | 764 | 1859 | 2.43 | 2.77% |
unripe➔ rectangle | 316 | 747 | 2.36 | 2.47% |
Co-occurrence matrix #
Co-occurrence matrix is an extremely valuable tool that shows you the images for every pair of classes: how many images have objects of both classes at the same time. If you click any cell, you will see those images. We added the tooltip with an explanation for every cell for your convenience, just hover the mouse over a cell to preview the description.
Images #
Explore every single image in the dataset with respect to the number of annotations of each class it has. Click a row to preview selected image. Sort by any column to find anomalies and edge cases. Use horizontal scroll if the table has many columns for a large number of classes in the dataset.
Object distribution #
Interactive heatmap chart for every class with object distribution shows how many images are in the dataset with a certain number of objects of a specific class. Users can click cell and see the list of all corresponding images.
Class sizes #
The table below gives various size properties of objects for every class. Click a row to see the image with annotations of the selected class. Sort columns to find classes with the smallest or largest objects or understand the size differences between classes.
Class | Object count | Avg area | Max area | Min area | Min height | Min height | Max height | Max height | Avg height | Avg height | Min width | Min width | Max width | Max width |
|---|---|---|---|---|---|---|---|---|---|---|---|---|---|---|
ripe rectangle | 1962 | 2.27% | 25.77% | 0.03% | 15px | 1.56% | 1100px | 67.22% | 224px | 15.16% | 15px | 1.04% | 1217px | 66.11% |
peduncle rectangle | 1859 | 1.15% | 16.05% | 0% | 1px | 0.03% | 1191px | 64.63% | 227px | 14.44% | 2px | 0.1% | 1286px | 74.72% |
unripe rectangle | 747 | 1.05% | 12.83% | 0% | 2px | 0.16% | 866px | 46.25% | 137px | 9.71% | 1px | 0.14% | 893px | 39.81% |
Spatial Heatmap #
The heatmaps below give the spatial distributions of all objects for every class. These visualizations provide insights into the most probable and rare object locations on the image. It helps analyze objects' placements in a dataset.

Objects #
Table contains all 4568 objects. Click a row to preview an image with annotations, and use search or pagination to navigate. Sort columns to find outliers in the dataset.
Object ID ㅤ | Class ㅤ | Image name click row to open | Image size height x width | Height ㅤ | Height ㅤ | Width ㅤ | Width ㅤ | Area ㅤ |
|---|---|---|---|---|---|---|---|---|
1➔ | ripe rectangle | 634.jpg.png | 480 x 640 | 82px | 17.08% | 89px | 13.91% | 2.38% |
2➔ | ripe rectangle | 634.jpg.png | 480 x 640 | 103px | 21.46% | 74px | 11.56% | 2.48% |
3➔ | ripe rectangle | 634.jpg.png | 480 x 640 | 80px | 16.67% | 90px | 14.06% | 2.34% |
4➔ | peduncle rectangle | 634.jpg.png | 480 x 640 | 101px | 21.04% | 33px | 5.16% | 1.08% |
5➔ | peduncle rectangle | 634.jpg.png | 480 x 640 | 117px | 24.38% | 86px | 13.44% | 3.28% |
6➔ | unripe rectangle | 392.jpg | 720 x 1280 | 193px | 26.81% | 185px | 14.45% | 3.87% |
7➔ | ripe rectangle | 392.jpg | 720 x 1280 | 208px | 28.89% | 232px | 18.12% | 5.24% |
8➔ | ripe rectangle | 392.jpg | 720 x 1280 | 214px | 29.72% | 274px | 21.41% | 6.36% |
9➔ | peduncle rectangle | 392.jpg | 720 x 1280 | 96px | 13.33% | 202px | 15.78% | 2.1% |
10➔ | peduncle rectangle | 392.jpg | 720 x 1280 | 104px | 14.44% | 132px | 10.31% | 1.49% |
License #
Citation #
If you make use of the Strawberry dataset for object detection data, please cite the following reference:
@dataset{pastell_matti_2022_6126677,
  author       = {Pastell Matti, Lemsalu. Madis and Bloch Victor},
  title        = {Strawberry dataset for object detection},
  month        = feb,
  year         = 2022,
  publisher    = {Zenodo},
  version      = {v1},
  doi          = {10.5281/zenodo.6126677},
  url          = {https://doi.org/10.5281/zenodo.6126677}
}
If you are happy with Dataset Ninja and use provided visualizations and tools in your work, please cite us:
@misc{ visualization-tools-for-strawberry-dataset-for-object-detection-dataset,
  title = { Visualization Tools for Strawberry Dataset for Object Detection Dataset },
  type = { Computer Vision Tools },
  author = { Dataset Ninja },
  howpublished = { \url{ https://datasetninja.com/strawberry-dataset-for-object-detection } },
  url = { https://datasetninja.com/strawberry-dataset-for-object-detection },
  journal = { Dataset Ninja },
  publisher = { Dataset Ninja },
  year = { 2026 },
  month = { feb },
  note = { visited on 2026-02-23 },
}
Download #
Dataset Strawberry Dataset for Object Detection can be downloaded in Supervisely format:
As an alternative, it can be downloaded with dataset-tools package:
pip install --upgrade dataset-tools
… using following python code:
import dataset_tools as dtools

dtools.download(dataset='Strawberry Dataset for Object Detection', dst_dir='~/dataset-ninja/')
Make sure not to overlook the python code example available on the Supervisely Developer Portal. It will give you a clear idea of how to effortlessly work with the downloaded dataset.
The data in original format can be downloaded here.
Disclaimer #
Our gal from the legal dep told us we need to post this:
Dataset Ninja provides visualizations and statistics for some datasets that can be found online and can be downloaded by general audience. Dataset Ninja is not a dataset hosting platform and can only be used for informational purposes. The platform does not claim any rights for the original content, including images, videos, annotations and descriptions. Joint publishing is prohibited.
You take full responsibility when you use datasets presented at Dataset Ninja, as well as other information, including visualizations and statistics we provide. You are in charge of compliance with any dataset license and all other permissions. You are required to navigate datasets homepage and make sure that you can use it. In case of any questions, get in touch with us at hello@datasetninja.com.


