

Introduction #
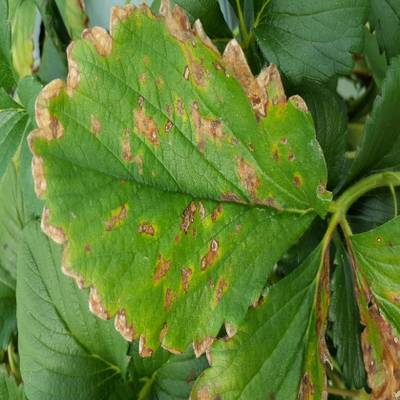
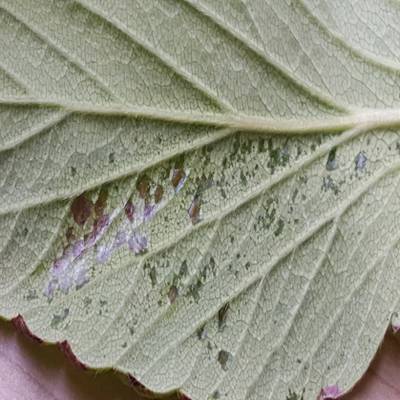
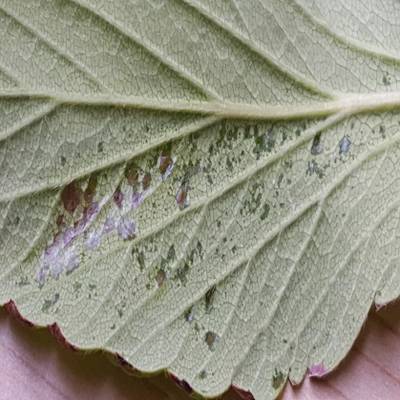
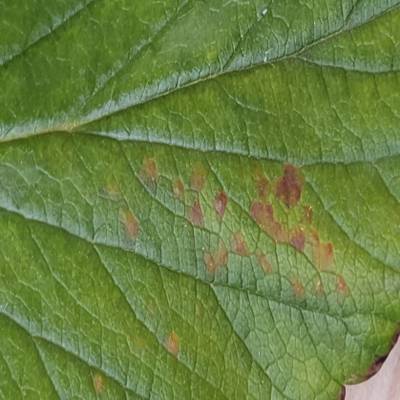
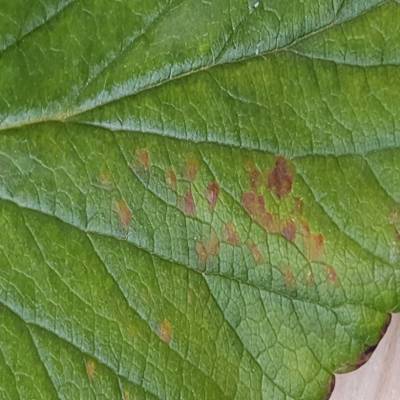
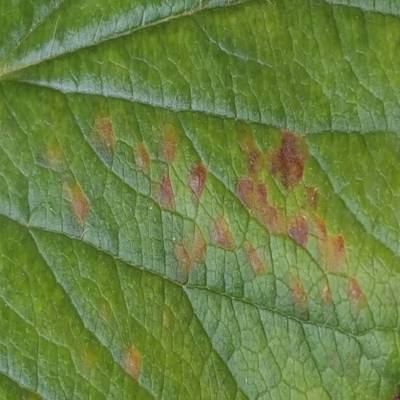
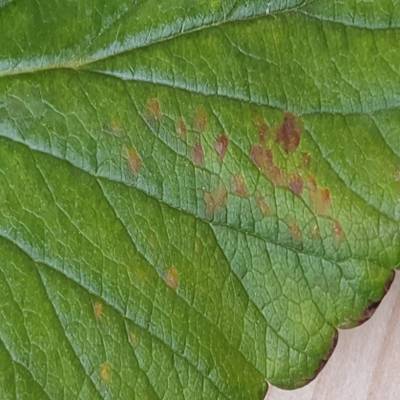
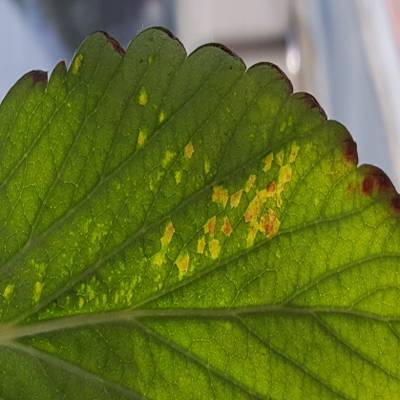
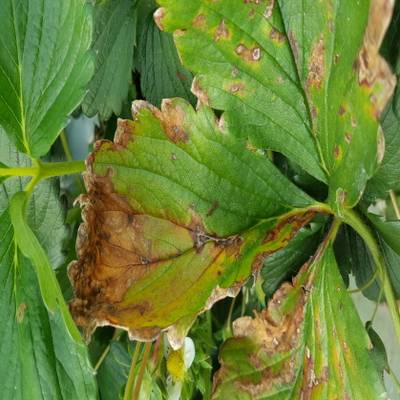
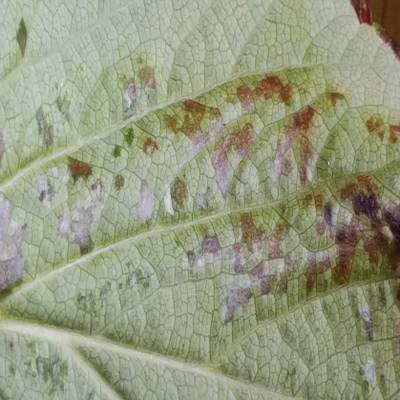
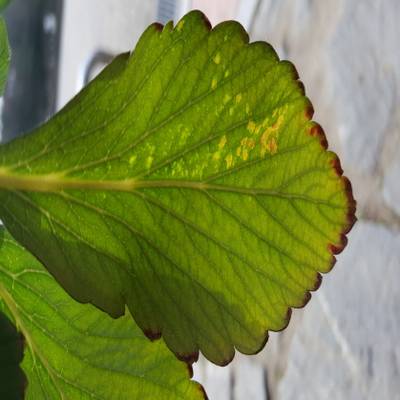
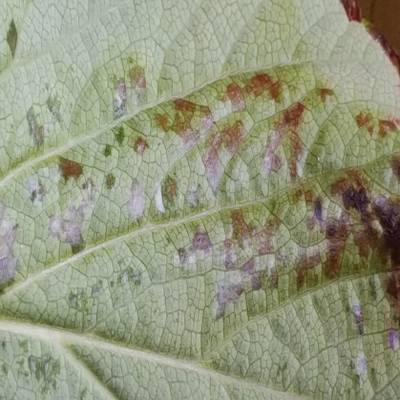
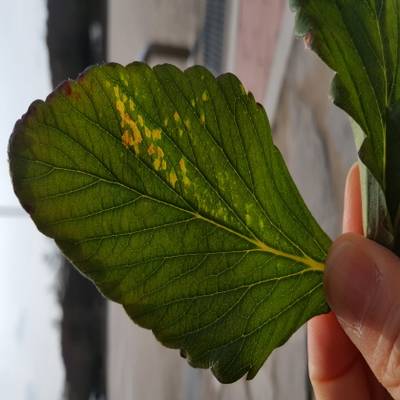
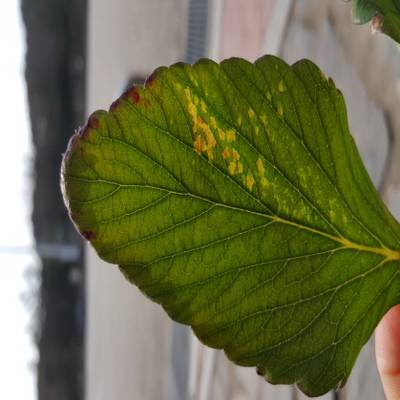
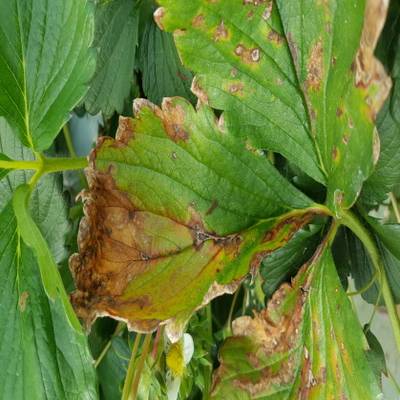
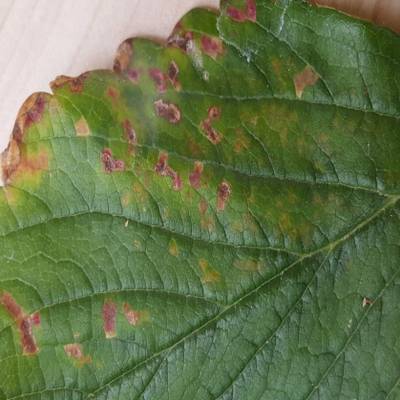
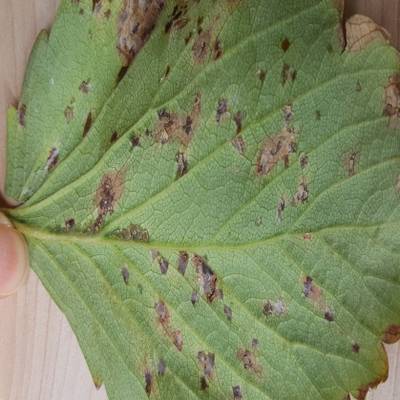
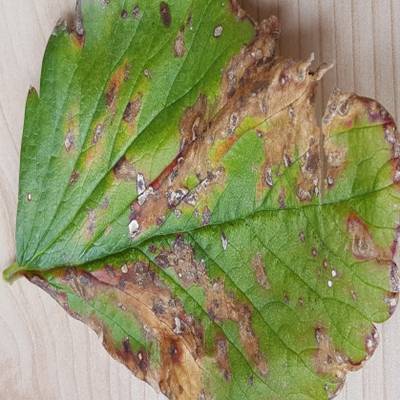
The literature indicates a scarcity of datasets pertaining to the instance segmentation of different kinds of strawberry diseases. Although various models have been developed to perform object detection for multiple diseases in strawberries, there is much to be desired when it comes to datasets allowing fine-grained instance segmentation of multiple diseases and pests in strawberries. In an attempt to fill that void, authors introduce a Strawberry Disease Detection dataset that allows users to segment seven different kinds of strawberry diseases. Since this dataset consists of images that are collected in real fields/green houses instead of a laboratory, it introduces multiple challenges such as having background variations, complex field conditions, different illumination settings, etc. As a result, these variations allows us to design models that have a higher capacity to be more robust and generalizable.
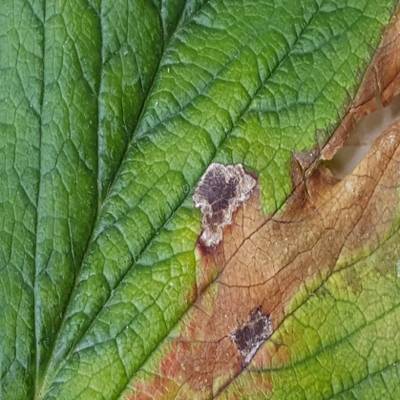
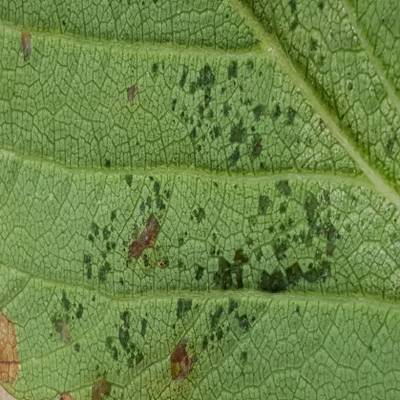
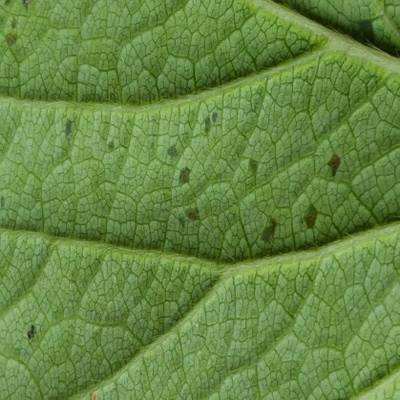
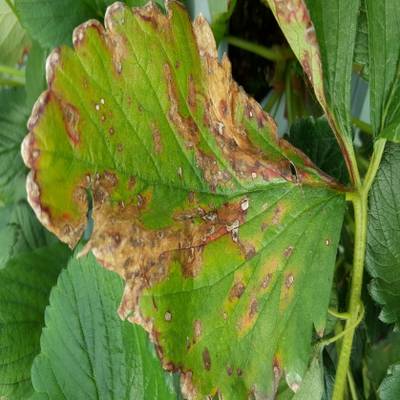
The dataset contains 2500 images for strawberry diseases collected from various greenhouses using camera-equipped mobile phones. The data was collected from multiple greenhouses under natural illumination conditions in South Korea to ensure a diversity of environmental factors. The diseases were verified by experts in the field. Note that approximately 20% of the images contained in the dataset were collected from online sources (Università di Bologna, Bugwood.org (accessed on 22 July 2021); Ontario Ministry of Agriculture, Food and Rural Affairs (OMAFRA); Nicole Ward Gauthier, University of Kentucky; Gerald Holmes, Strawberry Center, Cal Poly San Luis Obispo, Bugwood.org; William W. Turechek USDA ARS; Frank J. Louws, NC State University; Steven Koike, Plant Pathology Farm Advisor, University of California Agriculture and Natural resources blogs; Garrett Ridge, NC State University; Cornell University; College of Agriculture and Life Science blogs; Madeline Dowling, phytographics.com (accessed on 22 July 2021); Jonas Janner Hamann, Universidade Federal de Santa Maria (UFSM), Bugwood.org; Clemson University—USDA Cooperative Extension Slide Series, Bugwood.org; University of Georgia Plant Pathology, University of Georgia, Bugwood.org; Paul Bachi, University of Kentucky Research and Education Center, Bugwood.org; Scott Bauer, USDA Agricultural Research Service, Bugwood.org; John Hartman, University of Kentucky, Bugwood.org; more details in dataset.txt in original data.). The images in the dataset are processed to be of resolution 419 × 419. With regards to imaging distance, the dataset provides both close-up and distant views of the diseases. The dataset is composed of seven different types of strawberry diseases, with images ranging from initial, middle and final stages of the diseases. The dataset is split into 1450, 307 and 743 images for train, val and test sets, respectively. Table 1 provides a brief summary of this dataset. Online augmentation methods are used and as a result, the final number of images depends on the number of epochs the model is trained on the dataset. The dataset will be made publicly available for further experimentation.
| Category of Disease | Images for Training | Images for Validation | Images for Testing |
|---|---|---|---|
| angular_leafspot | 245 | 43 | 147 |
| anthracnose_fruit_rot | 52 | 12 | 33 |
| blossom_blight | 117 | 29 | 62 |
| gray_mold | 255 | 77 | 145 |
| leaf_spot | 382 | 71 | 162 |
| powdery_mildew_fruit | 80 | 12 | 43 |
| powdery_mildew_leaf | 319 | 63 | 151 |
| Total | 1450 | 307 | 743 |
Table 1. A summary of the dataset.
 Homepage
 Research Paper
Summary #
Strawberry Disease Detection is a dataset for instance segmentation, semantic segmentation, and object detection tasks. It is used in the agricultural industry, and in the agricultural research.
The dataset consists of 2500 images with 5707 labeled objects belonging to 7 different classes including leaf_spot, powdery_mildew_leaf, gray_mold, and other: angular_leafspot, blossom_blight, powdery_mildew_fruit, and anthracnose_fruit_rot.
Images in the Strawberry Disease Detection dataset have pixel-level instance segmentation annotations. Due to the nature of the instance segmentation task, it can be automatically transformed into a semantic segmentation (only one mask for every class) or object detection (bounding boxes for every object) tasks. All images are labeled (i.e. with annotations). There are 3 splits in the dataset: train (1450 images), test (743 images), and val (307 images). Also, the dataset includes level_1 and level_2 tags for test split. The dataset was released in 2021 by the Jeonbuk National University.
Explore #
Strawberry Disease Detection dataset has 2500 images. Click on one of the examples below or open "Explore" tool anytime you need to view dataset images with annotations. This tool has extended visualization capabilities like zoom, translation, objects table, custom filters and more. Hover the mouse over the images to hide or show annotations.


Class balance #
There are 7 annotation classes in the dataset. Find the general statistics and balances for every class in the table below. Click any row to preview images that have labels of the selected class. Sort by column to find the most rare or prevalent classes.

Class ㅤ | Images ㅤ | Objects ㅤ | Count on image average | Area on image average |
|---|---|---|---|---|
leaf_spot➔ polygon | 615 | 2100 | 3.41 | 61.79% |
powdery_mildew_leaf➔ polygon | 533 | 1708 | 3.2 | 26.96% |
gray_mold➔ polygon | 476 | 598 | 1.26 | 9.9% |
angular_leafspot➔ polygon | 435 | 539 | 1.24 | 56.12% |
blossom_blight➔ polygon | 209 | 300 | 1.44 | 3.68% |
powdery_mildew_fruit➔ polygon | 141 | 298 | 2.11 | 22.61% |
anthracnose_fruit_rot➔ polygon | 100 | 164 | 1.64 | 17.16% |
Co-occurrence matrix #
Co-occurrence matrix is an extremely valuable tool that shows you the images for every pair of classes: how many images have objects of both classes at the same time. If you click any cell, you will see those images. We added the tooltip with an explanation for every cell for your convenience, just hover the mouse over a cell to preview the description.
Images #
Explore every single image in the dataset with respect to the number of annotations of each class it has. Click a row to preview selected image. Sort by any column to find anomalies and edge cases. Use horizontal scroll if the table has many columns for a large number of classes in the dataset.
Object distribution #
Interactive heatmap chart for every class with object distribution shows how many images are in the dataset with a certain number of objects of a specific class. Users can click cell and see the list of all corresponding images.
Class sizes #
The table below gives various size properties of objects for every class. Click a row to see the image with annotations of the selected class. Sort columns to find classes with the smallest or largest objects or understand the size differences between classes.
Class | Object count | Avg area | Max area | Min area | Min height | Min height | Max height | Max height | Avg height | Avg height | Min width | Min width | Max width | Max width |
|---|---|---|---|---|---|---|---|---|---|---|---|---|---|---|
leaf_spot polygon | 2100 | 17.95% | 95.93% | 0.4% | 33px | 7.88% | 419px | 100% | 234px | 55.94% | 17px | 4.06% | 419px | 100% |
powdery_mildew_leaf polygon | 1708 | 8.3% | 75.16% | 0.26% | 20px | 4.77% | 419px | 100% | 160px | 38.09% | 18px | 4.3% | 419px | 100% |
gray_mold polygon | 598 | 7.73% | 72.41% | 0.41% | 40px | 9.55% | 419px | 100% | 166px | 39.72% | 30px | 7.16% | 389px | 92.84% |
angular_leafspot polygon | 539 | 44.96% | 99.52% | 0.07% | 19px | 4.53% | 419px | 100% | 328px | 78.27% | 16px | 3.82% | 419px | 100% |
blossom_blight polygon | 300 | 2.49% | 11.84% | 0.67% | 50px | 11.93% | 224px | 53.46% | 98px | 23.44% | 32px | 7.64% | 151px | 36.04% |
powdery_mildew_fruit polygon | 298 | 10.59% | 62.11% | 0.42% | 34px | 8.11% | 419px | 100% | 168px | 40% | 28px | 6.68% | 378px | 90.21% |
anthracnose_fruit_rot polygon | 164 | 10.34% | 65.14% | 0.23% | 27px | 6.44% | 419px | 100% | 148px | 35.28% | 23px | 5.49% | 389px | 92.84% |
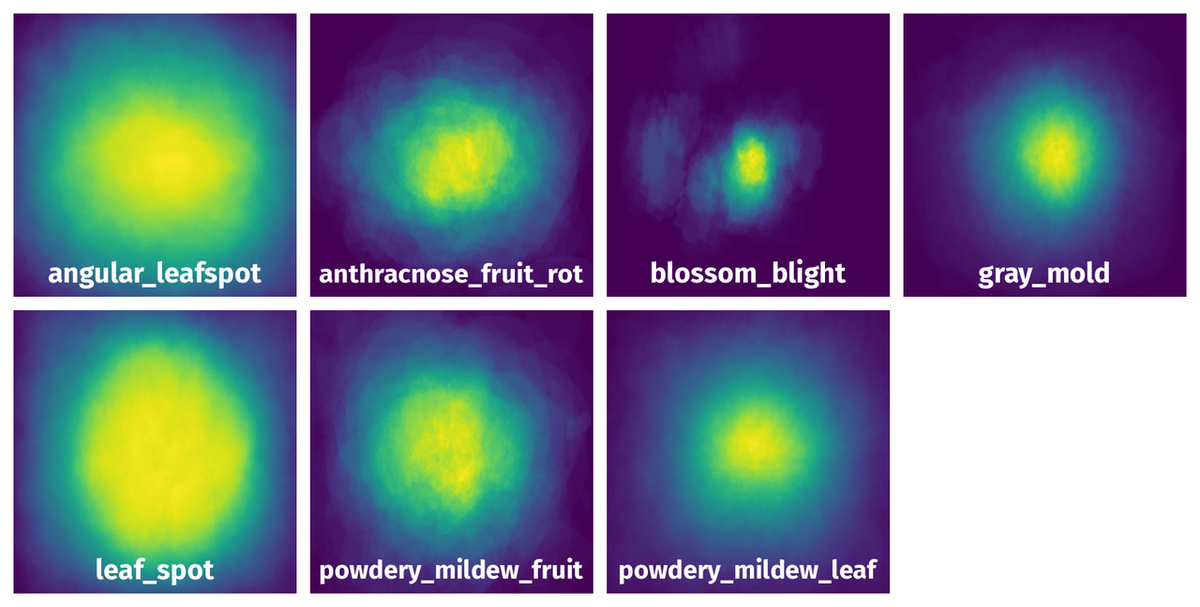
Spatial Heatmap #
The heatmaps below give the spatial distributions of all objects for every class. These visualizations provide insights into the most probable and rare object locations on the image. It helps analyze objects' placements in a dataset.
Objects #
Table contains all 5707 objects. Click a row to preview an image with annotations, and use search or pagination to navigate. Sort columns to find outliers in the dataset.
Object ID ㅤ | Class ㅤ | Image name click row to open | Image size height x width | Height ㅤ | Height ㅤ | Width ㅤ | Width ㅤ | Area ㅤ |
|---|---|---|---|---|---|---|---|---|
1➔ | angular_leafspot polygon | angular_leafspot162.jpg | 419 x 419 | 419px | 100% | 416px | 99.28% | 88.98% |
2➔ | gray_mold polygon | gray_mold93.jpg | 419 x 419 | 101px | 24.11% | 134px | 31.98% | 4.84% |
3➔ | anthracnose_fruit_rot polygon | anthracnose_fruit_rot36.jpg | 419 x 419 | 84px | 20.05% | 148px | 35.32% | 5.62% |
4➔ | anthracnose_fruit_rot polygon | anthracnose_fruit_rot36.jpg | 419 x 419 | 179px | 42.72% | 243px | 58% | 15.61% |
5➔ | leaf_spot polygon | leaf_spot64.jpg | 419 x 419 | 393px | 93.79% | 315px | 75.18% | 50.27% |
6➔ | leaf_spot polygon | leaf_spot64.jpg | 419 x 419 | 131px | 31.26% | 111px | 26.49% | 6.09% |
7➔ | leaf_spot polygon | leaf_spot64.jpg | 419 x 419 | 291px | 69.45% | 90px | 21.48% | 12.68% |
8➔ | powdery_mildew_leaf polygon | powdery_mildew_leaf514.jpg | 419 x 419 | 185px | 44.15% | 296px | 70.64% | 18.98% |
9➔ | angular_leafspot polygon | angular_leafspot287.jpg | 419 x 419 | 398px | 94.99% | 330px | 78.76% | 32.57% |
10➔ | anthracnose_fruit_rot polygon | anthracnose_fruit_rot62.jpg | 419 x 419 | 218px | 52.03% | 252px | 60.14% | 23.1% |
License #
Citation #
If you make use of the Strawberry Disease Detection data, please cite the following reference:
@Article{s21196565,
  AUTHOR = {Afzaal, Usman and Bhattarai, Bhuwan and Pandeya, Yagya Raj and Lee, Joonwhoan},
  TITLE = {An Instance Segmentation Model for Strawberry Diseases Based on Mask R-CNN},
  JOURNAL = {Sensors},
  VOLUME = {21},
  YEAR = {2021},
  NUMBER = {19},
  ARTICLE-NUMBER = {6565},
  URL = {https://www.mdpi.com/1424-8220/21/19/6565},
  PubMedID = {34640893},
  ISSN = {1424-8220},
  DOI = {10.3390/s21196565}
}
If you are happy with Dataset Ninja and use provided visualizations and tools in your work, please cite us:
@misc{ visualization-tools-for-strawberry-disease-detection-dataset,
  title = { Visualization Tools for Strawberry Disease Detection Dataset },
  type = { Computer Vision Tools },
  author = { Dataset Ninja },
  howpublished = { \url{ https://datasetninja.com/strawberry-disease-detection } },
  url = { https://datasetninja.com/strawberry-disease-detection },
  journal = { Dataset Ninja },
  publisher = { Dataset Ninja },
  year = { 2026 },
  month = { jul },
  note = { visited on 2026-07-31 },
}
Download #
Dataset Strawberry Disease Detection can be downloaded in Supervisely format:
As an alternative, it can be downloaded with dataset-tools package:
pip install --upgrade dataset-tools
… using following python code:
import dataset_tools as dtools

dtools.download(dataset='Strawberry Disease Detection', dst_dir='~/dataset-ninja/')
Make sure not to overlook the python code example available on the Supervisely Developer Portal. It will give you a clear idea of how to effortlessly work with the downloaded dataset.
Disclaimer #
Our gal from the legal dep told us we need to post this:
Dataset Ninja provides visualizations and statistics for some datasets that can be found online and can be downloaded by general audience. Dataset Ninja is not a dataset hosting platform and can only be used for informational purposes. The platform does not claim any rights for the original content, including images, videos, annotations and descriptions. Joint publishing is prohibited.
You take full responsibility when you use datasets presented at Dataset Ninja, as well as other information, including visualizations and statistics we provide. You are in charge of compliance with any dataset license and all other permissions. You are required to navigate datasets homepage and make sure that you can use it. In case of any questions, get in touch with us at hello@datasetninja.com.