

Introduction #
The authors present A Semantically Annotated 15-Class Ground Truth Dataset for Substation Equipment with 1660 images annotated with 15 classes, including insulators, disconnect_switches, transformers and other equipment commonly found in substation environments. The images were captured using a combination of human, fixed and AGV-mounted cameras at different times of the day, providing a diverse set of training and testing data for algorithm development. In total, 50,705 annotations were created by a team of experienced annotators, using a standardized process to ensure accuracy across the dataset. The resulting dataset provides a valuable resource for researchers and practitioners working in the fields of substation automation, substation monitoring and computer vision. Its availability has the potential to advance the state of the art in this important area.
Table 1 provides an overview of the distribution of the images based on source. The unspecified smartphone and digital cameras collected by humans on the field are referred to as miscellaneous. The images in the dataset come in a variety of resolutions, as shown in Table 2.
| Source | Camera | Quantity |
|---|---|---|
| Human (Morning) | Misc, T540 | 682 |
| AGV (Morning and afternoon) | A700 | 230 |
| AGV (Night, light) | A700 | 360 |
| AGV (Night, no light) | A700 | 348 |
| Fixed (Morning and afternoon) | A700 | 32 |
| Fixed (Night, light) | A700 | 8 |
Table 1. Dataset distribution based on source.
| Resolution | Occurrences |
|---|---|
| 1280 × 960 | 887 |
| 2592 × 1944 | 268 |
| 2880 × 2160 | 266 |
| 4032 × 3024 | 98 |
| 4000 × 3000 | 36 |
| 640 × 480 | 31 |
| 4624 × 3468 | 28 |
| 2048 × 1536 | 27 |
| 704 × 480 | 10 |
| 1156 × 867 | 4 |
| 1280 × 720 | 2 |
| 2324 × 1440 | 1 |
| 4624 × 2604 | 1 |
| 4672 × 3504 | 1 |
Table 2. Resolutions and occurrences of the 1660 images in this dataset.
There are 15 classes of substation equipment. Table 3 lists them, along with how many times each object appears in the “Instances” column. An example of each object class is presented in Figure 1.
| Class | Instances | RGB |
|---|---|---|
| Background | - | (000, 000, 000) |
| Open blade disconnect switch | 310 | (162, 000, 255) |
| Closed blade disconnect switch | 5243 | (097, 016, 162) |
| Open tandem disconnect switch | 1599 | (081, 162, 000) |
| Closed tandem disconnect switch | 966 | (048, 097, 165) |
| Breaker | 980 | (121, 121, 121) |
| Fuse disconnect switch | 355 | (255, 097, 178) |
| Glass disc insulator | 3185 | (154, 032, 121) |
| Porcelain pin insulator | 26,499 | (255, 255, 125) |
| Muffle | 1354 | (162, 243, 162) |
| Lightning arrester | 1976 | (143, 211, 255) |
| Recloser | 2331 | (040, 000, 186) |
| Power transformer | 768 | (255, 182, 000) |
| Current transformer | 2136 | (138, 138, 000) |
| Potential transformer | 654 | (162, 048, 000) |
| Tripolar disconnect switch | 2349 | (162, 000, 096) |
Table 3. Object classes, number of instances in the dataset and their colours in RGB values used for the .png segmentation masks.

Figure 1. An example for each of the 15 classes present in the dataset. (a) Open blade disconnect switch. (b) Closed blade disconnect switch. © Open tandem disconnect switch. (d) Closed tandem disconnect switch. (e) Breaker. (f) Fuse disconnect switch. (g) Glass disc insulator. (h) Porcelain pin insulator. (i) Muffle. (j) Lightning arrester. (k) Recloser. (l) Power transformer. (m) Current transformer. (n) Potential transformer. (o) Tripolar disconnect switch.
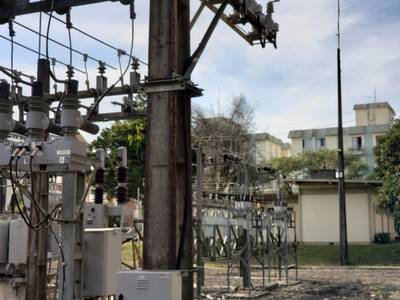
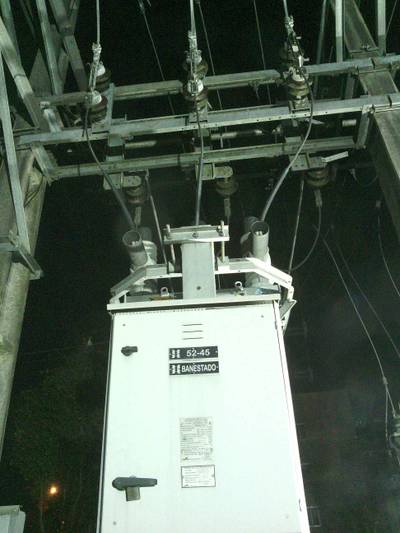
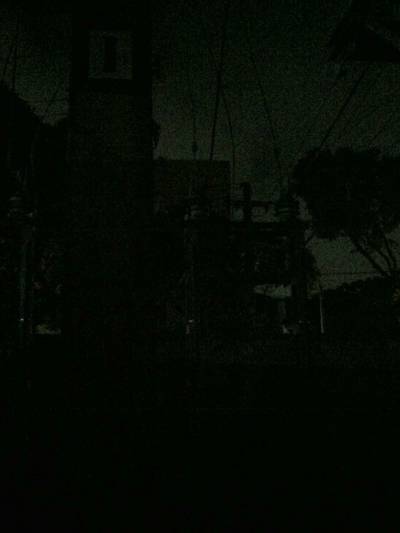
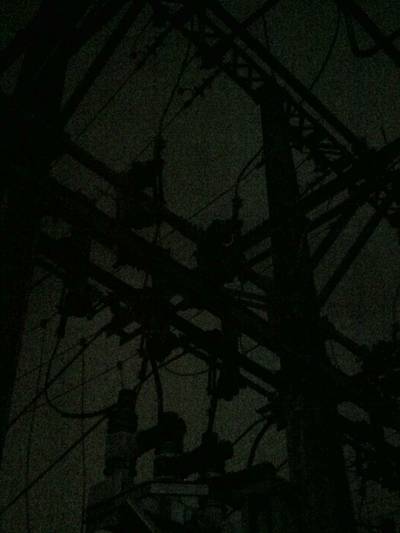
The images in this dataset were captured from a single electrical distribution substation in Brazil over a period of two years, at different times of day and under varying weather and seasonal conditions, ensuring a diverse range of lighting conditions for the depicted objects. All the images underwent a curation process by experts in Electrical Engineering to ensure that the angles and distances depicted in the images were suitable for automating inspections in a substation.
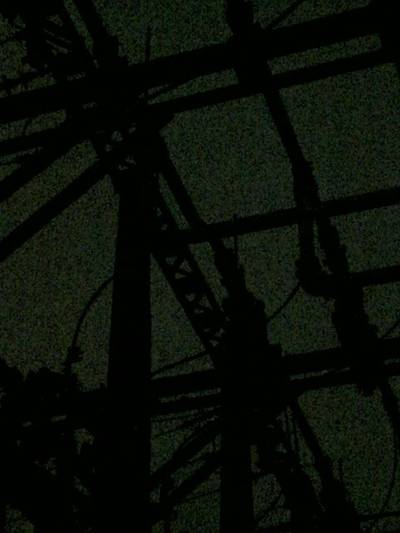
According to the provided information from the electrical company overseeing the substation, the energy consumption profile exhibits a consistent pattern throughout the year. The profile shows a global minimum at 6h00, a local maximum at 13h00, a local minimum at 17h00 and a global maximum at 20h00, with slight amplitude variations. Based on this insight, a collection schedule was devised for automated inspections, encompassing time slots at 8h00, 13h00, 17h00 and 20h00. Human-led collections were conducted exclusively during the morning period to align with the availability of on-field company technicians assisting our researchers.
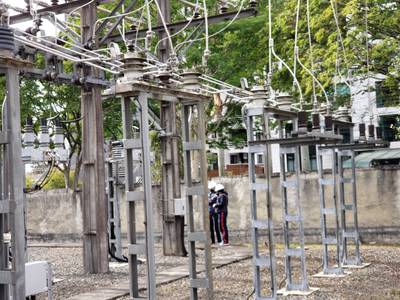
The human-collected images were captured by various individuals using different camera models, including smartphone cameras, unspecified digital cameras and the FLIR T540, as shown in Figure 3. There was no standardization in terms of camera angles or distances, although the maximum distance for image capture was limited to 30 m. Those images were taken during the morning period, with the time of capture ranging from 8h00 to 12h00.

Figure 3. A technician capturing images using the FLIR T540 camera.
The Autonomous Ground Vehicle (AGV) shown in Figure 4 used the FLIR A700 camera to collect the majority of the images in this dataset. This AGV followed a predetermined path through 60 possible scenes, capturing images at fixed angles and distances ranging from 3 to 5 m. Those collections were conducted three times per day, with the specific times being in the morning (between 8h00 and 10h00), in the afternoon (between 13h00 and 17h00) and at night (between 20h00 and 21h00).

Figure 4. A photo of our AGV equipped with the FLIR A700 (marked with the red box) and the FLIR A310 (the white one, with two separate lenses) cameras on a substation floor. The A310 was not used to take any photos for this dataset but was used for pan-tilt purposes for other mounted cameras.
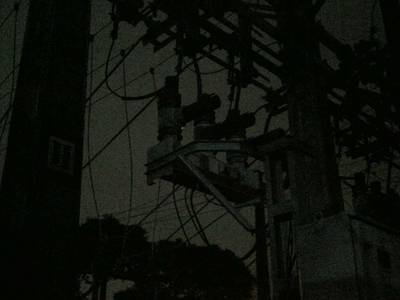
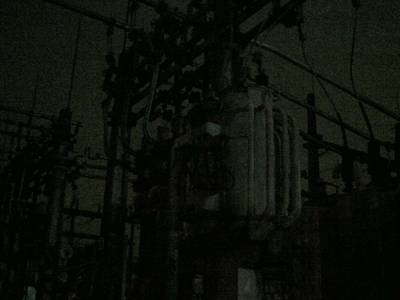
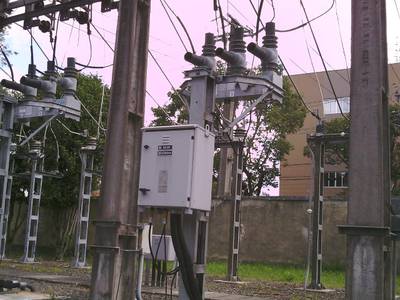
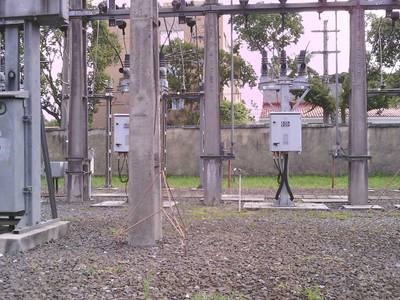
The FLIR A700 camera fixed in the substation, shown in Figure 5, collected photos also three times per day: in the morning (between 6h00 and 11h00), in the afternoon (between 13h00 and 18h00) and at night (between 21h00 and 00h00).

Figure 5. Photos of the A700 fixed in the substation. The camera is encircled in red in both subimages. (a) Front view of the A700. (b) Back view of the A700 showing objects in its field of view.
Authors annotated the semantic dataset using the software LabelMe, as shown in Figure 6. The annotation process took approximately 1100 man-hours over the course of 4 months by 9 people.

Figure 6. Examples of manual annotation for semantic segmentation using LabelMe. The colors used by LabelMe have no relation to the colors used in the masks from Table 3. (a) Insulators (red) and breakers (green). (b) A recloser (purple).
Please note that DatasetNinja upload Instance version of Substation Equipment. The dataset contains objects separated by objects located in the foreground, which can lead to incorrect interpretation of data.
 Homepage
 Research Paper
Summary #
A Semantically Annotated 15-Class Ground Truth Dataset for Substation Equipment is a dataset for instance segmentation, object detection, semantic segmentation, and weakly supervised learning tasks. It is used in the energy industry.
The dataset consists of 1660 images with 50604 labeled objects belonging to 15 different classes including porcelain_pin_insulator, closed_blade_disconnect_switch, recloser, and other: glass_disc_insulator, current_transformer, lightning_arrester, power_transformer, breaker, potential_transformer, closed_tandem_disconnect_switch, open_tandem_disconnect_switch, tripolar_disconnect_switch, muffle, fuse_disconnect_switch, and open_blade_disconnect_switch.
Images in the Substation Equipment dataset have pixel-level instance segmentation annotations. Due to the nature of the instance segmentation task, it can be automatically transformed into a semantic segmentation (only one mask for every class) or object detection (bounding boxes for every object) tasks. There are 6 (0% of the total) unlabeled images (i.e. without annotations). There are no pre-defined train/val/test splits in the dataset. Note, that background class has been removed due to possible misinterpretation of data. The dataset was released in 2023 by the Universidade Tecnológica Federal do Paraná, Pontifícia Universidade Católica do Rio de Janeiro, and Paranaense de Energia SA (Copel).
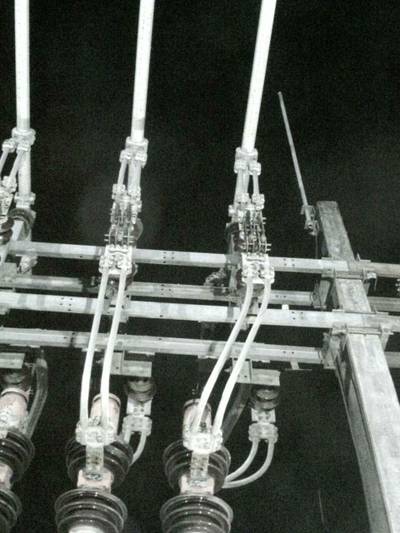
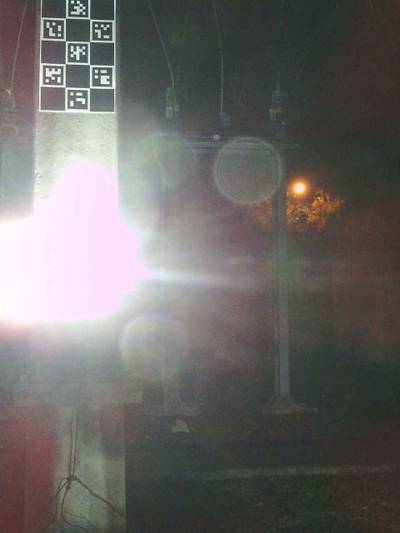
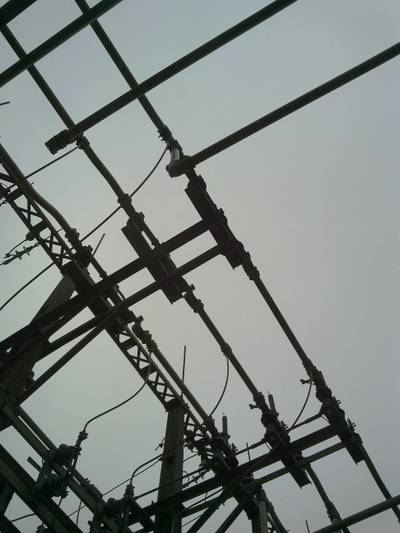
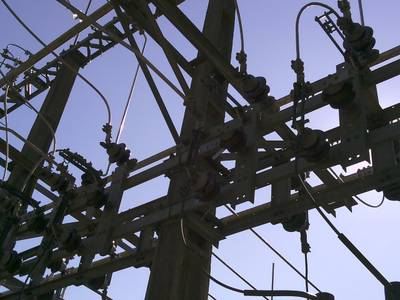
Here are the visualized examples for the classes:
Explore #
Substation Equipment dataset has 1660 images. Click on one of the examples below or open "Explore" tool anytime you need to view dataset images with annotations. This tool has extended visualization capabilities like zoom, translation, objects table, custom filters and more. Hover the mouse over the images to hide or show annotations.


Class balance #
There are 15 annotation classes in the dataset. Find the general statistics and balances for every class in the table below. Click any row to preview images that have labels of the selected class. Sort by column to find the most rare or prevalent classes.

Class ㅤ | Images ㅤ | Objects ㅤ | Count on image average | Area on image average |
|---|---|---|---|---|
porcelain_pin_insulator➔ polygon | 1413 | 26450 | 18.72 | 1.58% |
closed_blade_disconnect_switch➔ polygon | 1066 | 5225 | 4.9 | 1.77% |
recloser➔ polygon | 861 | 2330 | 2.71 | 4.17% |
glass_disc_insulator➔ polygon | 739 | 3180 | 4.3 | 0.25% |
current_transformer➔ polygon | 707 | 2128 | 3.01 | 0.61% |
lightning_arrester➔ polygon | 537 | 1974 | 3.68 | 0.25% |
power_transformer➔ polygon | 406 | 768 | 1.89 | 9.21% |
breaker➔ polygon | 367 | 980 | 2.67 | 2.92% |
potential_transformer➔ polygon | 275 | 651 | 2.37 | 0.33% |
closed_tandem_disconnect_switch➔ polygon | 274 | 957 | 3.49 | 1.39% |
Co-occurrence matrix #
Co-occurrence matrix is an extremely valuable tool that shows you the images for every pair of classes: how many images have objects of both classes at the same time. If you click any cell, you will see those images. We added the tooltip with an explanation for every cell for your convenience, just hover the mouse over a cell to preview the description.
Images #
Explore every single image in the dataset with respect to the number of annotations of each class it has. Click a row to preview selected image. Sort by any column to find anomalies and edge cases. Use horizontal scroll if the table has many columns for a large number of classes in the dataset.
Class sizes #
The table below gives various size properties of objects for every class. Click a row to see the image with annotations of the selected class. Sort columns to find classes with the smallest or largest objects or understand the size differences between classes.
Class | Object count | Avg area | Max area | Min area | Min height | Min height | Max height | Max height | Avg height | Avg height | Min width | Min width | Max width | Max width |
|---|---|---|---|---|---|---|---|---|---|---|---|---|---|---|
porcelain_pin_insulator polygon | 26450 | 0.08% | 16.16% | 0% | 4px | 0.17% | 2291px | 53.66% | 64px | 3.28% | 2px | 0.09% | 2244px | 64.71% |
closed_blade_disconnect_switch polygon | 5225 | 0.35% | 16.22% | 0% | 9px | 0.38% | 2003px | 92.73% | 216px | 11.44% | 3px | 0.1% | 1107px | 38.44% |
glass_disc_insulator polygon | 3180 | 0.05% | 0.78% | 0% | 6px | 0.24% | 399px | 16.35% | 62px | 3.37% | 3px | 0.2% | 283px | 16.95% |
tripolar_disconnect_switch polygon | 2348 | 0.23% | 4.9% | 0% | 5px | 0.19% | 754px | 40.1% | 124px | 7.7% | 3px | 0.15% | 839px | 38.33% |
recloser polygon | 2330 | 1.52% | 25.44% | 0% | 3px | 0.14% | 1355px | 62.73% | 230px | 12.73% | 4px | 0.15% | 1486px | 81.04% |
current_transformer polygon | 2128 | 0.2% | 2.68% | 0% | 6px | 0.23% | 761px | 26.35% | 125px | 6.42% | 4px | 0.14% | 1232px | 30.56% |
lightning_arrester polygon | 1974 | 0.06% | 1.78% | 0% | 4px | 0.19% | 963px | 31.85% | 84px | 4.19% | 4px | 0.17% | 397px | 9.85% |
open_tandem_disconnect_switch polygon | 1596 | 0.18% | 4.31% | 0% | 4px | 0.21% | 1114px | 51.57% | 108px | 5.86% | 4px | 0.22% | 659px | 22.88% |
muffle polygon | 1354 | 0.09% | 0.92% | 0% | 4px | 0.31% | 956px | 36.26% | 165px | 8.88% | 5px | 0.17% | 280px | 9.26% |
breaker polygon | 980 | 1.08% | 15.14% | 0% | 6px | 0.36% | 1468px | 60.74% | 298px | 15.63% | 7px | 0.2% | 1487px | 53.8% |
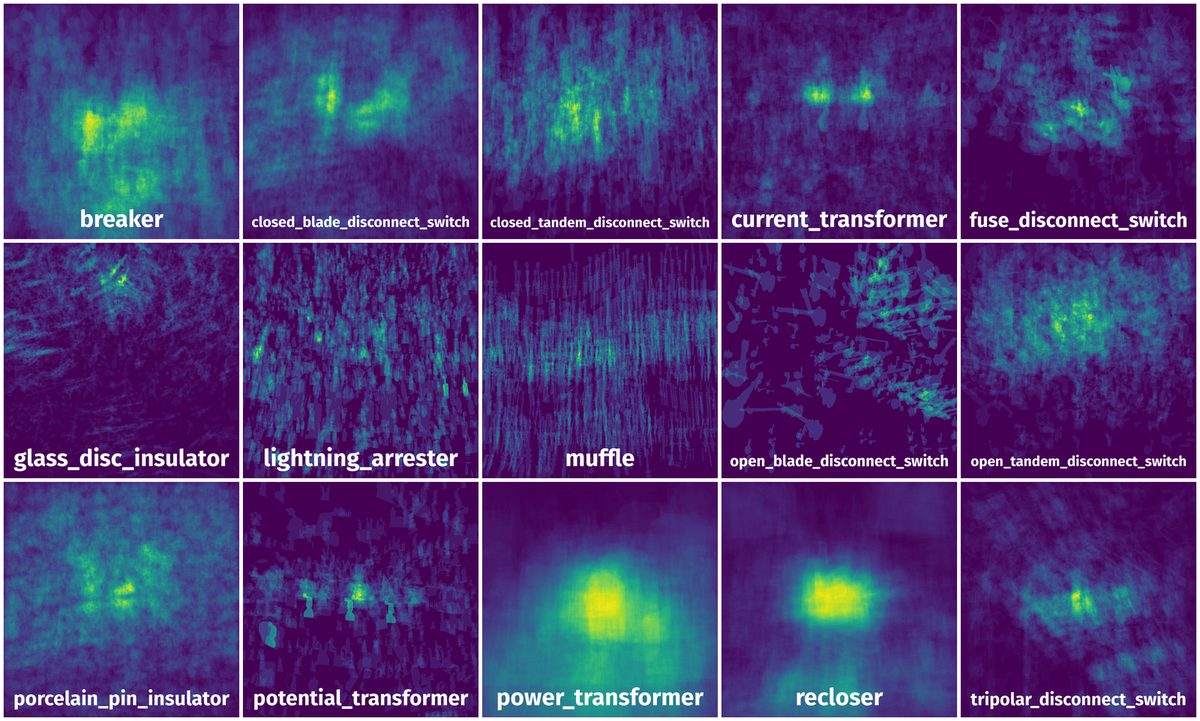
Spatial Heatmap #
The heatmaps below give the spatial distributions of all objects for every class. These visualizations provide insights into the most probable and rare object locations on the image. It helps analyze objects' placements in a dataset.
Objects #
Table contains all 50604 objects. Click a row to preview an image with annotations, and use search or pagination to navigate. Sort columns to find outliers in the dataset.
Object ID ㅤ | Class ㅤ | Image name click row to open | Image size height x width | Height ㅤ | Height ㅤ | Width ㅤ | Width ㅤ | Area ㅤ |
|---|---|---|---|---|---|---|---|---|
1➔ | porcelain_pin_insulator polygon | FLIR7238_rgb_wQvPtR5.jpg | 960 x 1280 | 47px | 4.9% | 24px | 1.88% | 0.07% |
2➔ | porcelain_pin_insulator polygon | FLIR7238_rgb_wQvPtR5.jpg | 960 x 1280 | 40px | 4.17% | 42px | 3.28% | 0.08% |
3➔ | porcelain_pin_insulator polygon | FLIR7238_rgb_wQvPtR5.jpg | 960 x 1280 | 43px | 4.48% | 33px | 2.58% | 0.07% |
4➔ | porcelain_pin_insulator polygon | FLIR7238_rgb_wQvPtR5.jpg | 960 x 1280 | 46px | 4.79% | 42px | 3.28% | 0.09% |
5➔ | porcelain_pin_insulator polygon | FLIR7238_rgb_wQvPtR5.jpg | 960 x 1280 | 42px | 4.38% | 42px | 3.28% | 0.09% |
6➔ | porcelain_pin_insulator polygon | FLIR7238_rgb_wQvPtR5.jpg | 960 x 1280 | 51px | 5.31% | 52px | 4.06% | 0.15% |
7➔ | porcelain_pin_insulator polygon | FLIR7238_rgb_wQvPtR5.jpg | 960 x 1280 | 28px | 2.92% | 46px | 3.59% | 0.06% |
8➔ | porcelain_pin_insulator polygon | FLIR7238_rgb_wQvPtR5.jpg | 960 x 1280 | 43px | 4.48% | 50px | 3.91% | 0.11% |
9➔ | porcelain_pin_insulator polygon | FLIR7238_rgb_wQvPtR5.jpg | 960 x 1280 | 49px | 5.1% | 50px | 3.91% | 0.14% |
10➔ | porcelain_pin_insulator polygon | FLIR7238_rgb_wQvPtR5.jpg | 960 x 1280 | 49px | 5.1% | 49px | 3.83% | 0.13% |
License #
Citation #
If you make use of the Substation Equipment data, please cite the following reference:
@dataset{gomes_andreas_2023_7884270,
  author       = {Gomes, Andreas},
  title        = {{A Semantically Annotated 15-Class Ground Truth
                   Dataset for Substation Equipment}},
  month        = may,
  year         = 2023,
  publisher    = {Zenodo},
  version      = {1.0},
  doi          = {10.5281/zenodo.7884270},
  url          = {https://doi.org/10.5281/zenodo.7884270}
}
If you are happy with Dataset Ninja and use provided visualizations and tools in your work, please cite us:
@misc{ visualization-tools-for-substation-equipment-dataset,
  title = { Visualization Tools for Substation Equipment Dataset },
  type = { Computer Vision Tools },
  author = { Dataset Ninja },
  howpublished = { \url{ https://datasetninja.com/substation-equipment } },
  url = { https://datasetninja.com/substation-equipment },
  journal = { Dataset Ninja },
  publisher = { Dataset Ninja },
  year = { 2026 },
  month = { jul },
  note = { visited on 2026-07-20 },
}
Download #
Dataset Substation Equipment can be downloaded in Supervisely format:
As an alternative, it can be downloaded with dataset-tools package:
pip install --upgrade dataset-tools
… using following python code:
import dataset_tools as dtools

dtools.download(dataset='Substation Equipment', dst_dir='~/dataset-ninja/')
Make sure not to overlook the python code example available on the Supervisely Developer Portal. It will give you a clear idea of how to effortlessly work with the downloaded dataset.
The data in original format can be downloaded here.
Disclaimer #
Our gal from the legal dep told us we need to post this:
Dataset Ninja provides visualizations and statistics for some datasets that can be found online and can be downloaded by general audience. Dataset Ninja is not a dataset hosting platform and can only be used for informational purposes. The platform does not claim any rights for the original content, including images, videos, annotations and descriptions. Joint publishing is prohibited.
You take full responsibility when you use datasets presented at Dataset Ninja, as well as other information, including visualizations and statistics we provide. You are in charge of compliance with any dataset license and all other permissions. You are required to navigate datasets homepage and make sure that you can use it. In case of any questions, get in touch with us at hello@datasetninja.com.