Introduction #
The authors of the Sugar Beets 2016 dataset present a substantial agricultural robot dataset focusing on plant classification, as well as localization and mapping, to support the growing interest in agricultural robotics and precision farming. The dataset encompasses various growth stages of plants, which are vital for tasks such as robotic intervention and weed control. The data collection took place over three months in the spring of 2016 on a sugar beet farm near Bonn, Germany, utilizing a commercially available agricultural field robot.
Throughout this period, data was recorded approximately three times a week, commencing at plant emergence and concluding when the field became inaccessible to machinery without damaging the crops. The agricultural robot used was equipped with a four-channel multi-spectral camera, an RGB-D sensor, multiple lidar and global positioning system (GPS) sensors, as well as wheel encoders, all of which were calibrated before data acquisition. Additionally, lidar data of the field captured with a terrestrial laser scanner is included.
The dataset aims to assist researchers in the development of autonomous systems designed for operating in agricultural field environments. It offers real-world data for tasks like plant classification, navigation, and mapping. The data encompasses visual plant information, navigation-related measurements, and intrinsic/extrinsic calibration parameters for all sensors, along with Python-based development tools for data manipulation.
The agricultural robot used for data collection is the BoniRob platform, a versatile robot developed by Bosch DeepField Robotics for precision agriculture applications, including mechanical weed control, herbicide spraying, and plant and soil monitoring. BoniRob boasts four independently steerable wheels, enabling flexible movements on rough terrain.
Regarding the sensor setup, the BoniRob platform features multiple sensors:
- JAI AD-130GE Camera: This multi-spectral vision sensor provides image data in three RGB bands and one near-infrared (NIR) band. The NIR channel is valuable for distinguishing vegetation from soil and other background elements.
- Kinect One (Kinect v2): This time-of-flight camera by Microsoft provides RGB and depth information, with pixels corresponding to create 3D point clouds.
- Velodyne VLP16 Puck: A 3D lidar sensor with 16 laser diodes, offering distance and reflectance measurements. It’s crucial for 3D mapping, localization, and obstacle detection.
- Nippon Signal FX8: This 3D laser range sensor provides distance measurements up to 15 meters, with applications in obstacle avoidance and plant row detection during field navigation.
- Leica RTK GPS: For precise position tracking, employing a Real-Time Kinematic (RTK) GPS system that provides centimeter-level accuracy.
- Ublox GPS: A low-cost GPS receiver that uses Precise Point Positioning (PPP) for position estimation.
The data acquisition campaign spanned two months, covering various growth stages of sugar beet plants. Data was collected on an average of two to three days per week, resulting in approximately 5 TB of uncompressed data. This data includes high-resolution plant images, depth information from the Kinect, 3D point clouds from lidar scanners, GPS positions, and wheel odometry. The collection was strategically timed to capture key variations in the field relevant to weed control and crop management, covering various weather and soil conditions.
Furthermore, the authors have provided ground truth data for plant classification, which includes labeled images distinguishing sugar beets and multiple weed species.
The dataset and its associated sensor setup are expected to support the development of autonomous agricultural robot systems, helping advance precision farming and weed control practices.
Note, that the present dataset contains only the nir and rgb information from JAI camera. Follow to the original page to grab the data from other sensors.
Summary #
Sugar Beets 2016: Agricultural Robot Dataset for Plant Classification, Localization and Mapping on Sugar Beet Fields is a dataset for instance segmentation, semantic segmentation, and object detection tasks. It is used in the agricultural and robotics industries.
The dataset consists of 25429 images with 110084 labeled objects belonging to 2 different classes including sugar beet and weed.
Images in the Sugar Beets 2016 dataset have pixel-level instance segmentation annotations. Due to the nature of the instance segmentation task, it can be automatically transformed into a semantic segmentation (only one mask for every class) or object detection (bounding boxes for every object) tasks. There are 3209 (13% of the total) unlabeled images (i.e. without annotations). There are no pre-defined train/val/test splits in the dataset. Additionally, every image contains information about im_id, location and date. The dataset was released in 2016 by the University of Bonn, Germany and University of Freiburg, Germany.
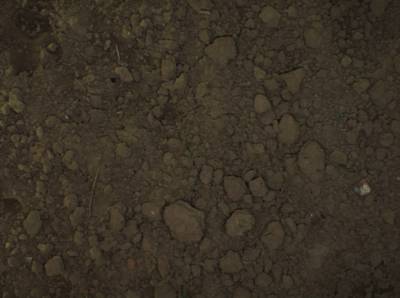
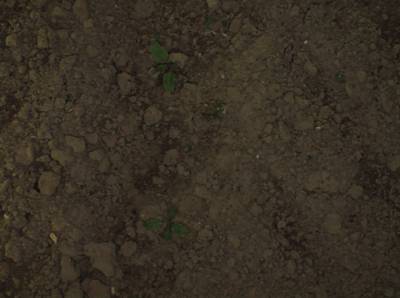
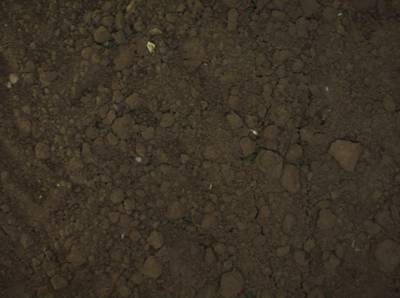
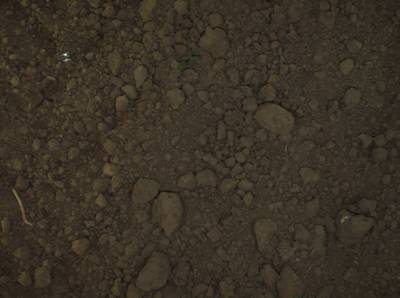
Here is the visualized example grid with animated annotations:
Explore #
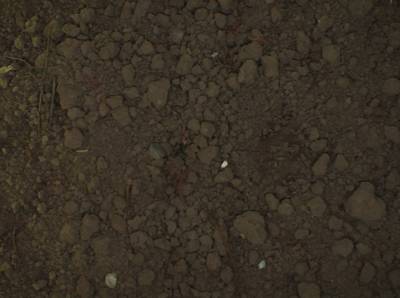
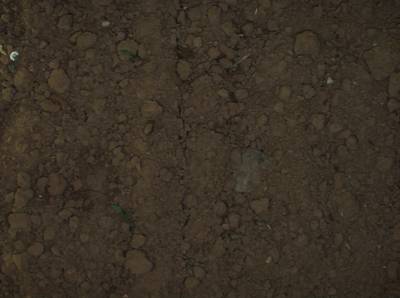
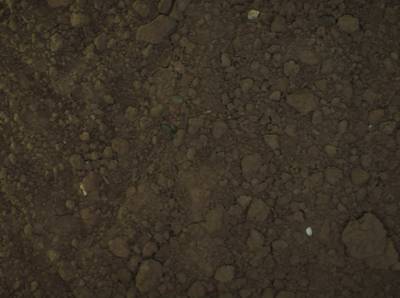
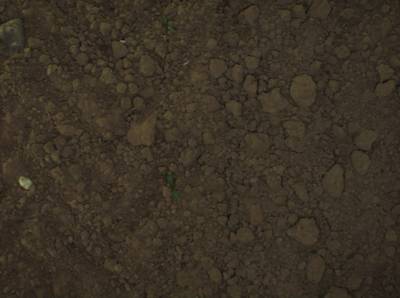
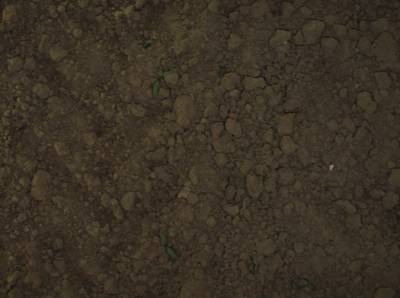
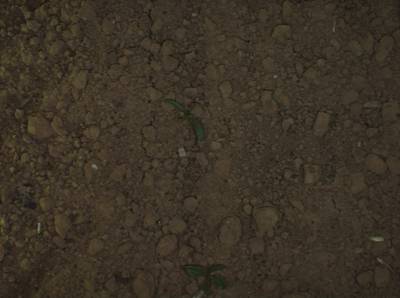
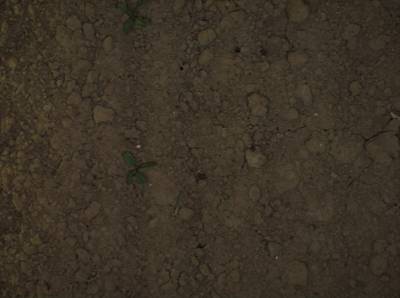
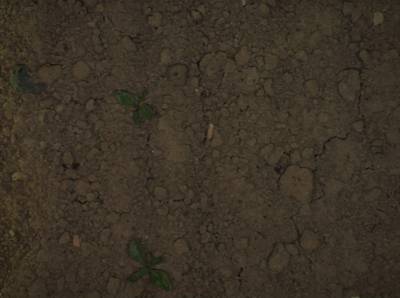
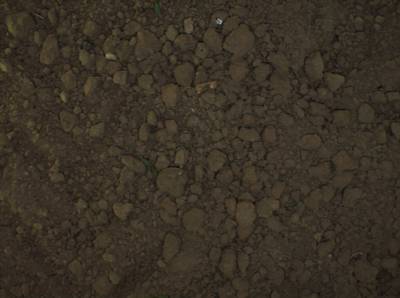
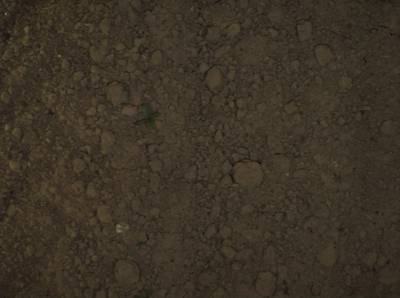
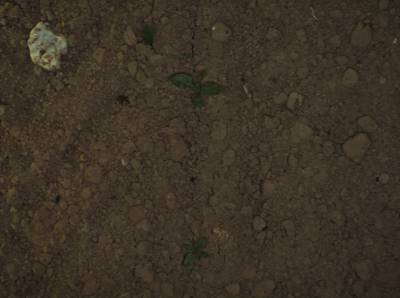
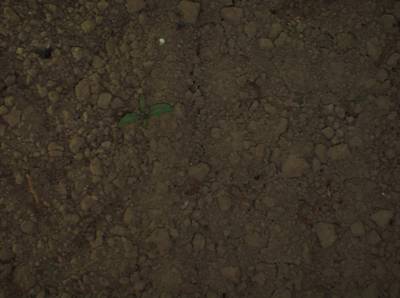
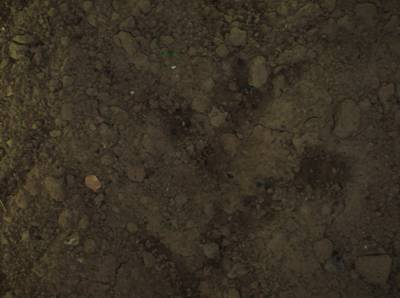
Sugar Beets 2016 dataset has 25429 images. Click on one of the examples below or open "Explore" tool anytime you need to view dataset images with annotations. This tool has extended visualization capabilities like zoom, translation, objects table, custom filters and more. Hover the mouse over the images to hide or show annotations.


























Class balance #
There are 2 annotation classes in the dataset. Find the general statistics and balances for every class in the table below. Click any row to preview images that have labels of the selected class. Sort by column to find the most rare or prevalent classes.
Class ㅤ | Images ㅤ | Objects ㅤ | Count on image average | Area on image average |
|---|---|---|---|---|
sugar beet➔ mask | 22064 | 48998 | 2.22 | 1.34% |
weed➔ mask | 13154 | 61086 | 4.64 | 0.38% |
Co-occurrence matrix #
Co-occurrence matrix is an extremely valuable tool that shows you the images for every pair of classes: how many images have objects of both classes at the same time. If you click any cell, you will see those images. We added the tooltip with an explanation for every cell for your convenience, just hover the mouse over a cell to preview the description.
Images #
Explore every single image in the dataset with respect to the number of annotations of each class it has. Click a row to preview selected image. Sort by any column to find anomalies and edge cases. Use horizontal scroll if the table has many columns for a large number of classes in the dataset.
Object distribution #
Interactive heatmap chart for every class with object distribution shows how many images are in the dataset with a certain number of objects of a specific class. Users can click cell and see the list of all corresponding images.
Class sizes #
The table below gives various size properties of objects for every class. Click a row to see the image with annotations of the selected class. Sort columns to find classes with the smallest or largest objects or understand the size differences between classes.
Class | Object count | Avg area | Max area | Min area | Min height | Min height | Max height | Max height | Avg height | Avg height | Min width | Min width | Max width | Max width |
|---|---|---|---|---|---|---|---|---|---|---|---|---|---|---|
weed mask | 61086 | 0.08% | 39.11% | 0.01% | 4px | 0.41% | 957px | 99.07% | 37px | 3.84% | 6px | 0.46% | 1287px | 99.31% |
sugar beet mask | 48998 | 0.6% | 23.36% | 0.01% | 4px | 0.41% | 957px | 99.07% | 97px | 10.02% | 7px | 0.54% | 934px | 72.07% |
Spatial Heatmap #
The heatmaps below give the spatial distributions of all objects for every class. These visualizations provide insights into the most probable and rare object locations on the image. It helps analyze objects' placements in a dataset.

Objects #
Table contains all 100450 objects. Click a row to preview an image with annotations, and use search or pagination to navigate. Sort columns to find outliers in the dataset.
Object ID ㅤ | Class ㅤ | Image name click row to open | Image size height x width | Height ㅤ | Height ㅤ | Width ㅤ | Width ㅤ | Area ㅤ |
|---|---|---|---|---|---|---|---|---|
1➔ | sugar beet mask | rgb_bonirob_2016-05-09-10-49-56_6_frame214.png | 966 x 1296 | 36px | 3.73% | 18px | 1.39% | 0.04% |
2➔ | sugar beet mask | rgb_bonirob_2016-05-09-10-49-56_6_frame214.png | 966 x 1296 | 173px | 17.91% | 95px | 7.33% | 0.38% |
3➔ | weed mask | rgb_bonirob_2016-05-09-10-49-56_6_frame214.png | 966 x 1296 | 14px | 1.45% | 19px | 1.47% | 0.01% |
4➔ | weed mask | rgb_bonirob_2016-05-09-10-49-56_6_frame214.png | 966 x 1296 | 22px | 2.28% | 16px | 1.23% | 0.01% |
5➔ | weed mask | rgb_bonirob_2016-05-09-10-49-56_6_frame214.png | 966 x 1296 | 12px | 1.24% | 21px | 1.62% | 0.01% |
6➔ | weed mask | rgb_bonirob_2016-05-09-10-49-56_6_frame214.png | 966 x 1296 | 9px | 0.93% | 24px | 1.85% | 0.01% |
7➔ | sugar beet mask | rgb__2016-05-27-10-26-48_5_frame240.png | 966 x 1296 | 234px | 24.22% | 333px | 25.69% | 2.11% |
8➔ | sugar beet mask | rgb__2016-05-27-10-26-48_5_frame240.png | 966 x 1296 | 101px | 10.46% | 314px | 24.23% | 1.41% |
9➔ | sugar beet mask | nir_bonirob_2016-05-17-11-42-26_14_frame102.png | 966 x 1296 | 193px | 19.98% | 361px | 27.85% | 1.67% |
10➔ | sugar beet mask | nir_bonirob_2016-05-17-11-42-26_14_frame102.png | 966 x 1296 | 186px | 19.25% | 129px | 9.95% | 0.74% |
License #
Sugar Beets 2016: Agricultural Robot Dataset for Plant Classification, Localization and Mapping on Sugar Beet Fields is under CC BY-SA 4.0 license.
Citation #
If you make use of the Sugar Beets 2016 data, please cite the following reference:
@article{chebrolu2017ijrr,
  title = {Agricultural robot dataset for plant classification, localization and mapping on sugar beet fields},
  author = {Nived Chebrolu and Philipp Lottes and Alexander Schaefer and Wera Winterhalter and Wolfram Burgard and Cyrill Stachniss},
  journal = {The International Journal of Robotics Research},
  year = {2017}
  doi = {10.1177/0278364917720510},
}
If you are happy with Dataset Ninja and use provided visualizations and tools in your work, please cite us:
@misc{ visualization-tools-for-sugar-beets-dataset,
  title = { Visualization Tools for Sugar Beets 2016 Dataset },
  type = { Computer Vision Tools },
  author = { Dataset Ninja },
  howpublished = { \url{ https://datasetninja.com/sugar-beets-2016 } },
  url = { https://datasetninja.com/sugar-beets-2016 },
  journal = { Dataset Ninja },
  publisher = { Dataset Ninja },
  year = { 2026 },
  month = { feb },
  note = { visited on 2026-02-23 },
}
Download #
Dataset Sugar Beets 2016 can be downloaded in Supervisely format:
As an alternative, it can be downloaded with dataset-tools package:
pip install --upgrade dataset-tools
… using following python code:
import dataset_tools as dtools

dtools.download(dataset='Sugar Beets 2016', dst_dir='~/dataset-ninja/')
Make sure not to overlook the python code example available on the Supervisely Developer Portal. It will give you a clear idea of how to effortlessly work with the downloaded dataset.
The data in original format can be downloaded here.
Disclaimer #
Our gal from the legal dep told us we need to post this:
Dataset Ninja provides visualizations and statistics for some datasets that can be found online and can be downloaded by general audience. Dataset Ninja is not a dataset hosting platform and can only be used for informational purposes. The platform does not claim any rights for the original content, including images, videos, annotations and descriptions. Joint publishing is prohibited.
You take full responsibility when you use datasets presented at Dataset Ninja, as well as other information, including visualizations and statistics we provide. You are in charge of compliance with any dataset license and all other permissions. You are required to navigate datasets homepage and make sure that you can use it. In case of any questions, get in touch with us at hello@datasetninja.com.


