

Introduction #
The large-scale annotated SUIM: Semantic Segmentation of Underwater Imagery dataset has a general-purpose application in robotics. It contains over 1500 images with pixel annotations for eight object categories: waterbody_background (BW), human_divers (HD), aquatic_plants_and sea-grass, wrecks_and_ruins (WR), robots (RO), reefs_and_invertebrates (RI), fish_and_vertebrates (FV), sea-floor_and_rocks (SR). The authors use 3-bit binary RGB colors to represent these eight object categories in the image space.
According to the authors, for visually-guided underwater robots, the existing solutions for semantic segmentation and scene parsing are significantly less advanced. The practicalities and limitations are twofold. The existing large-scale annotated data and relevant methodologies are tied to specific applications such as coral reef classification and coverage estimation, fish detection, and segmentation, etc. Other datasets contain either binary annotations for salient foreground pixels or semantic labels for very few object categories (e.g., seagrass, rocks/sand, etc.).
The SUIM dataset has 1525 RGB images for training and validation; another 110 test images are provided for benchmark evaluation of semantic segmentation models. The images are of various spatial resolutions, e.g., 1906×1080, 1280×720, 640×480, and 256×256. These images are carefully chosen from a large pool of samples collected during oceanic explorations and human-robot cooperative experiments in several locations of various water types. We also utilize a few images from large-scale datasets named EUVP, USR-248, and UFO-120, which authors previously proposed for underwater image enhancement and super-resolution problems. The images are chosen to accommodate a diverse set of natural underwater scenes and various setups for human-robot collaborative experiments.

This figure demonstrates the population of each object category, their pairwise correlations, and the distributions of RGB channel intensity values in the SUIM dataset.
All images of the SUIM dataset are pixel-annotated by seven human participants. Authors followed the guidelines discussed in The Ocean Animal Encyclopedia and “Marine Species Identification Portal for classifying potentially confusing objects of interest such as plants/reefs, vertebrates/invertebrates, etc.
Please note, that some masks include bad data. Check full list at GitHub page
 Homepage
 Research Paper
 GitHubKaggleProject Page
Summary #
SUIM: Semantic Segmentation of Underwater Imagery is a dataset for a semantic segmentation task. It is used in the environmental research, and in the robotics industry.
The dataset consists of 1550 images with 5000 labeled objects belonging to 8 different classes including waterbody_background, fish_and_vertebrates, reefs_and_invertebrates, and other: sea-floor_and_rocks, human_divers, wrecks_and_ruins, aquatic_plants_and sea-grass, and robots.
Images in the SUIM dataset have pixel-level semantic segmentation annotations. All images are labeled (i.e. with annotations). There are 2 splits in the dataset: train_val (1440 images) and test (110 images). The dataset was released in 2020 by the University of Minnesota.
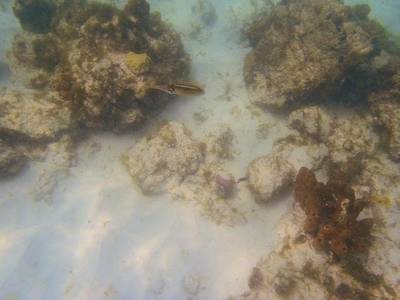
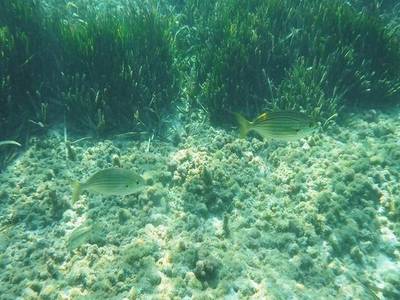
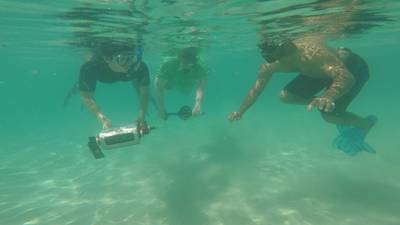
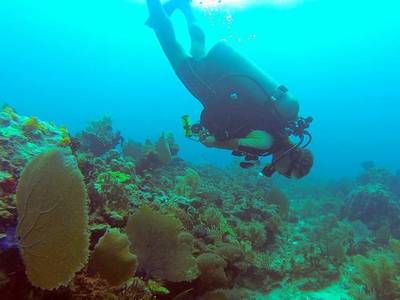
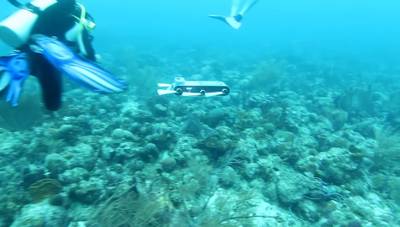
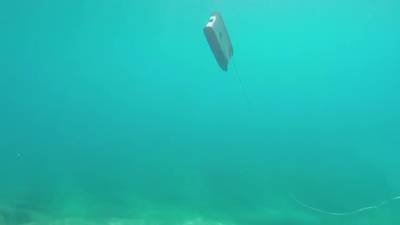
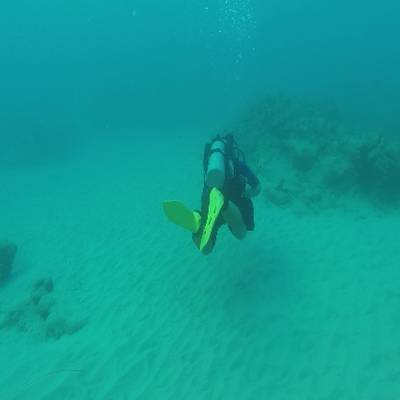
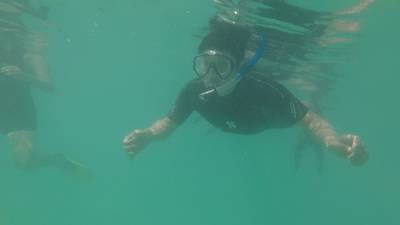
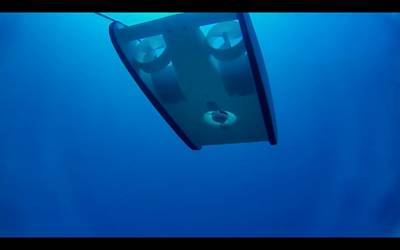
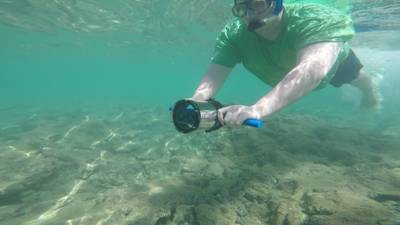
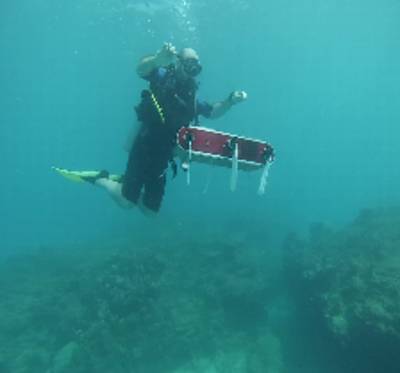
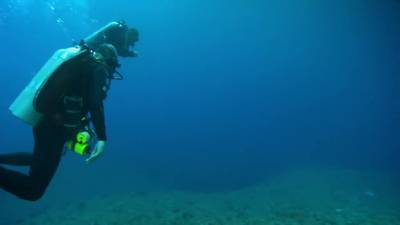
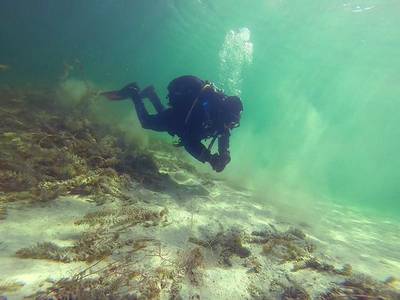
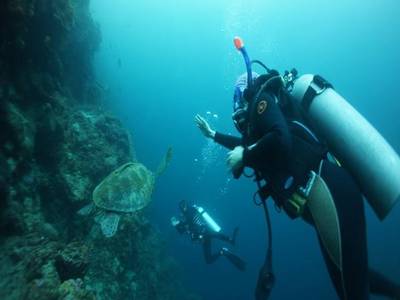
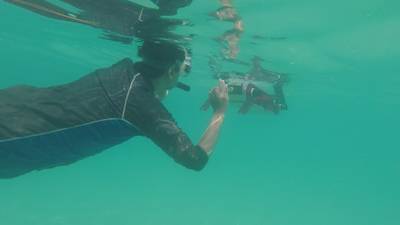
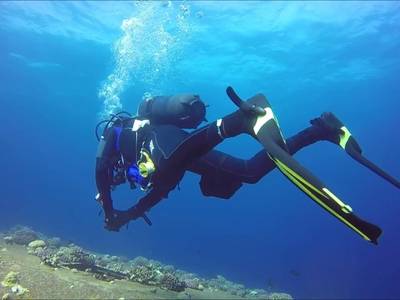
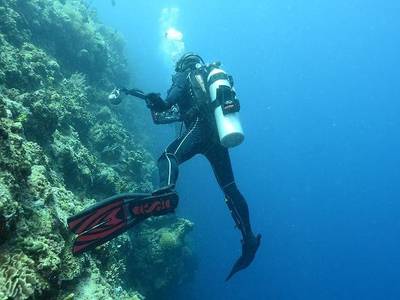
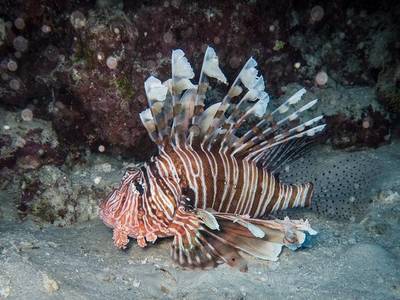
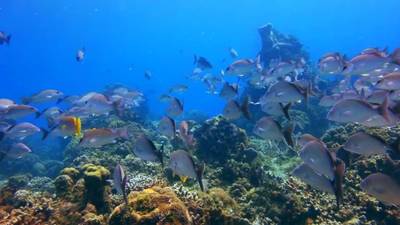
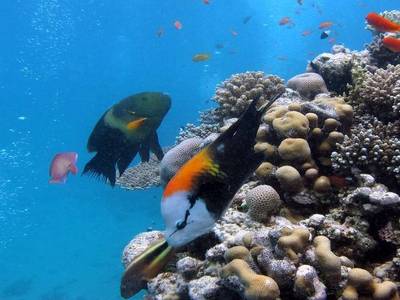
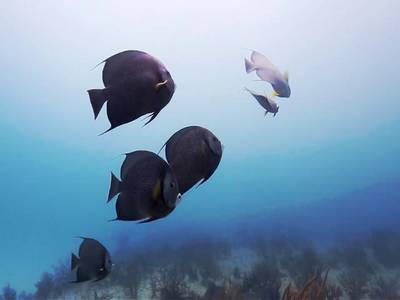
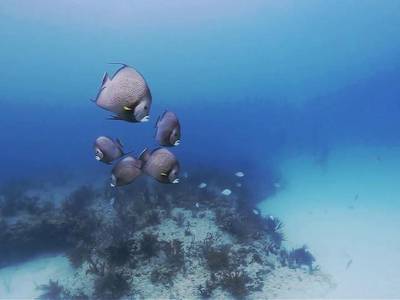
Here are the visualized examples for the classes:
Explore #
SUIM dataset has 1550 images. Click on one of the examples below or open "Explore" tool anytime you need to view dataset images with annotations. This tool has extended visualization capabilities like zoom, translation, objects table, custom filters and more. Hover the mouse over the images to hide or show annotations.


Class balance #
There are 8 annotation classes in the dataset. Find the general statistics and balances for every class in the table below. Click any row to preview images that have labels of the selected class. Sort by column to find the most rare or prevalent classes.

Class ㅤ | Images ㅤ | Objects ㅤ | Count on image average | Area on image average |
|---|---|---|---|---|
waterbody_background➔ mask | 1288 | 1288 | 1 | 37.54% |
fish_and_vertebrates➔ mask | 1030 | 1030 | 1 | 11.79% |
reefs_and_invertebrates➔ mask | 1028 | 1028 | 1 | 52.31% |
sea-floor_and_rocks➔ mask | 635 | 635 | 1 | 34.77% |
human_divers➔ mask | 405 | 405 | 1 | 7.54% |
wrecks_and_ruins➔ mask | 275 | 275 | 1 | 41.85% |
aquatic_plants_and sea-grass➔ mask | 239 | 239 | 1 | 15.12% |
robots➔ mask | 100 | 100 | 1 | 4.74% |
Co-occurrence matrix #
Co-occurrence matrix is an extremely valuable tool that shows you the images for every pair of classes: how many images have objects of both classes at the same time. If you click any cell, you will see those images. We added the tooltip with an explanation for every cell for your convenience, just hover the mouse over a cell to preview the description.
Images #
Explore every single image in the dataset with respect to the number of annotations of each class it has. Click a row to preview selected image. Sort by any column to find anomalies and edge cases. Use horizontal scroll if the table has many columns for a large number of classes in the dataset.
Object distribution #
Interactive heatmap chart for every class with object distribution shows how many images are in the dataset with a certain number of objects of a specific class. Users can click cell and see the list of all corresponding images.
Class sizes #
The table below gives various size properties of objects for every class. Click a row to see the image with annotations of the selected class. Sort columns to find classes with the smallest or largest objects or understand the size differences between classes.
Class | Object count | Avg area | Max area | Min area | Min height | Min height | Max height | Max height | Avg height | Avg height | Min width | Min width | Max width | Max width |
|---|---|---|---|---|---|---|---|---|---|---|---|---|---|---|
waterbody_background mask | 1288 | 37.54% | 98.22% | 0% | 1px | 0.21% | 1080px | 100% | 365px | 72.94% | 1px | 0.16% | 1906px | 100% |
fish_and_vertebrates mask | 1030 | 11.79% | 85.29% | 0.02% | 8px | 1.48% | 720px | 100% | 298px | 60.87% | 8px | 1.25% | 1280px | 100% |
reefs_and_invertebrates mask | 1028 | 52.31% | 98.05% | 0% | 5px | 1.04% | 1080px | 100% | 408px | 82.62% | 1px | 0.16% | 1906px | 100% |
sea-floor_and_rocks mask | 635 | 34.77% | 97.81% | 0.02% | 12px | 2.5% | 1072px | 100% | 332px | 66.85% | 50px | 7.81% | 1906px | 100% |
human_divers mask | 405 | 7.54% | 45.36% | 0.19% | 23px | 4.79% | 772px | 100% | 240px | 45.57% | 14px | 2.19% | 1220px | 100% |
wrecks_and_ruins mask | 275 | 41.85% | 94.73% | 1.77% | 58px | 12.08% | 720px | 100% | 411px | 84.13% | 108px | 16.88% | 1280px | 100% |
aquatic_plants_and sea-grass mask | 239 | 15.12% | 81.45% | 0.01% | 5px | 1.04% | 1032px | 100% | 282px | 56.51% | 9px | 1.41% | 1422px | 100% |
robots mask | 100 | 4.74% | 28.74% | 0.04% | 20px | 3.7% | 720px | 100% | 195px | 30.29% | 21px | 2.19% | 831px | 94.25% |
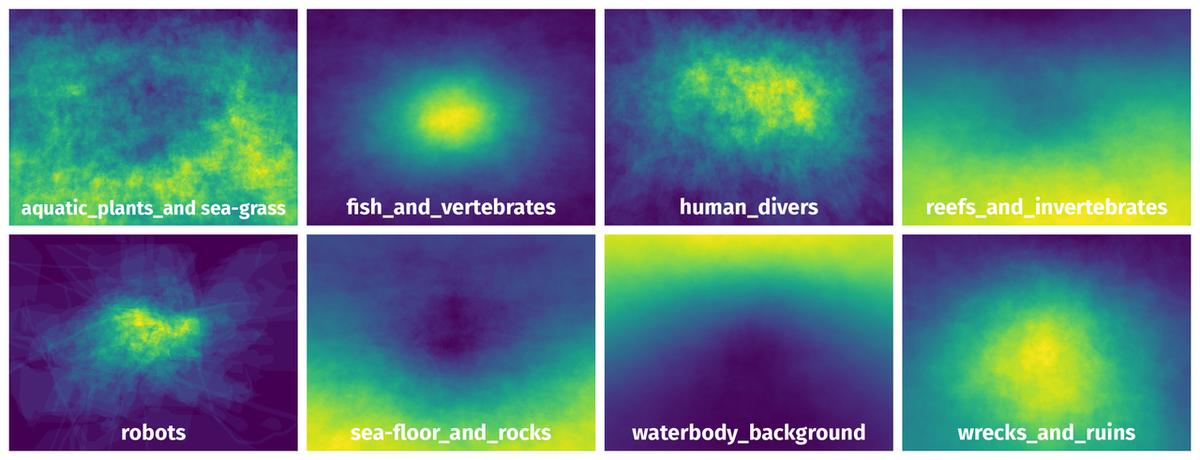
Spatial Heatmap #
The heatmaps below give the spatial distributions of all objects for every class. These visualizations provide insights into the most probable and rare object locations on the image. It helps analyze objects' placements in a dataset.
Objects #
Table contains all 5000 objects. Click a row to preview an image with annotations, and use search or pagination to navigate. Sort columns to find outliers in the dataset.
Object ID ㅤ | Class ㅤ | Image name click row to open | Image size height x width | Height ㅤ | Height ㅤ | Width ㅤ | Width ㅤ | Area ㅤ |
|---|---|---|---|---|---|---|---|---|
1➔ | waterbody_background mask | w_r_30_.jpg | 480 x 640 | 358px | 74.58% | 640px | 100% | 48.86% |
2➔ | wrecks_and_ruins mask | w_r_30_.jpg | 480 x 640 | 480px | 100% | 499px | 77.97% | 26.45% |
3➔ | fish_and_vertebrates mask | w_r_30_.jpg | 480 x 640 | 154px | 32.08% | 238px | 37.19% | 4.91% |
4➔ | sea-floor_and_rocks mask | w_r_30_.jpg | 480 x 640 | 149px | 31.04% | 640px | 100% | 19.78% |
5➔ | waterbody_background mask | d_r_386_.jpg | 540 x 960 | 321px | 59.44% | 960px | 100% | 33.49% |
6➔ | human_divers mask | d_r_386_.jpg | 540 x 960 | 315px | 58.33% | 449px | 46.77% | 15.63% |
7➔ | robots mask | d_r_386_.jpg | 540 x 960 | 93px | 17.22% | 229px | 23.85% | 1.84% |
8➔ | sea-floor_and_rocks mask | d_r_386_.jpg | 540 x 960 | 304px | 56.3% | 960px | 100% | 49.03% |
9➔ | waterbody_background mask | f_r_1059_.jpg | 480 x 640 | 367px | 76.46% | 640px | 100% | 53.5% |
10➔ | human_divers mask | f_r_1059_.jpg | 480 x 640 | 65px | 13.54% | 118px | 18.44% | 0.84% |
License #
SUIM: Semantic Segmentation of Underwater Imagery is under MIT license.
Citation #
If you make use of the SUIM data, please cite the following reference:
@inproceedings{islam2020suim,
  title={{Semantic Segmentation of Underwater Imagery: Dataset and Benchmark}},
  author={Islam, Md Jahidul and Edge, Chelsey and Xiao, Yuyang and Luo, Peigen and Mehtaz, Muntaqim and Morse, Christopher and Enan, Sadman Sakib and Sattar, Junaed},
  booktitle={IEEE/RSJ International Conference on Intelligent Robots and Systems (IROS)},
  year={2020},
  organization={IEEE/RSJ}
}
If you are happy with Dataset Ninja and use provided visualizations and tools in your work, please cite us:
@misc{ visualization-tools-for-suim-dataset,
  title = { Visualization Tools for SUIM Dataset },
  type = { Computer Vision Tools },
  author = { Dataset Ninja },
  howpublished = { \url{ https://datasetninja.com/suim } },
  url = { https://datasetninja.com/suim },
  journal = { Dataset Ninja },
  publisher = { Dataset Ninja },
  year = { 2026 },
  month = { jul },
  note = { visited on 2026-07-16 },
}
Download #
Dataset SUIM can be downloaded in Supervisely format:
As an alternative, it can be downloaded with dataset-tools package:
pip install --upgrade dataset-tools
… using following python code:
import dataset_tools as dtools

dtools.download(dataset='SUIM', dst_dir='~/dataset-ninja/')
Make sure not to overlook the python code example available on the Supervisely Developer Portal. It will give you a clear idea of how to effortlessly work with the downloaded dataset.
Disclaimer #
Our gal from the legal dep told us we need to post this:
Dataset Ninja provides visualizations and statistics for some datasets that can be found online and can be downloaded by general audience. Dataset Ninja is not a dataset hosting platform and can only be used for informational purposes. The platform does not claim any rights for the original content, including images, videos, annotations and descriptions. Joint publishing is prohibited.
You take full responsibility when you use datasets presented at Dataset Ninja, as well as other information, including visualizations and statistics we provide. You are in charge of compliance with any dataset license and all other permissions. You are required to navigate datasets homepage and make sure that you can use it. In case of any questions, get in touch with us at hello@datasetninja.com.