

Introduction #
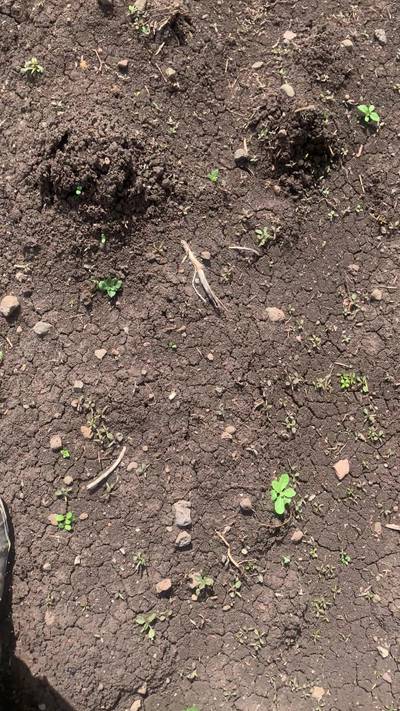
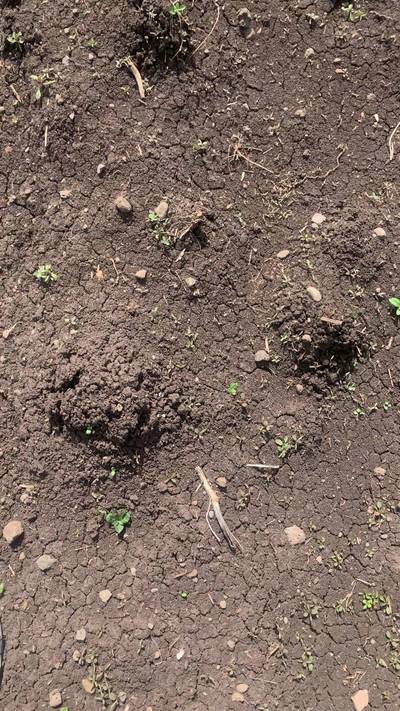
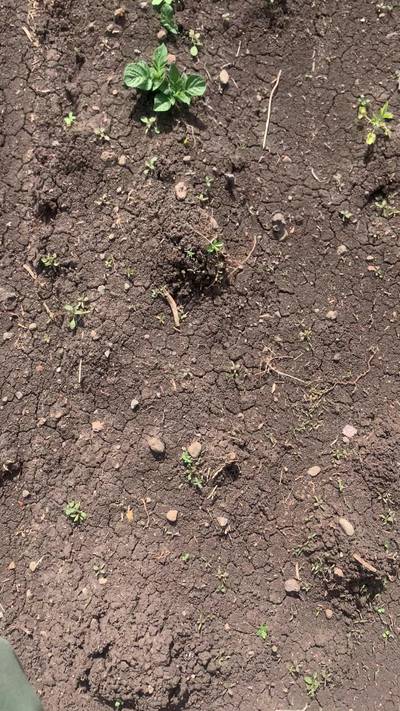
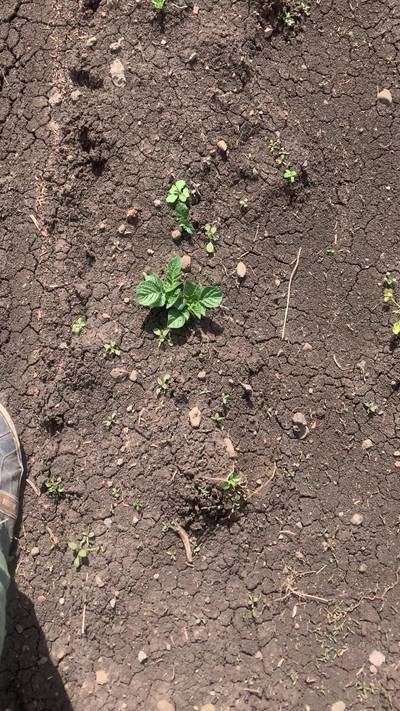
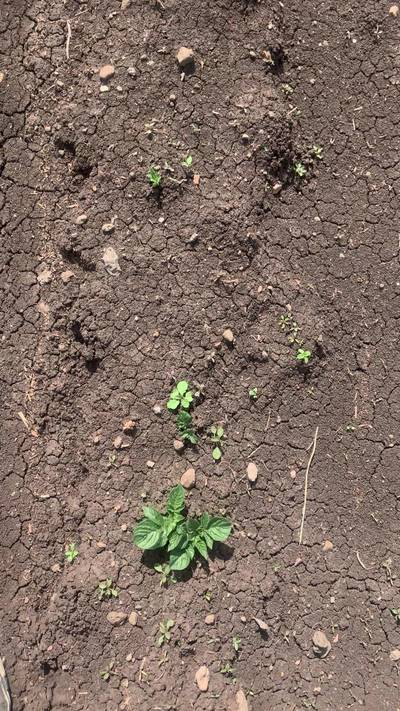
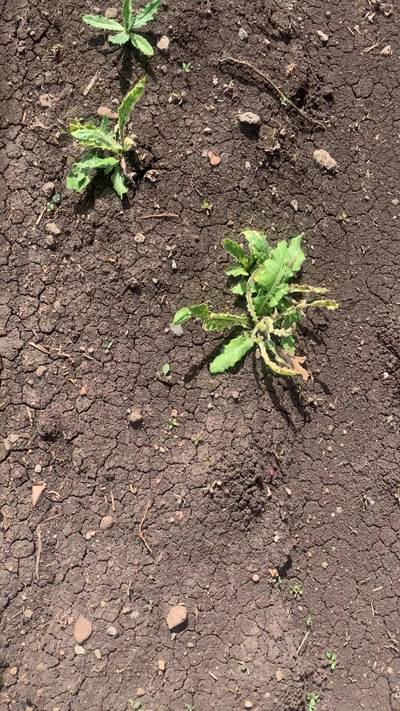
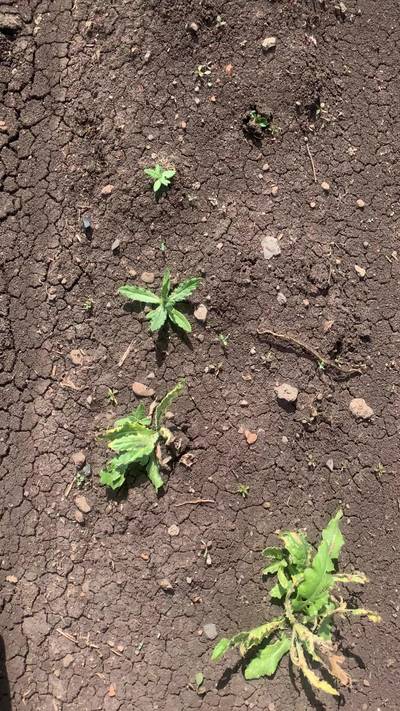
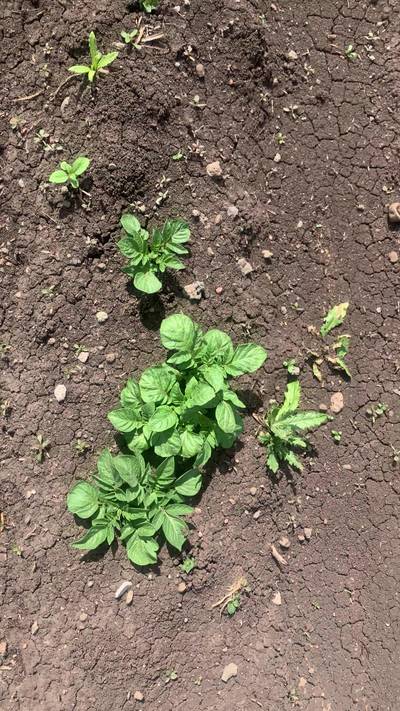
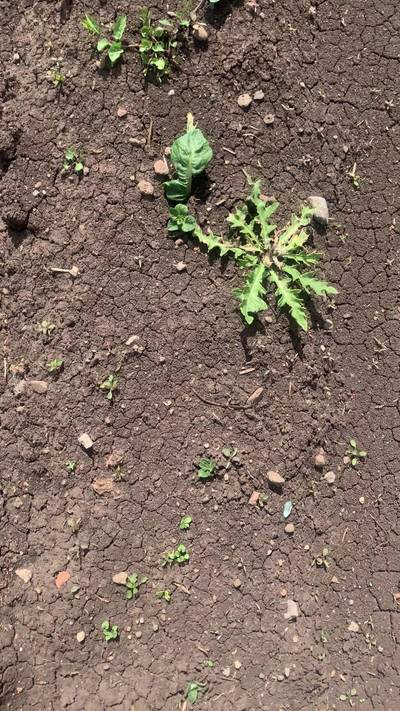
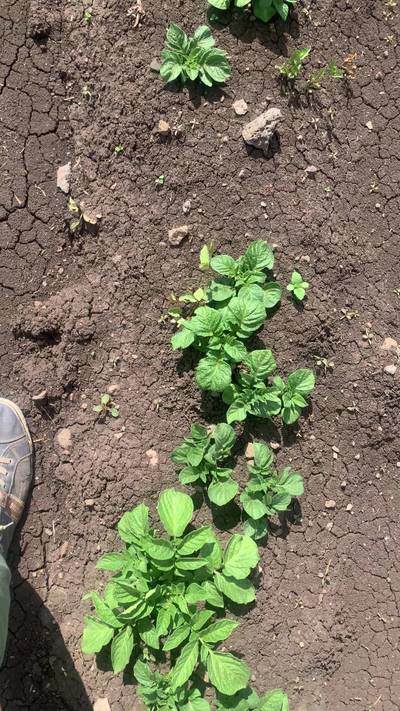
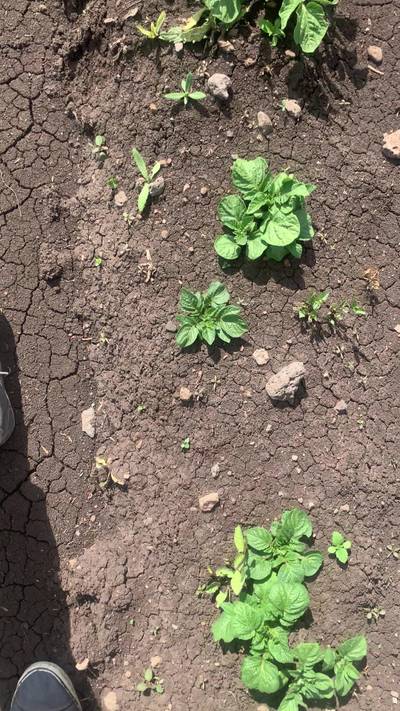
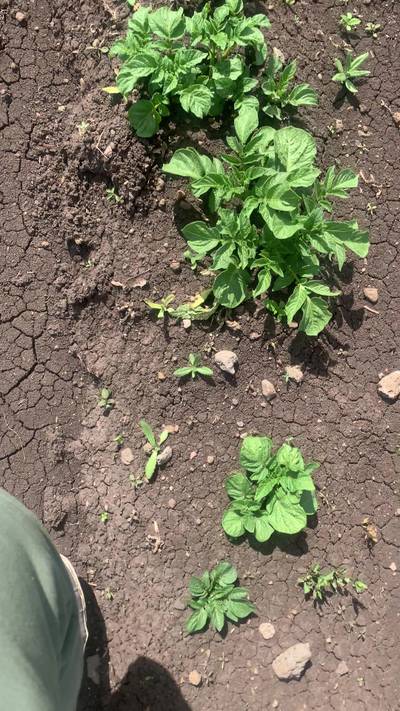
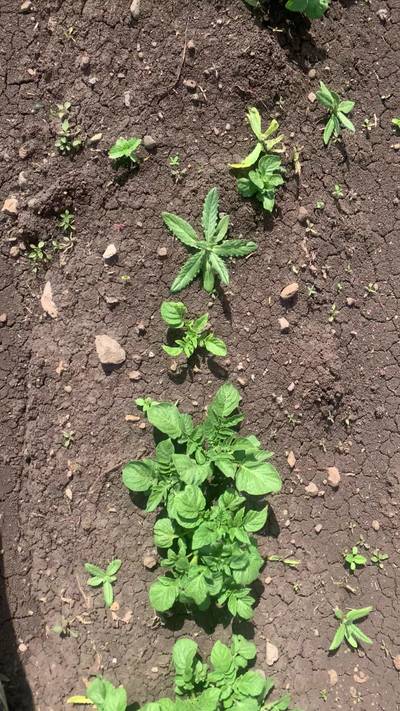
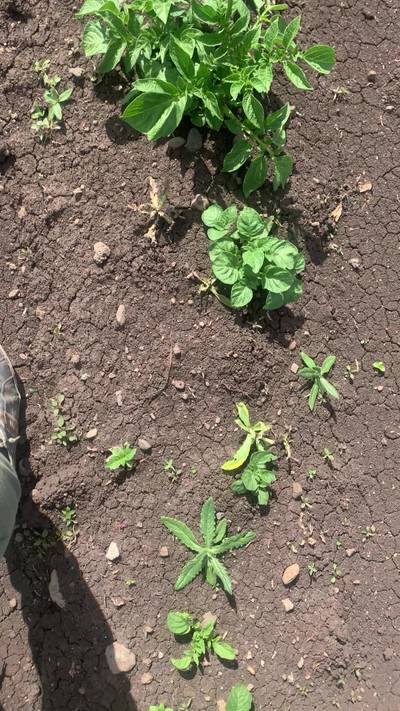
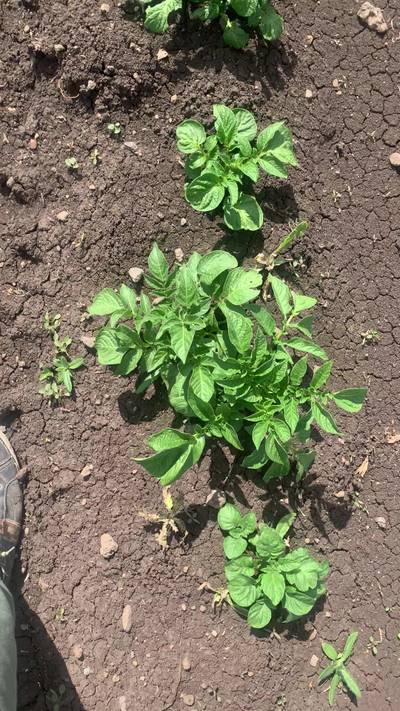
The Supervisely Potatoes Dataset for Crops and Weed Segmentation is tailored for the agricultural task of crop recognition. It encompasses the visual data of potato leaves (crop) and various types of weed objects. More than just a resource for training models, this dataset serves as a robust benchmark for evaluating the efficiency of pre-trained models.
The source videos were meticulously recorded in June 2023 in Alastani, a province in the country of Georgia. The footage was captured at a precise 90-degree angle using an iPhone 11 Plus camera, boasting a resolution of 3840x2160 and a smooth frame rate of 30 FPS.
To enhance usability within the Supervisely platform, the original videos underwent a transformation into an annotated collection of individual images. This conversion not only facilitates seamless integration but also streamlines the analysis process within the realm of agricultural model development and assessment.
The satellite Image of the potato field. Alastani, Georgia - 41°32’59.2"N 43°24’17.2"E
 Blog Post
Summary #
Supervisely Potatoes Dataset for Crops and Weed Segmentation is a dataset for a weakly supervised learning task. Possible applications of the dataset could be in the agricultural industry.
The dataset consists of 1055 images with 3971 labeled objects belonging to 2 different classes including crop and weed.
Images in the Supervisely Potatoes dataset have pixel-level instance segmentation annotations. Due to the nature of the instance segmentation task, it can be automatically transformed into a semantic segmentation (only one mask for every class) or object detection (bounding boxes for every object) tasks. There are 82 (8% of the total) unlabeled images (i.e. without annotations). There is 1 split in the dataset: train (1055 images). Alternatively, the dataset could be split into 3 field IDs: 113 (935 images), 114 (60 images), and 116 (60 images). The dataset was released in 2023 by the Supervisely.
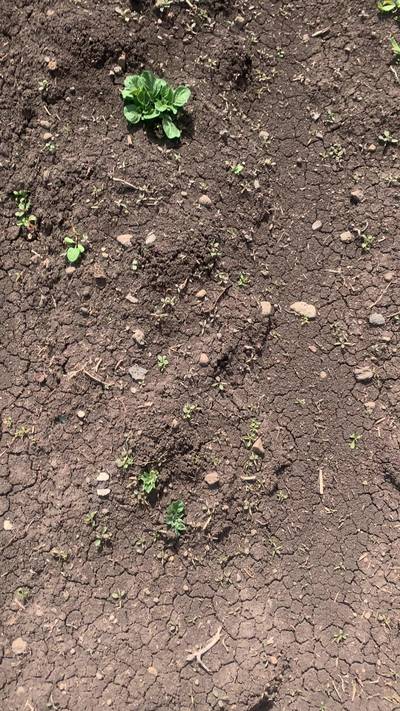
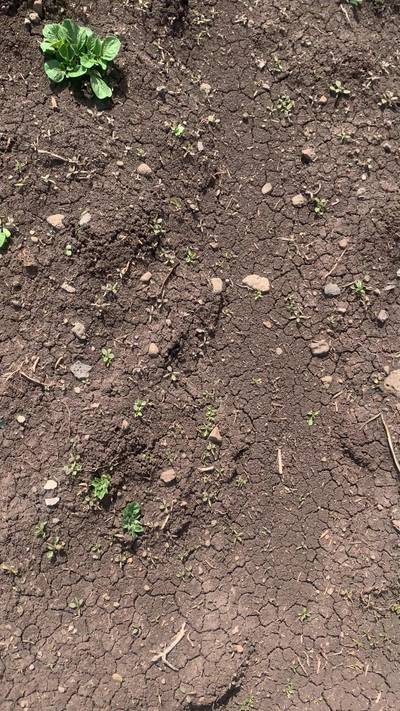
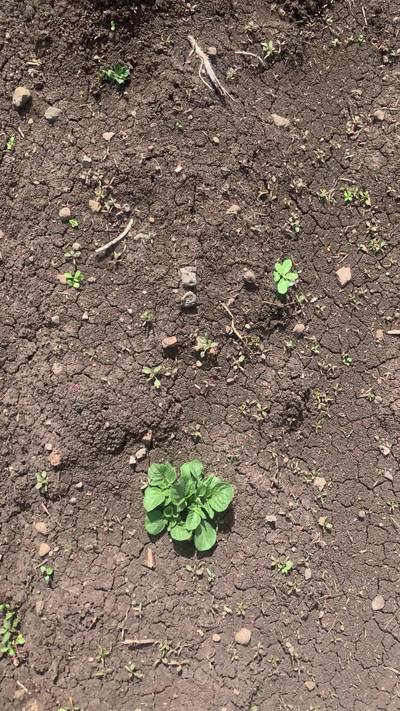
Here is the visualized example grid with animated annotations:
Explore #
Supervisely Potatoes dataset has 1055 images. Click on one of the examples below or open "Explore" tool anytime you need to view dataset images with annotations. This tool has extended visualization capabilities like zoom, translation, objects table, custom filters and more. Hover the mouse over the images to hide or show annotations.


Class balance #
There are 2 annotation classes in the dataset. Find the general statistics and balances for every class in the table below. Click any row to preview images that have labels of the selected class. Sort by column to find the most rare or prevalent classes.

Class ㅤ | Images ㅤ | Objects ㅤ | Count on image average | Area on image average |
|---|---|---|---|---|
crop➔ mask | 931 | 2604 | 2.8 | 4.81% |
weed➔ mask | 484 | 1367 | 2.82 | 1.47% |
Co-occurrence matrix #
Co-occurrence matrix is an extremely valuable tool that shows you the images for every pair of classes: how many images have objects of both classes at the same time. If you click any cell, you will see those images. We added the tooltip with an explanation for every cell for your convenience, just hover the mouse over a cell to preview the description.
Images #
Explore every single image in the dataset with respect to the number of annotations of each class it has. Click a row to preview selected image. Sort by any column to find anomalies and edge cases. Use horizontal scroll if the table has many columns for a large number of classes in the dataset.
Object distribution #
Interactive heatmap chart for every class with object distribution shows how many images are in the dataset with a certain number of objects of a specific class. Users can click cell and see the list of all corresponding images.
Class sizes #
The table below gives various size properties of objects for every class. Click a row to see the image with annotations of the selected class. Sort columns to find classes with the smallest or largest objects or understand the size differences between classes.
Class | Object count | Avg area | Max area | Min area | Min height | Min height | Max height | Max height | Avg height | Avg height | Min width | Min width | Max width | Max width |
|---|---|---|---|---|---|---|---|---|---|---|---|---|---|---|
crop mask | 2604 | 1.72% | 17.18% | 0.02% | 56px | 1.46% | 2192px | 57.08% | 451px | 11.75% | 47px | 2.18% | 1452px | 67.22% |
weed mask | 1367 | 0.52% | 8.43% | 0.01% | 50px | 1.3% | 1427px | 37.16% | 327px | 8.52% | 36px | 1.67% | 1394px | 64.54% |
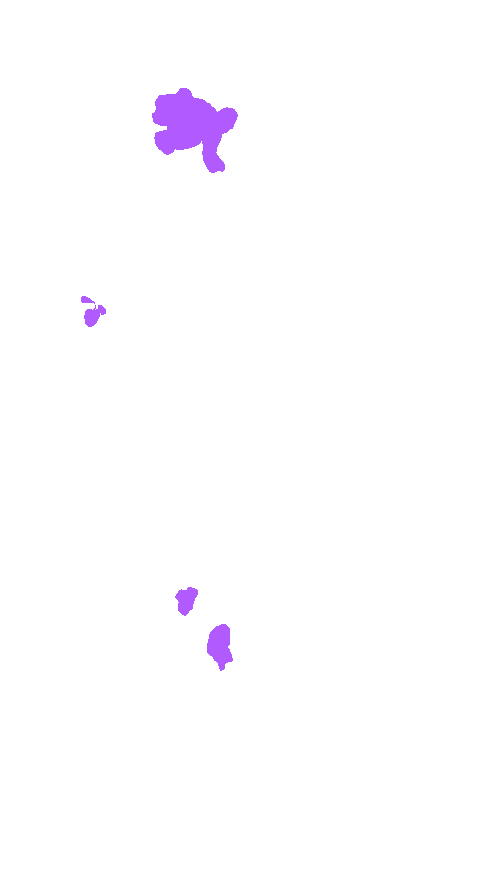
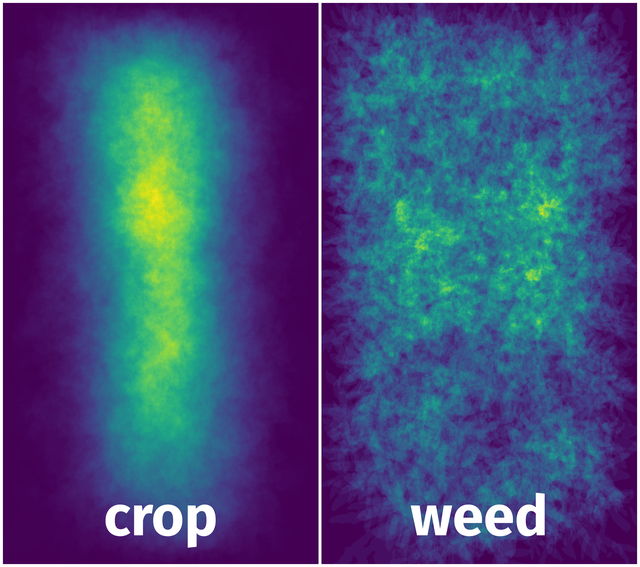
Spatial Heatmap #
The heatmaps below give the spatial distributions of all objects for every class. These visualizations provide insights into the most probable and rare object locations on the image. It helps analyze objects' placements in a dataset.
Objects #
Table contains all 3971 objects. Click a row to preview an image with annotations, and use search or pagination to navigate. Sort columns to find outliers in the dataset.
Object ID ㅤ | Class ㅤ | Image name click row to open | Image size height x width | Height ㅤ | Height ㅤ | Width ㅤ | Width ㅤ | Area ㅤ |
|---|---|---|---|---|---|---|---|---|
1➔ | crop mask | 20824498_frame_000855.jpg | 3840 x 2160 | 203px | 5.29% | 191px | 8.84% | 0.28% |
2➔ | crop mask | 20918823_frame_001122.jpg | 3840 x 2160 | 544px | 14.17% | 518px | 23.98% | 1.65% |
3➔ | crop mask | 20918823_frame_001122.jpg | 3840 x 2160 | 522px | 13.59% | 422px | 19.54% | 1.71% |
4➔ | crop mask | 20824007_frame_000525.jpg | 3840 x 2160 | 417px | 10.86% | 411px | 19.03% | 1.2% |
5➔ | weed mask | 20824007_frame_000525.jpg | 3840 x 2160 | 243px | 6.33% | 180px | 8.33% | 0.24% |
6➔ | weed mask | 20824007_frame_000525.jpg | 3840 x 2160 | 221px | 5.76% | 176px | 8.15% | 0.18% |
7➔ | crop mask | 20824007_frame_000525.jpg | 3840 x 2160 | 482px | 12.55% | 365px | 16.9% | 1.08% |
8➔ | crop mask | 20918823_frame_014926.jpg | 3840 x 2160 | 633px | 16.48% | 558px | 25.83% | 1.99% |
9➔ | crop mask | 20918823_frame_014926.jpg | 3840 x 2160 | 466px | 12.14% | 414px | 19.17% | 1.23% |
10➔ | crop mask | 20918823_frame_014926.jpg | 3840 x 2160 | 371px | 9.66% | 361px | 16.71% | 0.82% |
License #
Supervisely Potatoes Dataset for Crops and Weed Segmentation is under CC BY-NC-SA 4.0 license.
Citation #
If you make use of the Supervisely Potatoes data, please cite the following reference:
@dataset{Supervisely Potatoes,
  author={Supervisely},
  title={Supervisely Potatoes Dataset for Crops and Weed Segmentation},
  year={2023},
  url={https://supervisely.com/blog/train-a-model-with-62-labeled-images-hrda-semi-supervised/}
}
If you are happy with Dataset Ninja and use provided visualizations and tools in your work, please cite us:
@misc{ visualization-tools-for-supervisely-potatoes-dataset,
  title = { Visualization Tools for Supervisely Potatoes Dataset },
  type = { Computer Vision Tools },
  author = { Dataset Ninja },
  howpublished = { \url{ https://datasetninja.com/supervisely-potatoes } },
  url = { https://datasetninja.com/supervisely-potatoes },
  journal = { Dataset Ninja },
  publisher = { Dataset Ninja },
  year = { 2026 },
  month = { jul },
  note = { visited on 2026-07-23 },
}
Download #
Dataset Supervisely Potatoes can be downloaded in Supervisely format:
As an alternative, it can be downloaded with dataset-tools package:
pip install --upgrade dataset-tools
… using following python code:
import dataset_tools as dtools

dtools.download(dataset='Supervisely Potatoes', dst_dir='~/dataset-ninja/')
Make sure not to overlook the python code example available on the Supervisely Developer Portal. It will give you a clear idea of how to effortlessly work with the downloaded dataset.
The data in original format can be downloaded here.
Disclaimer #
Our gal from the legal dep told us we need to post this:
Dataset Ninja provides visualizations and statistics for some datasets that can be found online and can be downloaded by general audience. Dataset Ninja is not a dataset hosting platform and can only be used for informational purposes. The platform does not claim any rights for the original content, including images, videos, annotations and descriptions. Joint publishing is prohibited.
You take full responsibility when you use datasets presented at Dataset Ninja, as well as other information, including visualizations and statistics we provide. You are in charge of compliance with any dataset license and all other permissions. You are required to navigate datasets homepage and make sure that you can use it. In case of any questions, get in touch with us at hello@datasetninja.com.