Introduction #
The SISVSE: Surgical Scene Segmentation Using Semantic Image Synthesis with a Virtual Surgery Environment dataset addresses the shortage of public data in surgical vision research. It combines real and synthetic data for instance and semantic segmentation model training, with synthetic data improving model performance for low-performance classes. Authors also implement class-balanced frame sampling to handle class imbalance and reduce redundant frames and data labeling costs, making this dataset valuable not only for gastrectomy but also for other minimally invasive surgeries.
Recent advances in deep neural network architectures and learning large-scale datasets have significantly improved model performance. Because of that, many large-scale datasets have been published for computer vision applications such as natural scene recognition or autonomous driving, remote sensing, computer-assisted design, medical imaging, etc. Unlike other computer vision applications that have abundant datasets, surgical vision research always has had a problem of public data shortages. Fortunately, several surgical vision datasets were published and encouraged the research. However, building those large-scale surgical vision datasets costs more than common datasets due to the rareness of surgery videos and the difficulties of annotations. Because of that, several researchers conducted image synthesis research for surgical vision to decrease data generation costs. However, the previous works had limited results for real-world applications with simple simulators, including only a few organs and surgical tools and outdated segmentation models to evaluate the quality of the image. In addition, none of the research provided real image data, including annotations, which is necessary for open research. Therefore, the authors release a new Surgical Scene Segmentation in Robotic Gastrectomy with Real and Synthetic Data dataset to encourage further study and provide novel methods with extensive experiments for surgical scene segmentation using semantic image synthesis with a more complex virtual surgery environment.
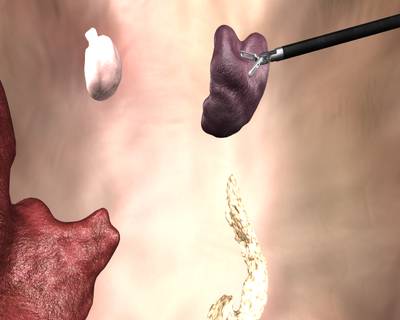
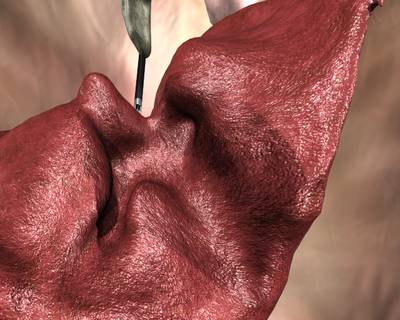
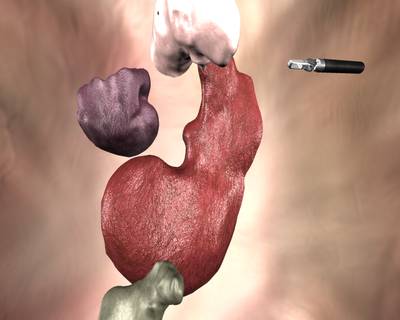
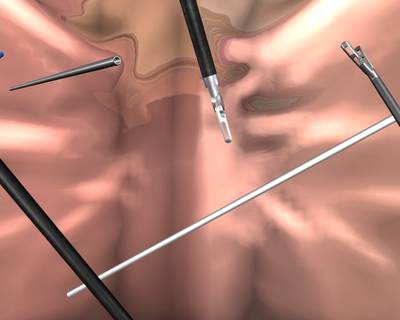
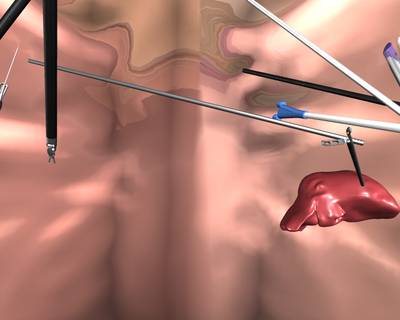
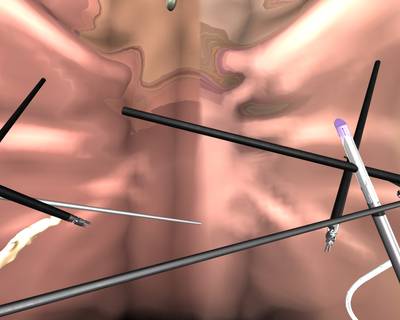
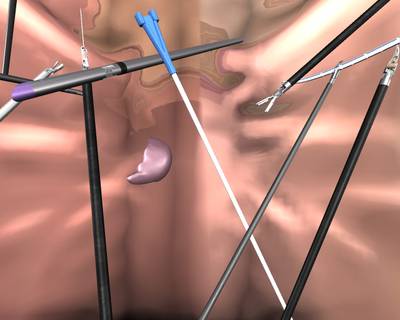
The authors compare state-of-the-art instance and semantic segmentation models trained with real data and synthetic data. First, the authors created three cross-validation datasets considering demographic and clinical information from 40 cases of real surgical videos of distal gastrectomy for gastric cancer with the da Vinci Surgical System (dVSS). The authors annotated six organs and 14 surgical instruments divided into 24 instrument parts according to head, wrist, and body structures commonly appearing during the surgery. The authors also introduced a class-balanced frame sampling to suppress many redundant classes and to reduce unnecessary data labeling costs. Second, the authors created a virtual surgery environment in the Unity engine with 3D models of five organs from real patient CT data and 11 surgical instruments from actual measurements of the da Vinci surgical instruments. The environment provides cost-free pixel-level annotations enabling segmentation. Third, the authors used state-of-the-art semantic image synthesis models to convert the authors’ 3D simulator photo-realistically. Lastly, they created ten combinations of real and synthetic data for each cross-validation set to train/evaluate segmentation models. The analysis showed interesting results: synthetic data improved low-performance classes and was very effective for Mask AP improvement while improving the segmentation models overall. Finally, the authors release the first large-scale semantic/instance segmentation dataset, including both real and synthetic data that can be used for visual object recognition and image-to-image translation research for gastrectomy with the dVSS. However, their method is not only limited to gastrectomy but can be generalized into all minimally invasive surgeries such as laparoscopic and robotic surgery.

The schematic diagram of surgical scene segmentation using semantic image synthesis with a virtual surgery environment. SPADE and SEAN translate synthetic data generated from a virtual surgery environment photo-realistically and are used for training surgical scene segmentation models.
The contribution of the authors’ work is summarized as follows:
- They release the first large-scale instance and semantic segmentation dataset, including both real and synthetic data that can be used for visual object recognition and image-to-image translation research for gastrectomy with the dVSS.
- They systematically analyzed surgical scene segmentation using semantic image synthesis with state-of-the-art models with ten combinations of real and synthetic data.
- They found interesting results that synthetic data improved low-performance classes and was very effective for Mask AP improvement while improving the segmentation models overall.
The authors collected 40 cases of real surgical videos of distal gastrectomy for gastric cancer with the da Vinci Surgical System (dVSS), approved by an institutional review board at the medical institution. In order to evaluate generalization performance, the authors created three cross-validation datasets considering demographic and clinical variations such as gender, age, BMI, operation time, and patient bleeding. Each cross-validation set consists of 30 cases for train/validation and 10 cases for test data.
Authors list five organs (gallbladder, liver, pancreas, spleen, and stomach) and 13 surgical instruments that commonly appear from surgeries (hamonic_ace, stapler, drain_tube, etc.). They classify some rare organs and instruments as the_other_tissues and the_other_instruments classes. The surgical instruments consist of robotic and laparoscopic instruments and auxiliary tools mainly used for robotic subtotal gastrectomy. In addition, authors divide some surgical instruments according to their head, H, wrist; W, and body; B structures, which leads to 24 classes for instruments in total.
It is widely known that neural networks struggle to learn from a class-imbalanced dataset, which also happens in surgical vision. The problem can be alleviated by loss functions or data augmentation techniques; however, a data sampling method in the data generation step can also easily release it. The authors introduce a class-balanced frame sampling, considering a class distribution while creating the dataset. They select major scenes(frames) to learn while keeping a class distribution. Authors select the same number of frames for each instrument and organ in each surgery video. This approach also reduces unnecessary data labeling costs by suppressing many redundant frames, which originate from the temporal redundant characteristics of the video.
Summary #
SISVSE: Surgical Scene Segmentation Using Semantic Image Synthesis with a Virtual Surgery Environment Dataset is a dataset for instance segmentation, semantic segmentation, and object detection tasks. It is used in the medical and robotics industries.
The dataset consists of 23870 images with 532017 labeled objects belonging to 31 different classes including liver, stomach, the_other_tissues, and other: pancreas, gauze, gallbladder, spleen, marylan_bipolar_forceps_head, harmonic_ace_body, harmonic_ace_head, the_other_instruments, maryland_bipolar_forceps_wrist, cadiere_forceps_head, curved_atraumatic_grasper_body, cadiere_forceps_wrist, cadiere_forceps_body, maryland_bipolar_forceps_body, curved_atraumatic_grasper_head, stapler_body, endotip, drain_tube, stapler_head, needle, suction_irrigation, medium_large_clip_applier_head, small_clip_applier_head, small_clip_applier_wrist, medium_large_clip_applier_wrist, small_clip_applier_body, medium_large_clip_applier_body, and specimenbag.
Images in the SISVSE dataset have pixel-level instance segmentation annotations. Due to the nature of the instance segmentation task, it can be automatically transformed into a semantic segmentation (only one mask for every class) or object detection (bounding boxes for every object) tasks. All images are labeled (i.e. with annotations). There are 11 splits in the dataset: manual_syn (3400 images), real_train_3 (3377 images), real_train_1 (3375 images), real_train_2 (3355 images), sean_manual_syn (3300 images), sean_spade_translation (1236 images), domain_random_syn (1236 images), spade_domain_random_syn (1190 images), real_val_1 (1135 images), real_val_2 (1133 images), and real_val_3 (1133 images). Also, the objects contain translation and syn tags for sean_spade_translation split, supercategory image tag. Explore them in the supervisely labeling tool. The dataset was released in 2022 by the Hutom and Yonsei University College of Medicine.
Here is a visualized example for randomly selected sample classes:
Explore #
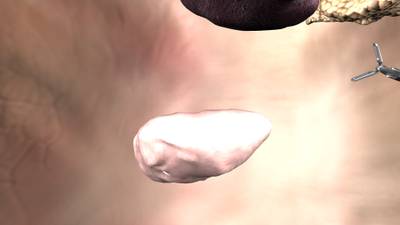
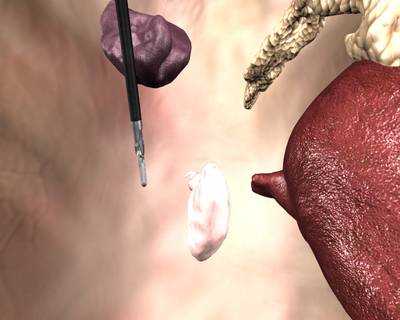
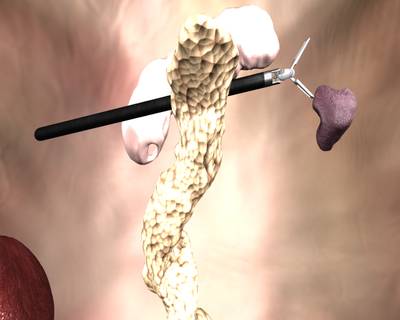
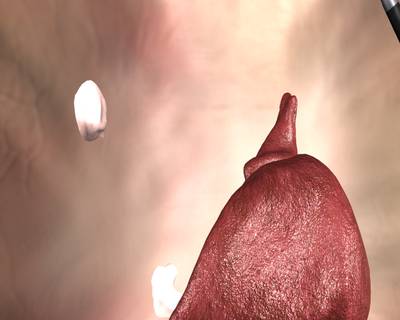
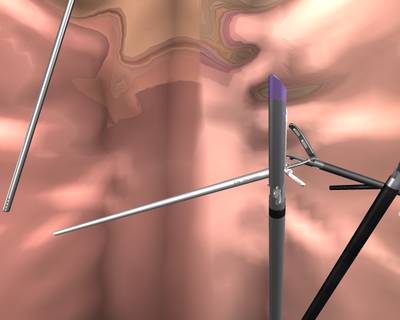
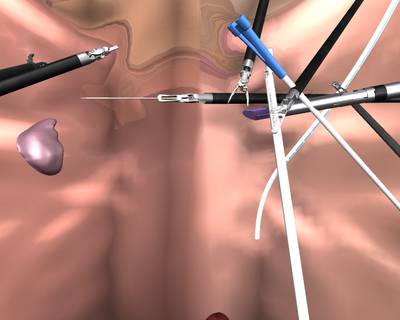
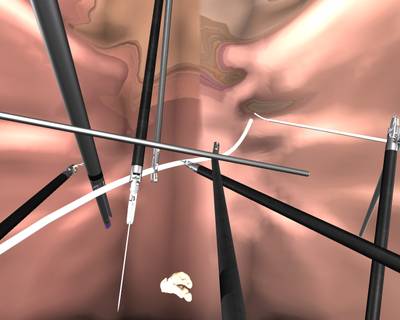
SISVSE dataset has 23870 images. Click on one of the examples below or open "Explore" tool anytime you need to view dataset images with annotations. This tool has extended visualization capabilities like zoom, translation, objects table, custom filters and more. Hover the mouse over the images to hide or show annotations.

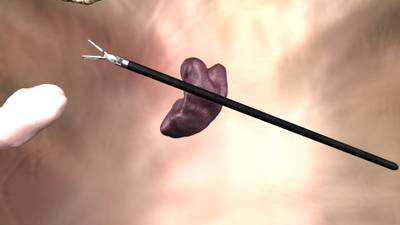

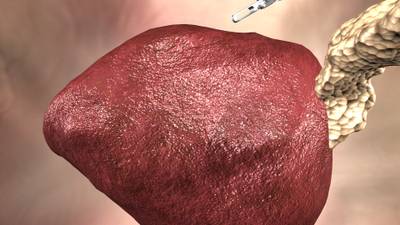





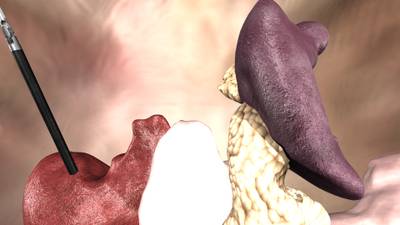

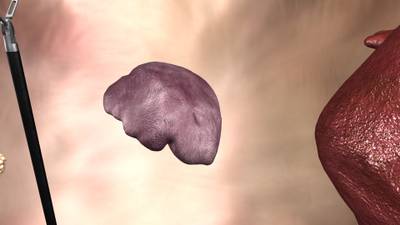





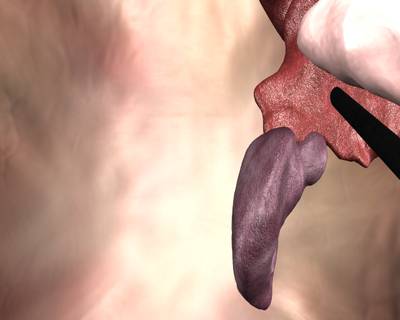

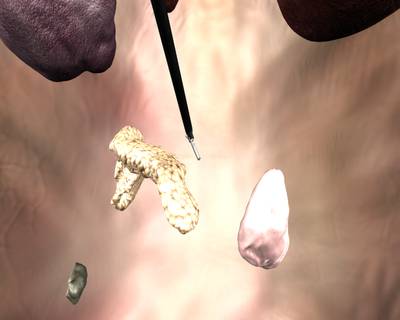

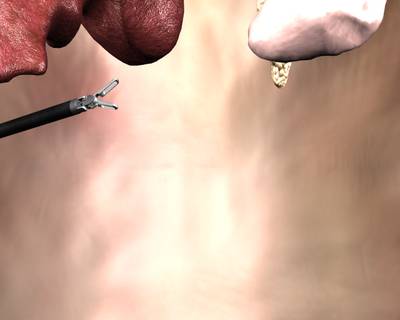

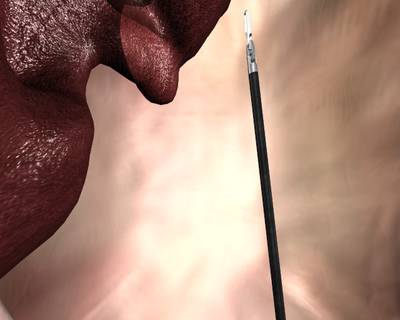

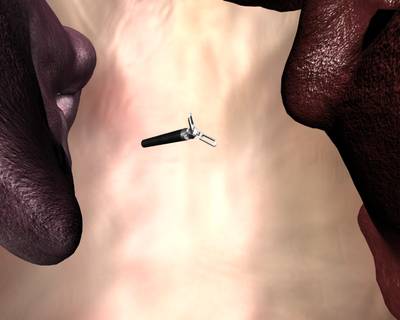

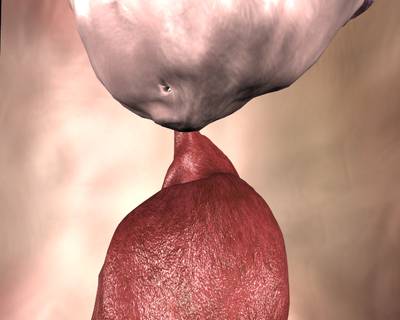

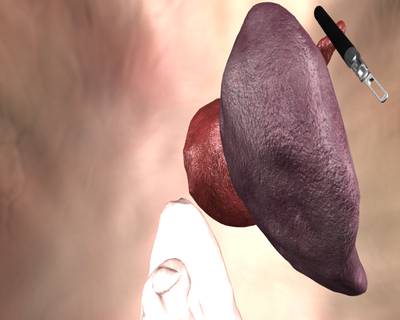

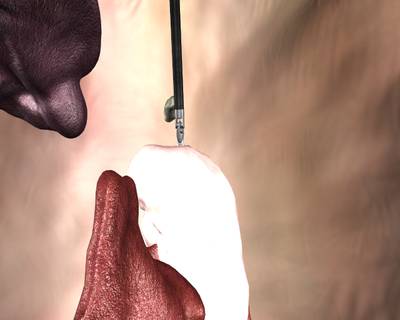












Class balance #
There are 31 annotation classes in the dataset. Find the general statistics and balances for every class in the table below. Click any row to preview images that have labels of the selected class. Sort by column to find the most rare or prevalent classes.
Class ㅤ | Images ㅤ | Objects ㅤ | Count on image average | Area on image average |
|---|---|---|---|---|
liver➔ any | 19891 | 61801 | 3.11 | 32.15% |
stomach➔ any | 17775 | 43414 | 2.44 | 30.17% |
the_other_tissues➔ any | 15914 | 67261 | 4.23 | 85.35% |
pancreas➔ any | 13943 | 31645 | 2.27 | 21.14% |
gauze➔ any | 12907 | 38199 | 2.96 | 35.35% |
gallbladder➔ any | 8752 | 19953 | 2.28 | 9.19% |
spleen➔ any | 8233 | 18712 | 2.27 | 7.62% |
marylan_bipolar_forceps_head➔ any | 8193 | 19206 | 2.34 | 4.55% |
harmonic_ace_body➔ any | 7615 | 17024 | 2.24 | 13.05% |
harmonic_ace_head➔ any | 7526 | 19677 | 2.61 | 4.1% |
Images #
Explore every single image in the dataset with respect to the number of annotations of each class it has. Click a row to preview selected image. Sort by any column to find anomalies and edge cases. Use horizontal scroll if the table has many columns for a large number of classes in the dataset.
Object distribution #
Interactive heatmap chart for every class with object distribution shows how many images are in the dataset with a certain number of objects of a specific class. Users can click cell and see the list of all corresponding images.
Class sizes #
The table below gives various size properties of objects for every class. Click a row to see the image with annotations of the selected class. Sort columns to find classes with the smallest or largest objects or understand the size differences between classes.
Class | Object count | Avg area | Max area | Min area | Min height | Min height | Max height | Max height | Avg height | Avg height | Min width | Min width | Max width | Max width |
|---|---|---|---|---|---|---|---|---|---|---|---|---|---|---|
the_other_tissues any | 67261 | 29.56% | 99.75% | 0% | 3px | 0.29% | 1023px | 99.9% | 494px | 48.26% | 3px | 0.23% | 1280px | 100% |
liver any | 61801 | 14.34% | 96.09% | 0% | 2px | 0.2% | 1080px | 100% | 369px | 36.08% | 1px | 0.08% | 1393px | 100% |
stomach any | 43414 | 19.6% | 100% | 0% | 5px | 0.49% | 1024px | 100% | 426px | 41.56% | 3px | 0.23% | 1280px | 100% |
gauze any | 38199 | 16.19% | 99.57% | 0% | 3px | 0.29% | 1023px | 99.9% | 373px | 36.45% | 4px | 0.31% | 1280px | 100% |
pancreas any | 31645 | 13.92% | 88.36% | 0% | 1px | 0.1% | 1024px | 100% | 369px | 36% | 3px | 0.23% | 1278px | 99.84% |
the_other_instruments any | 20293 | 8.99% | 99.36% | 0% | 5px | 0.49% | 1022px | 99.8% | 258px | 25.17% | 4px | 0.31% | 1279px | 99.92% |
gallbladder any | 19953 | 6.2% | 73.72% | 0% | 3px | 0.29% | 1020px | 99.61% | 280px | 27.39% | 1px | 0.08% | 1102px | 86.09% |
harmonic_ace_head any | 19677 | 1.96% | 39.22% | 0% | 2px | 0.2% | 613px | 59.86% | 137px | 13.41% | 1px | 0.08% | 1012px | 79.06% |
marylan_bipolar_forceps_head any | 19206 | 2.79% | 35.42% | 0% | 3px | 0.29% | 629px | 61.43% | 158px | 15.41% | 2px | 0.16% | 1059px | 82.73% |
spleen any | 18712 | 4.85% | 48.57% | 0% | 3px | 0.29% | 962px | 91.89% | 245px | 23.95% | 4px | 0.31% | 1200px | 93.75% |
Spatial Heatmap #
The heatmaps below give the spatial distributions of all objects for every class. These visualizations provide insights into the most probable and rare object locations on the image. It helps analyze objects' placements in a dataset.

Objects #
Table contains all 99948 objects. Click a row to preview an image with annotations, and use search or pagination to navigate. Sort columns to find outliers in the dataset.
Object ID ㅤ | Class ㅤ | Image name click row to open | Image size height x width | Height ㅤ | Height ㅤ | Width ㅤ | Width ㅤ | Area ㅤ |
|---|---|---|---|---|---|---|---|---|
1➔ | harmonic_ace_body any | 2021-09-27-16-57-36_476.jpg | 1024 x 1280 | 303px | 29.59% | 410px | 32.03% | 0.76% |
2➔ | harmonic_ace_body any | 2021-09-27-16-57-36_476.jpg | 1024 x 1280 | 303px | 29.59% | 410px | 32.03% | 9.48% |
3➔ | marylan_bipolar_forceps_head any | 2021-09-27-16-57-36_476.jpg | 1024 x 1280 | 60px | 5.86% | 86px | 6.72% | 0.13% |
4➔ | marylan_bipolar_forceps_head any | 2021-09-27-16-57-36_476.jpg | 1024 x 1280 | 15px | 1.46% | 17px | 1.33% | 0.01% |
5➔ | marylan_bipolar_forceps_head any | 2021-09-27-16-57-36_476.jpg | 1024 x 1280 | 60px | 5.86% | 86px | 6.72% | 0.39% |
6➔ | maryland_bipolar_forceps_wrist any | 2021-09-27-16-57-36_476.jpg | 1024 x 1280 | 49px | 4.79% | 48px | 3.75% | 0.05% |
7➔ | maryland_bipolar_forceps_wrist any | 2021-09-27-16-57-36_476.jpg | 1024 x 1280 | 50px | 4.88% | 48px | 3.75% | 0.18% |
8➔ | maryland_bipolar_forceps_body any | 2021-09-27-16-57-36_476.jpg | 1024 x 1280 | 21px | 2.05% | 38px | 2.97% | 0.03% |
9➔ | maryland_bipolar_forceps_body any | 2021-09-27-16-57-36_476.jpg | 1024 x 1280 | 99px | 9.67% | 171px | 13.36% | 0.35% |
10➔ | maryland_bipolar_forceps_body any | 2021-09-27-16-57-36_476.jpg | 1024 x 1280 | 129px | 12.6% | 219px | 17.11% | 2.16% |
License #
SISVSE: Surgical Scene Segmentation Using Semantic Image Synthesis with a Virtual Surgery Environment Dataset is under 3-Clause BSD License license.
Citation #
If you make use of the Surgical Scene Segmentation in Robotic Gastrectomy data, please cite the following reference:
@InProceedings{10.1007/978-3-031-16449-1_53,
  author="Yoon, Jihun and Hong, SeulGi and Hong, Seungbum and Lee, Jiwon and Shin, Soyeon and Park, Bokyung and Sung, Nakjun and Yu, Hayeong and Kim, Sungjae and Park, SungHyun and Hyung, Woo Jin and Choi, Min-Kook",
  editor="Wang, Linwei and Dou, Qi and Fletcher, P. Thomas and Speidel, Stefanie and Li, Shuo",
  title="Surgical Scene Segmentation Using Semantic Image Synthesis with a Virtual Surgery Environment",
  booktitle="Medical Image Computing and Computer Assisted Intervention -- MICCAI 2022",
  year="2022",
  publisher="Springer Nature Switzerland",
  address="Cham",
  pages="551--561",
  isbn="978-3-031-16449-1"
}
If you are happy with Dataset Ninja and use provided visualizations and tools in your work, please cite us:
@misc{ visualization-tools-for-surgical-scene-segmentation-in-robotic-gastrectomy-dataset,
  title = { Visualization Tools for SISVSE Dataset },
  type = { Computer Vision Tools },
  author = { Dataset Ninja },
  howpublished = { \url{ https://datasetninja.com/surgical-scene-segmentation-in-robotic-gastrectomy } },
  url = { https://datasetninja.com/surgical-scene-segmentation-in-robotic-gastrectomy },
  journal = { Dataset Ninja },
  publisher = { Dataset Ninja },
  year = { 2026 },
  month = { feb },
  note = { visited on 2026-02-23 },
}
Download #
Dataset SISVSE can be downloaded in Supervisely format:
As an alternative, it can be downloaded with dataset-tools package:
pip install --upgrade dataset-tools
… using following python code:
import dataset_tools as dtools

dtools.download(dataset='SISVSE', dst_dir='~/dataset-ninja/')
Make sure not to overlook the python code example available on the Supervisely Developer Portal. It will give you a clear idea of how to effortlessly work with the downloaded dataset.
The data in original format can be downloaded here.
Disclaimer #
Our gal from the legal dep told us we need to post this:
Dataset Ninja provides visualizations and statistics for some datasets that can be found online and can be downloaded by general audience. Dataset Ninja is not a dataset hosting platform and can only be used for informational purposes. The platform does not claim any rights for the original content, including images, videos, annotations and descriptions. Joint publishing is prohibited.
You take full responsibility when you use datasets presented at Dataset Ninja, as well as other information, including visualizations and statistics we provide. You are in charge of compliance with any dataset license and all other permissions. You are required to navigate datasets homepage and make sure that you can use it. In case of any questions, get in touch with us at hello@datasetninja.com.


