

Introduction #
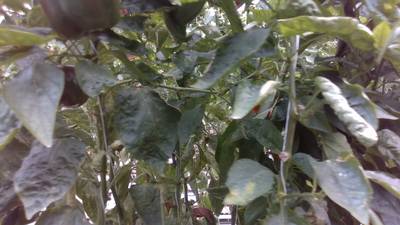
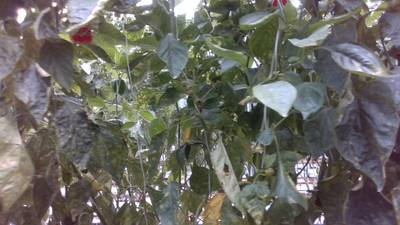
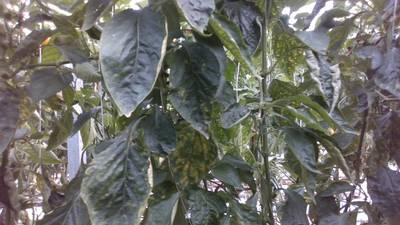
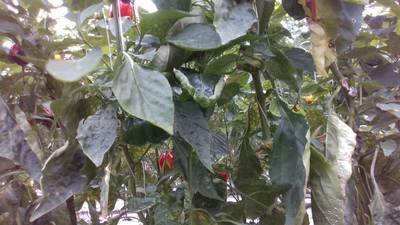
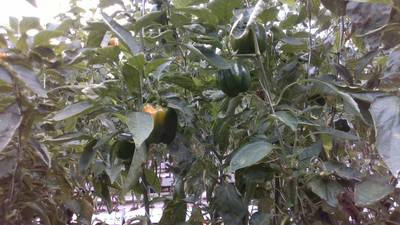
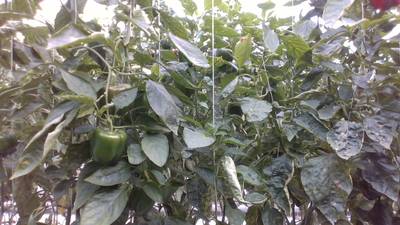
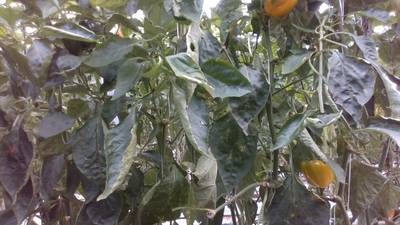
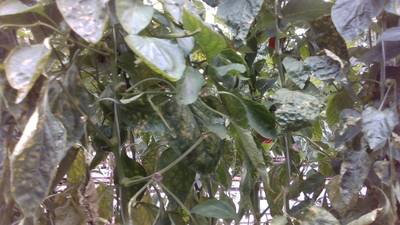
The Sweet Pepper and Peduncle Segmentation dataset was created as part of a master’s research project. It consisted of using an RGB-D-based sensor to detect peppers and their peduncles and then using depth information to estimate their peduncle’s pose. The data gathered here was obtained by moving the sensor horizontally facing sweet pepper crops in a greenhouse. The sensor had a distance of 0.6 meters from the crops. It used default settings and a resolution of 1280x720 pixels.
| Characteristic | Value |
|---|---|
| Total Images | 620 |
| Classes | 2: fruit, peduncle |
| Attributes per class | 4: green, red, yellow, orange |
| Avg. crop distance | 60 cm |
| Total labeling time | 64 hours |
 Homepage
 GitHub
Summary #
Sweet Pepper and Peduncle Segmentation is a dataset for instance segmentation, semantic segmentation, and object detection tasks. Possible applications of the dataset could be in the agricultural industry.
The dataset consists of 620 images with 6422 labeled objects belonging to 8 different classes including green fruit, red fruit, green peduncle, and other: yellow fruit, red peduncle, yellow peduncle, orange fruit, and orange peduncle.
Images in the Sweet Pepper dataset have pixel-level instance segmentation annotations. Due to the nature of the instance segmentation task, it can be automatically transformed into a semantic segmentation (only one mask for every class) or object detection (bounding boxes for every object) tasks. There is 1 unlabeled image (i.e. without annotations). There are no pre-defined train/val/test splits in the dataset. The dataset was released in 2021.
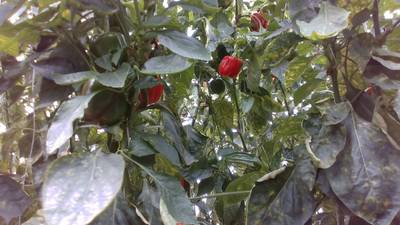
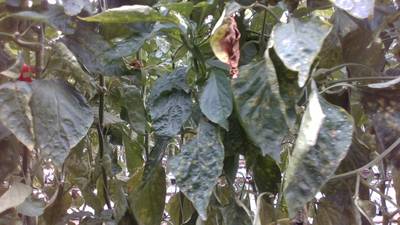
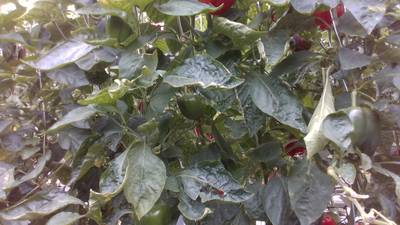
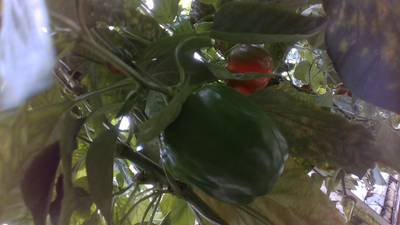
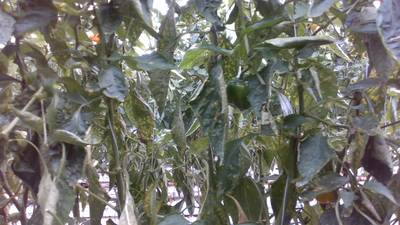
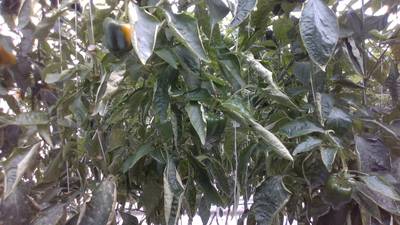
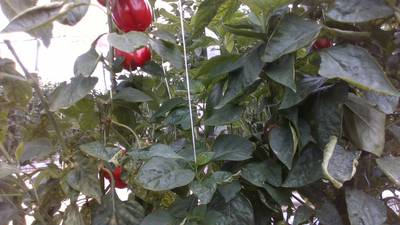
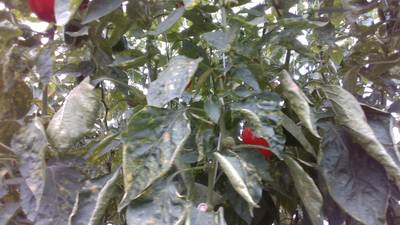
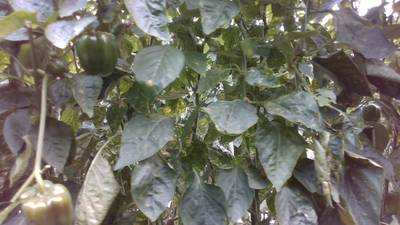
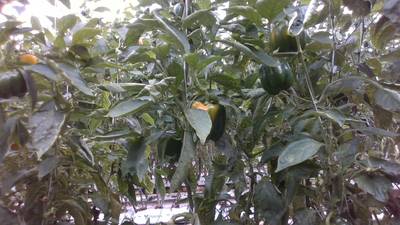
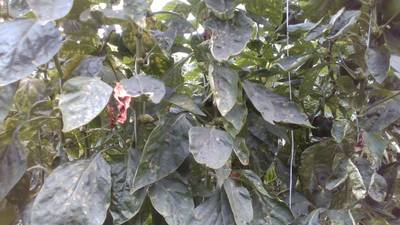
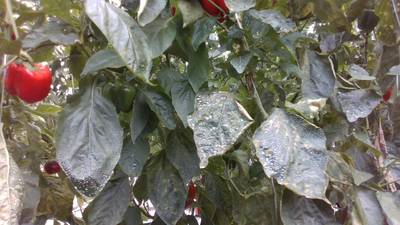
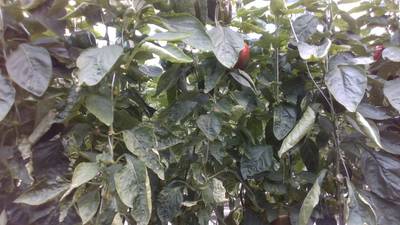
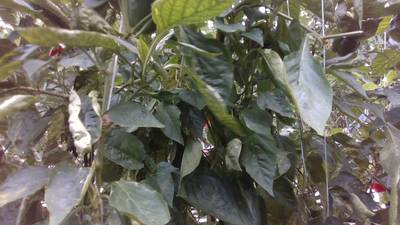
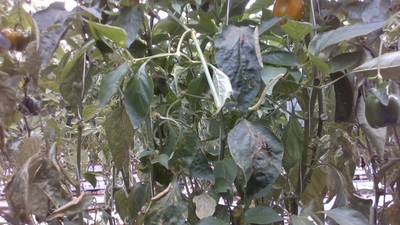
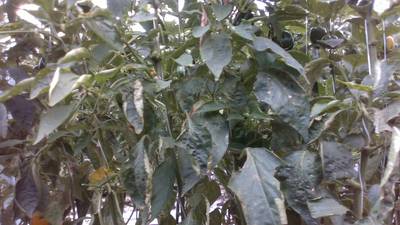
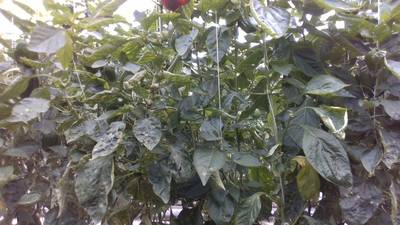
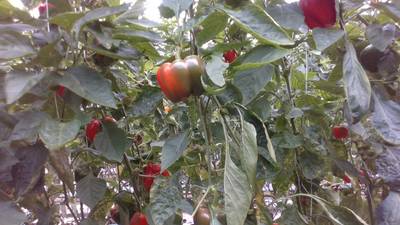
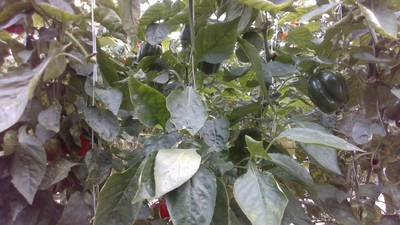
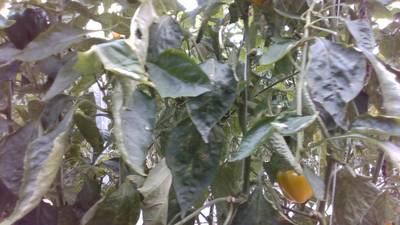
Here is the visualized example grid with animated annotations:
Explore #
Sweet Pepper dataset has 620 images. Click on one of the examples below or open "Explore" tool anytime you need to view dataset images with annotations. This tool has extended visualization capabilities like zoom, translation, objects table, custom filters and more. Hover the mouse over the images to hide or show annotations.


Class balance #
There are 8 annotation classes in the dataset. Find the general statistics and balances for every class in the table below. Click any row to preview images that have labels of the selected class. Sort by column to find the most rare or prevalent classes.

Class ㅤ | Images ㅤ | Objects ㅤ | Count on image average | Area on image average |
|---|---|---|---|---|
green fruit➔ polygon | 591 | 2434 | 4.12 | 1.88% |
red fruit➔ polygon | 445 | 2218 | 4.98 | 1.8% |
green peduncle➔ polygon | 373 | 620 | 1.66 | 0.2% |
yellow fruit➔ polygon | 264 | 569 | 2.16 | 0.99% |
red peduncle➔ polygon | 222 | 365 | 1.64 | 0.22% |
yellow peduncle➔ polygon | 95 | 110 | 1.16 | 0.14% |
orange fruit➔ polygon | 86 | 104 | 1.21 | 0.1% |
orange peduncle➔ polygon | 2 | 2 | 1 | 0.03% |
Co-occurrence matrix #
Co-occurrence matrix is an extremely valuable tool that shows you the images for every pair of classes: how many images have objects of both classes at the same time. If you click any cell, you will see those images. We added the tooltip with an explanation for every cell for your convenience, just hover the mouse over a cell to preview the description.
Images #
Explore every single image in the dataset with respect to the number of annotations of each class it has. Click a row to preview selected image. Sort by any column to find anomalies and edge cases. Use horizontal scroll if the table has many columns for a large number of classes in the dataset.
Object distribution #
Interactive heatmap chart for every class with object distribution shows how many images are in the dataset with a certain number of objects of a specific class. Users can click cell and see the list of all corresponding images.
Class sizes #
The table below gives various size properties of objects for every class. Click a row to see the image with annotations of the selected class. Sort columns to find classes with the smallest or largest objects or understand the size differences between classes.
Class | Object count | Avg area | Max area | Min area | Min height | Min height | Max height | Max height | Avg height | Avg height | Min width | Min width | Max width | Max width |
|---|---|---|---|---|---|---|---|---|---|---|---|---|---|---|
green fruit polygon | 2434 | 0.44% | 12.74% | 0.01% | 9px | 1.25% | 405px | 56.25% | 71px | 9.83% | 11px | 0.86% | 421px | 32.89% |
red fruit polygon | 2218 | 0.35% | 5.11% | 0.01% | 9px | 1.25% | 242px | 33.61% | 63px | 8.82% | 7px | 0.55% | 265px | 20.7% |
green peduncle polygon | 620 | 0.12% | 2.09% | 0.01% | 7px | 0.97% | 154px | 21.39% | 41px | 5.64% | 10px | 0.78% | 182px | 14.22% |
yellow fruit polygon | 569 | 0.45% | 2.33% | 0.01% | 8px | 1.11% | 166px | 23.06% | 66px | 9.17% | 9px | 0.7% | 183px | 14.3% |
red peduncle polygon | 365 | 0.13% | 1.62% | 0.01% | 10px | 1.39% | 141px | 19.58% | 42px | 5.79% | 11px | 0.86% | 173px | 13.52% |
yellow peduncle polygon | 110 | 0.12% | 0.39% | 0.01% | 14px | 1.94% | 79px | 10.97% | 43px | 6.03% | 14px | 1.09% | 106px | 8.28% |
orange fruit polygon | 104 | 0.08% | 2.23% | 0.01% | 9px | 1.25% | 175px | 24.31% | 28px | 3.89% | 9px | 0.7% | 149px | 11.64% |
orange peduncle polygon | 2 | 0.02% | 0.04% | 0.01% | 13px | 1.81% | 28px | 3.89% | 20px | 2.85% | 12px | 0.94% | 37px | 2.89% |
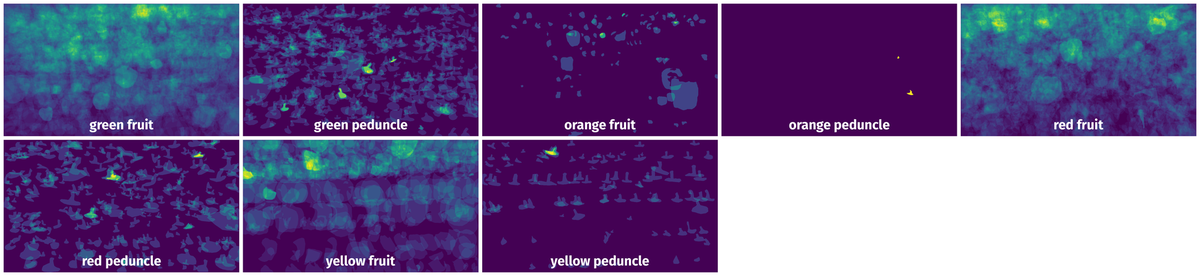
Spatial Heatmap #
The heatmaps below give the spatial distributions of all objects for every class. These visualizations provide insights into the most probable and rare object locations on the image. It helps analyze objects' placements in a dataset.
Objects #
Table contains all 6422 objects. Click a row to preview an image with annotations, and use search or pagination to navigate. Sort columns to find outliers in the dataset.
Object ID ㅤ | Class ㅤ | Image name click row to open | Image size height x width | Height ㅤ | Height ㅤ | Width ㅤ | Width ㅤ | Area ㅤ |
|---|---|---|---|---|---|---|---|---|
1➔ | red fruit polygon | _Color_1607626338633.53295898437500.png | 720 x 1280 | 126px | 17.5% | 142px | 11.09% | 1.56% |
2➔ | red fruit polygon | _Color_1607626338633.53295898437500.png | 720 x 1280 | 41px | 5.69% | 38px | 2.97% | 0.08% |
3➔ | red fruit polygon | _Color_1607626338633.53295898437500.png | 720 x 1280 | 90px | 12.5% | 121px | 9.45% | 0.53% |
4➔ | green fruit polygon | _Color_1607626338633.53295898437500.png | 720 x 1280 | 51px | 7.08% | 104px | 8.12% | 0.23% |
5➔ | red fruit polygon | _Color_1607626338633.53295898437500.png | 720 x 1280 | 57px | 7.92% | 61px | 4.77% | 0.26% |
6➔ | red fruit polygon | _Color_1607626338633.53295898437500.png | 720 x 1280 | 54px | 7.5% | 65px | 5.08% | 0.13% |
7➔ | red fruit polygon | _Color_1607626338633.53295898437500.png | 720 x 1280 | 42px | 5.83% | 42px | 3.28% | 0.05% |
8➔ | red fruit polygon | _Color_1607626338633.53295898437500.png | 720 x 1280 | 21px | 2.92% | 38px | 2.97% | 0.05% |
9➔ | red fruit polygon | _Color_1607626338633.53295898437500.png | 720 x 1280 | 14px | 1.94% | 28px | 2.19% | 0.02% |
10➔ | green fruit polygon | _Color_1607626338633.53295898437500.png | 720 x 1280 | 33px | 4.58% | 40px | 3.12% | 0.09% |
License #
Sweet Pepper and Peduncle Segmentation is under CC BY-SA 4.0 license.
Citation #
If you make use of the Sweet Pepper data, please cite the following reference:
@dataset{Sweet Pepper,
	authors={Luis Enrique Montoya Caveroand Jesús Escobedo},
	title={Sweet Pepper and Peduncle Segmentation},
	year={2021},
	url={https://www.kaggle.com/datasets/lemontyc/sweet-pepper?resource=download}
}
If you are happy with Dataset Ninja and use provided visualizations and tools in your work, please cite us:
@misc{ visualization-tools-for-sweet-pepper-dataset,
  title = { Visualization Tools for Sweet Pepper Dataset },
  type = { Computer Vision Tools },
  author = { Dataset Ninja },
  howpublished = { \url{ https://datasetninja.com/sweet-pepper } },
  url = { https://datasetninja.com/sweet-pepper },
  journal = { Dataset Ninja },
  publisher = { Dataset Ninja },
  year = { 2026 },
  month = { jul },
  note = { visited on 2026-07-29 },
}
Download #
Dataset Sweet Pepper can be downloaded in Supervisely format:
As an alternative, it can be downloaded with dataset-tools package:
pip install --upgrade dataset-tools
… using following python code:
import dataset_tools as dtools

dtools.download(dataset='Sweet Pepper', dst_dir='~/dataset-ninja/')
Make sure not to overlook the python code example available on the Supervisely Developer Portal. It will give you a clear idea of how to effortlessly work with the downloaded dataset.
The data in original format can be downloaded here.
Disclaimer #
Our gal from the legal dep told us we need to post this:
Dataset Ninja provides visualizations and statistics for some datasets that can be found online and can be downloaded by general audience. Dataset Ninja is not a dataset hosting platform and can only be used for informational purposes. The platform does not claim any rights for the original content, including images, videos, annotations and descriptions. Joint publishing is prohibited.
You take full responsibility when you use datasets presented at Dataset Ninja, as well as other information, including visualizations and statistics we provide. You are in charge of compliance with any dataset license and all other permissions. You are required to navigate datasets homepage and make sure that you can use it. In case of any questions, get in touch with us at hello@datasetninja.com.