

Introduction #
The authors of the dataset present a set of synthetic overhead imagery of wind turbines, which was generated using CityEngine. The synthetic images were designed to qualitatively match real overhead images of wind turbines from California and Arizona. Each image in the dataset is accompanied by corresponding labels that provide important information, such as the class, x and y coordinates, and height and width of the ground truth bounding boxes for each wind turbine.
The main purpose of this dataset is to serve as a supplement for training object detection models on overhead images of wind turbines. By adding this synthetic data to the training set, it is intended to potentially enhance the model’s performance, especially when dealing with small wind turbines or images captured in desert regions.
The dataset was created with the objective of studying the use of synthetic imagery for cross-domain testing. During the training of the YOLOv3 model on the “Overhead Imagery of Wind Turbines” dataset, the authors observed that the model faced challenges when dealing with images from California and Arizona, where smaller wind turbines were present. Due to the size of these turbines, there was less information available for the model to correctly identify them. Often, the only noticeable information was the shadows of the turbines. To address this issue, the authors designed the synthetic imagery to potentially improve the model’s performance in these specific regions and with this type of wind turbine. The synthetic images were added to the training set, and the model’s performance was re-evaluated on the testing set consisting of data from California and Arizona.
To create the dataset, the authors selected background images from a publicly available dataset called Power Plant Satellite Imagery Dataset. The selected background images were chosen to avoid scenes with unrealistic infrastructure. Then, a script was used to randomly and uniformly generate 3D models of both small and large wind turbines over the background images, followed by capturing four 608x608 pixel images using a virtual camera. This process was repeated with the same random seed, but with no background image and the wind turbines colored in black. The black and white images were subsequently converted into ground truth labels by grouping the black pixels in the images.
 Homepage
Summary #
Synthetic Overhead Images of Wind Turbines Made to Mimic California and Arizona is a dataset for an object detection task. Possible applications of the dataset could be in the energy industry. The dataset presented here is not the original one. Learn more on the dataset’s homepage.
The dataset consists of 400 images with 2325 labeled objects belonging to 1 single class (wind turbines).
Images in the California and Arizona Wind Turbines (by Duke Dataplus2020) dataset have bounding box annotations. There are 22 (6% of the total) unlabeled images (i.e. without annotations). There is 1 split in the dataset: train (400 images). The dataset was released in 2020.
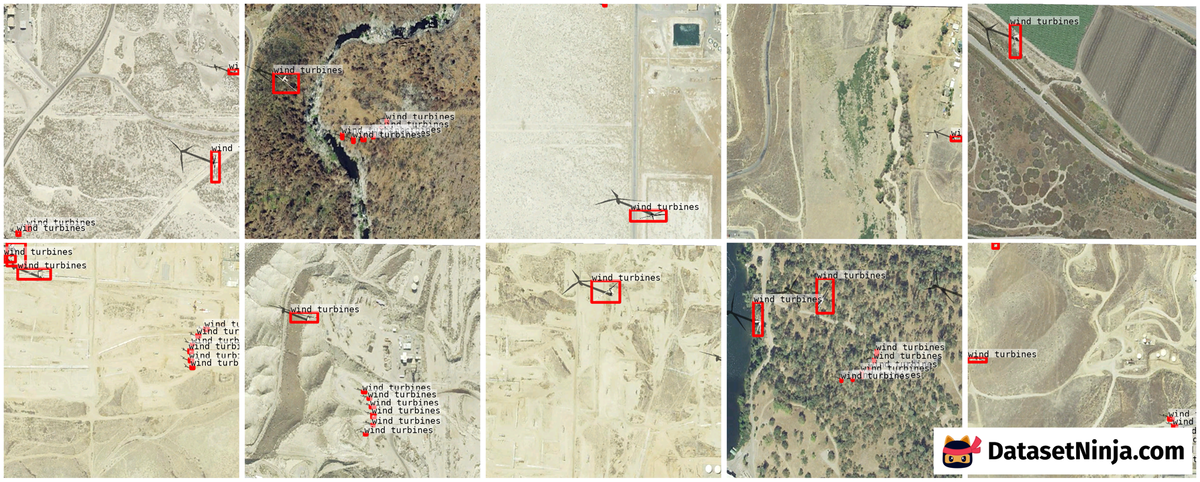
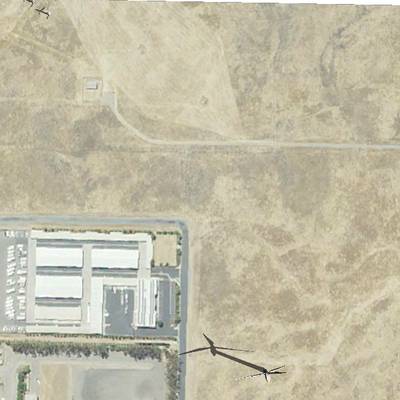
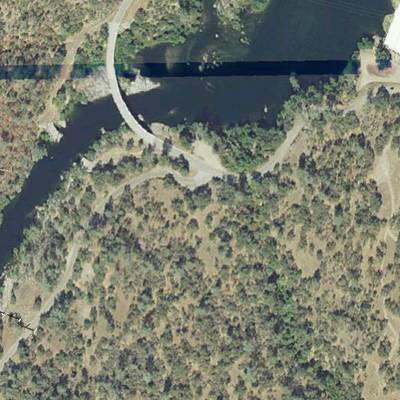
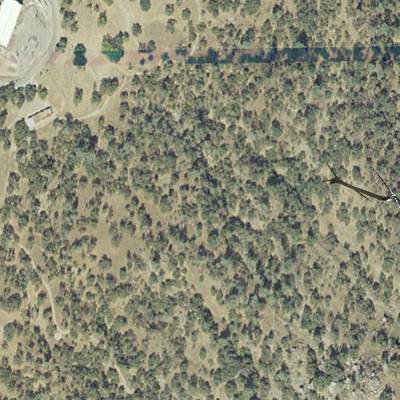
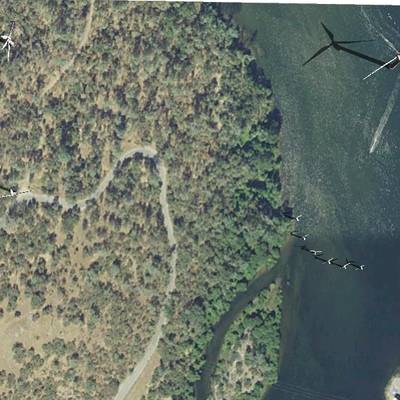
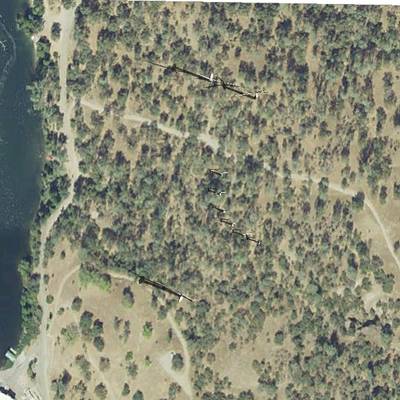
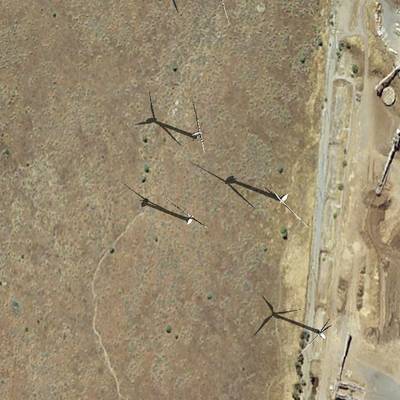
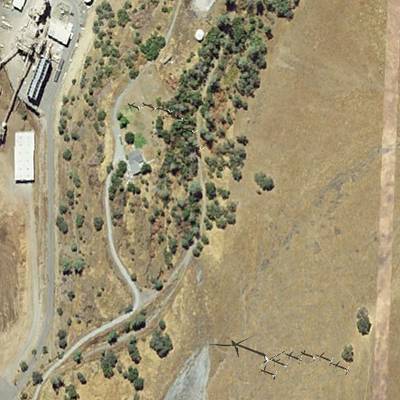
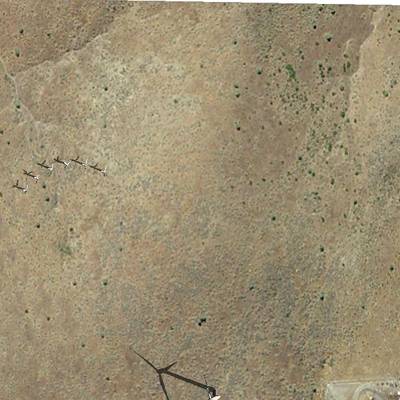
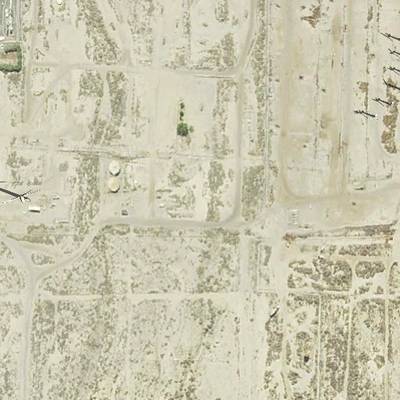
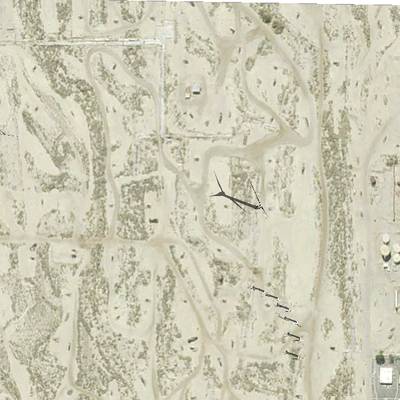
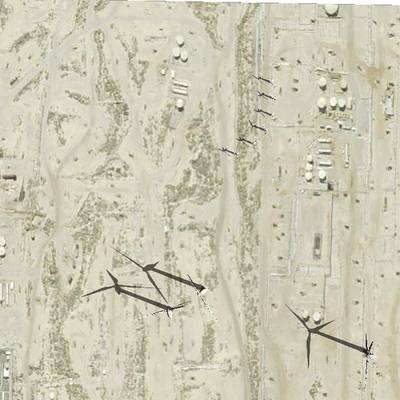
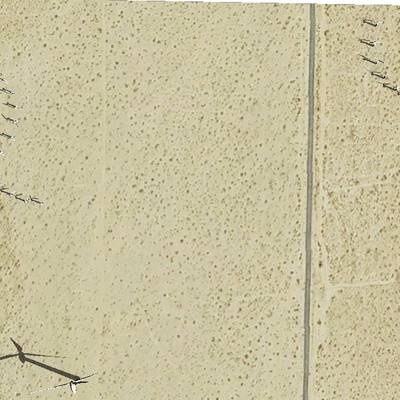
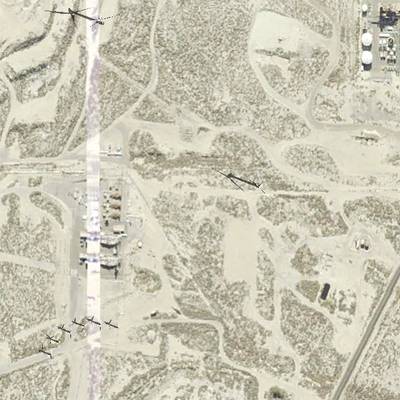
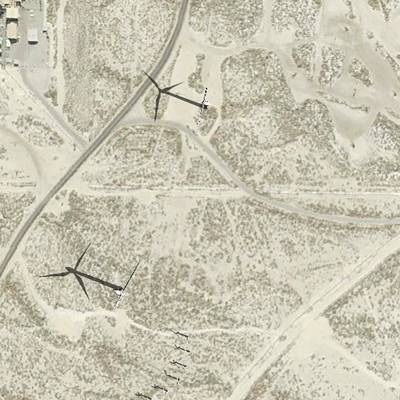
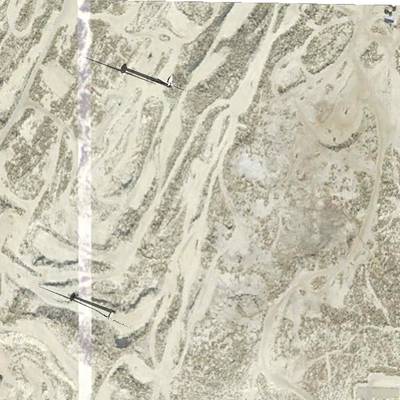
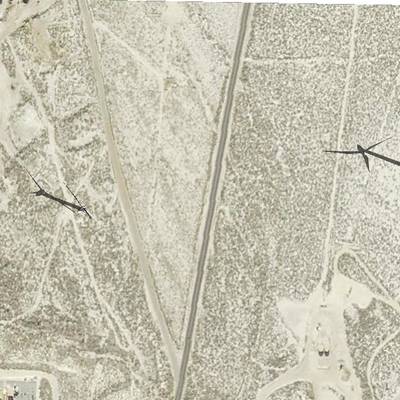
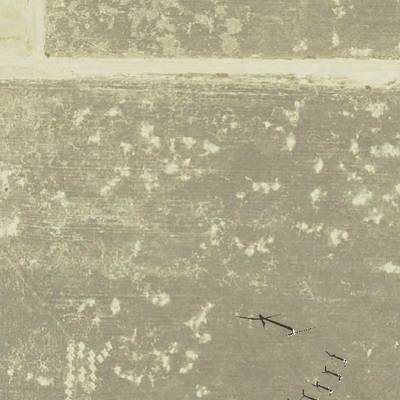
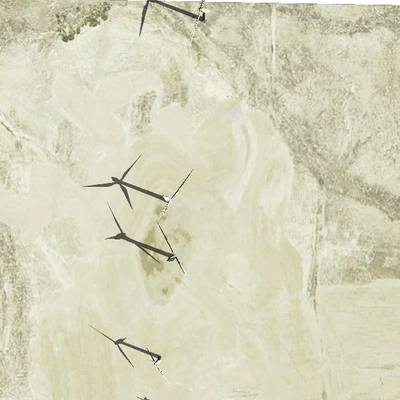
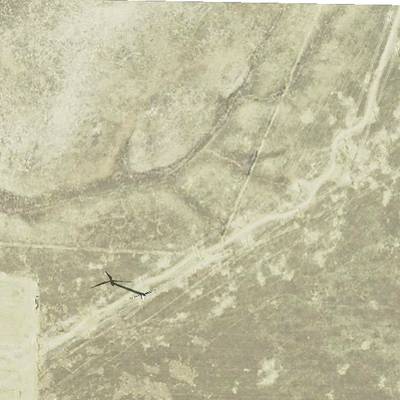
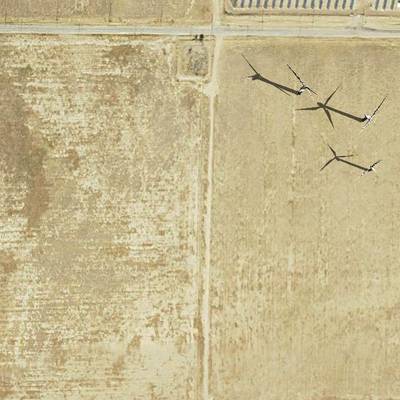
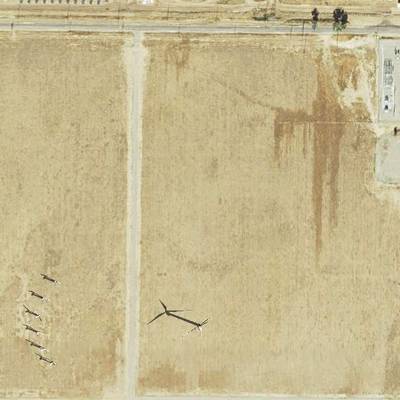
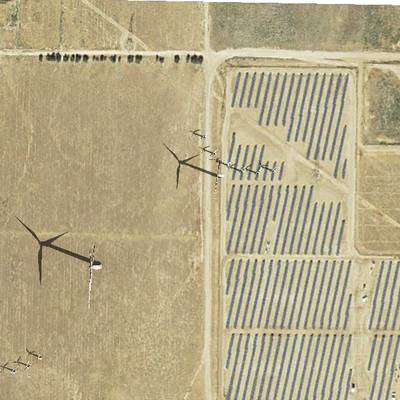
Here is the visualized example grid with annotations:
Explore #
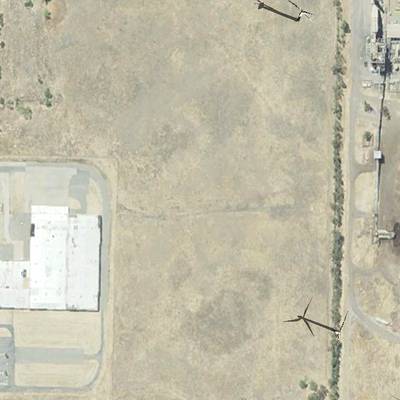
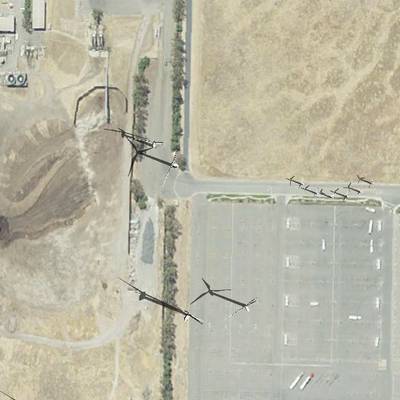
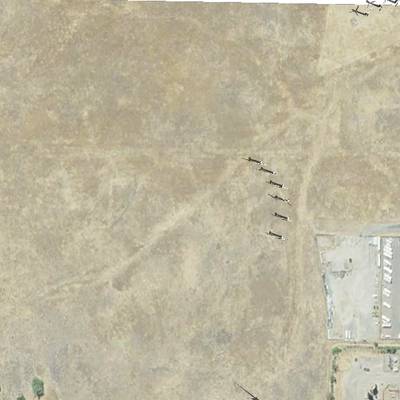
California and Arizona Wind Turbines (by Duke Dataplus2020) dataset has 400 images. Click on one of the examples below or open "Explore" tool anytime you need to view dataset images with annotations. This tool has extended visualization capabilities like zoom, translation, objects table, custom filters and more. Hover the mouse over the images to hide or show annotations.


Class balance #
There are 1 annotation classes in the dataset. Find the general statistics and balances for every class in the table below. Click any row to preview images that have labels of the selected class. Sort by column to find the most rare or prevalent classes.

Class ㅤ | Images ㅤ | Objects ㅤ | Count on image average | Area on image average |
|---|---|---|---|---|
wind turbines➔ rectangle | 378 | 2325 | 6.15 | 0.99% |
Images #
Explore every single image in the dataset with respect to the number of annotations of each class it has. Click a row to preview selected image. Sort by any column to find anomalies and edge cases. Use horizontal scroll if the table has many columns for a large number of classes in the dataset.
Object distribution #
Interactive heatmap chart for every class with object distribution shows how many images are in the dataset with a certain number of objects of a specific class. Users can click cell and see the list of all corresponding images.
Class sizes #
The table below gives various size properties of objects for every class. Click a row to see the image with annotations of the selected class. Sort columns to find classes with the smallest or largest objects or understand the size differences between classes.
Class | Object count | Avg area | Max area | Min area | Min height | Min height | Max height | Max height | Avg height | Avg height | Min width | Min width | Max width | Max width |
|---|---|---|---|---|---|---|---|---|---|---|---|---|---|---|
wind turbines rectangle | 2325 | 0.16% | 3.43% | 0% | 2px | 0.33% | 104px | 17.11% | 20px | 3.23% | 2px | 0.33% | 122px | 20.07% |
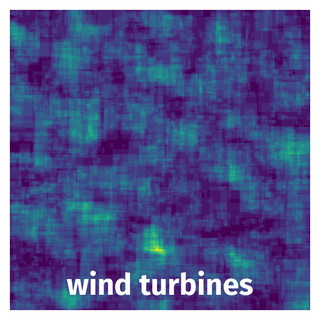
Spatial Heatmap #
The heatmaps below give the spatial distributions of all objects for every class. These visualizations provide insights into the most probable and rare object locations on the image. It helps analyze objects' placements in a dataset.
Objects #
Table contains all 2325 objects. Click a row to preview an image with annotations, and use search or pagination to navigate. Sort columns to find outliers in the dataset.
Object ID ㅤ | Class ㅤ | Image name click row to open | Image size height x width | Height ㅤ | Height ㅤ | Width ㅤ | Width ㅤ | Area ㅤ |
|---|---|---|---|---|---|---|---|---|
1➔ | wind turbines rectangle | wnd_xview_bkg_sd44_3.png | 608 x 608 | 16px | 2.63% | 74px | 12.17% | 0.32% |
2➔ | wind turbines rectangle | wnd_xview_bkg_sd5_1.png | 608 x 608 | 79px | 12.99% | 63px | 10.36% | 1.35% |
3➔ | wind turbines rectangle | wnd_xview_bkg_sd5_1.png | 608 x 608 | 42px | 6.91% | 43px | 7.07% | 0.49% |
4➔ | wind turbines rectangle | wnd_xview_bkg_sd19_3.png | 608 x 608 | 30px | 4.93% | 35px | 5.76% | 0.28% |
5➔ | wind turbines rectangle | wnd_xview_bkg_sd14_2.png | 608 x 608 | 65px | 10.69% | 22px | 3.62% | 0.39% |
6➔ | wind turbines rectangle | wnd_xview_bkg_sd14_2.png | 608 x 608 | 79px | 12.99% | 43px | 7.07% | 0.92% |
7➔ | wind turbines rectangle | wnd_xview_bkg_sd14_2.png | 608 x 608 | 7px | 1.15% | 6px | 0.99% | 0.01% |
8➔ | wind turbines rectangle | wnd_xview_bkg_sd14_2.png | 608 x 608 | 12px | 1.97% | 9px | 1.48% | 0.03% |
9➔ | wind turbines rectangle | wnd_xview_bkg_sd14_2.png | 608 x 608 | 8px | 1.32% | 8px | 1.32% | 0.02% |
10➔ | wind turbines rectangle | wnd_xview_bkg_sd14_2.png | 608 x 608 | 6px | 0.99% | 5px | 0.82% | 0.01% |
License #
Citation #
If you make use of the Wind Turbines 2 data, please cite the following reference:
@article{Duke Dataplus20202020,
    author = "Duke Dataplus2020",
    title = "{Synthetic Overhead Images of Wind Turbines Made to Mimic California and Arizona}",
    year = "2020",
    month = "7",
    url = "https://figshare.com/articles/dataset/Synthetic_Overhead_Images_of_Wind_Turbines_Made_to_Mimic_California_and_Arizona/12744950",
    doi = "10.6084/m9.figshare.12744950.v1"
}
If you are happy with Dataset Ninja and use provided visualizations and tools in your work, please cite us:
@misc{ visualization-tools-for-synthetic-overhead-wind-turbines-dataset,
  title = { Visualization Tools for California and Arizona Wind Turbines (by Duke Dataplus2020) Dataset },
  type = { Computer Vision Tools },
  author = { Dataset Ninja },
  howpublished = { \url{ https://datasetninja.com/synthetic-overhead-wind-turbines } },
  url = { https://datasetninja.com/synthetic-overhead-wind-turbines },
  journal = { Dataset Ninja },
  publisher = { Dataset Ninja },
  year = { 2026 },
  month = { jul },
  note = { visited on 2026-07-20 },
}
Download #
Dataset California and Arizona Wind Turbines (by Duke Dataplus2020) can be downloaded in Supervisely format:
As an alternative, it can be downloaded with dataset-tools package:
pip install --upgrade dataset-tools
… using following python code:
import dataset_tools as dtools

dtools.download(dataset='California and Arizona Wind Turbines (by Duke Dataplus2020)', dst_dir='~/dataset-ninja/')
Make sure not to overlook the python code example available on the Supervisely Developer Portal. It will give you a clear idea of how to effortlessly work with the downloaded dataset.
The data in original format can be downloaded here.
Disclaimer #
Our gal from the legal dep told us we need to post this:
Dataset Ninja provides visualizations and statistics for some datasets that can be found online and can be downloaded by general audience. Dataset Ninja is not a dataset hosting platform and can only be used for informational purposes. The platform does not claim any rights for the original content, including images, videos, annotations and descriptions. Joint publishing is prohibited.
You take full responsibility when you use datasets presented at Dataset Ninja, as well as other information, including visualizations and statistics we provide. You are in charge of compliance with any dataset license and all other permissions. You are required to navigate datasets homepage and make sure that you can use it. In case of any questions, get in touch with us at hello@datasetninja.com.