

Introduction #
The authors introduce a synthetic dataset, SYNTHIA, The SYNTHetic collection of Imagery and Annotations, specially designed to evaluate active learning for video object detection in road scenes. Autonomous driving systems require huge amounts of data to train. Manual annotation of this data is timeconsuming and prohibitively expensive since it involves human resources. Therefore, active learning emerged as an alternative to ease this effort and to make data annotation more manageable. For autonomous driving systems, the quality of object detection is of key importance. Its progress in recent years has been notable, partially due to the presence of large datasets. However, pushing detectors to further improve and finally be close to flawless, requires the collection of ever larger labeled datasets, which is both time and labor expensive. In their work the authors focused on active learning for object detection in videos.
Dataset description
The authors have created a new synthetic dataset to evaluate active learning for object detection in road scenes. In particular, they modified the SYNTHIA environment to generate the SYNTHIA-AL dataset using Unity Pro game engine. The aim is having an unbalanced foreground/background distribution, simulating the real collection scenario of a driving car. Moreover, a set of object classes and conditions should be predominantly present, while other classes and conditions must appear less frequent. The data is generated by driving a car in a virtual world consisting of three different areas, namely town, city, and highway. These areas are populated with a variety of pedestrians, cars, cyclists, and wheelchairs, except for the highway which is limited to cars. These dynamic objects are arbitrarily spawned at predefined positions with a given probability and follow randomly predefined paths without leaving each area. Several environmental conditions can be set: season (winter, fall, spring), day time (day or night), and weather (clear or rainy). By default, the authors always use spring
and clear during the day, and only change one condition at a time. Objects with no lights can be hard to visualize during the night, so they only use cars for the night condition.
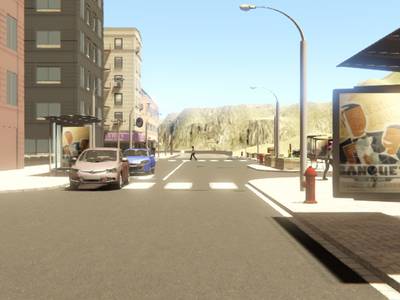
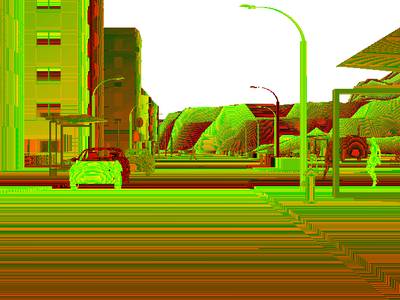
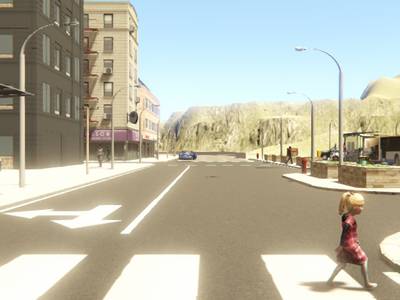
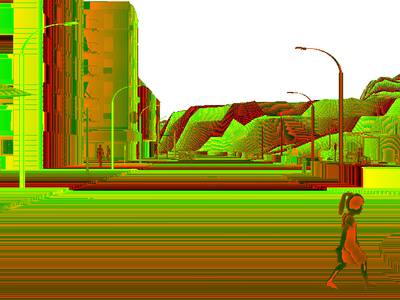
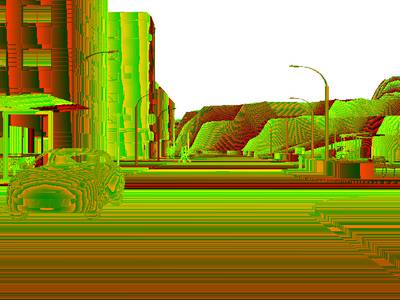
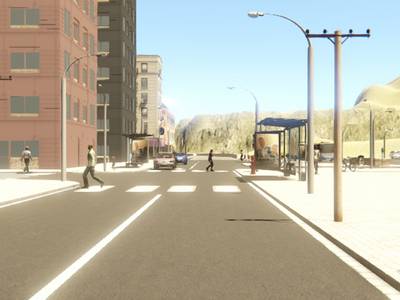
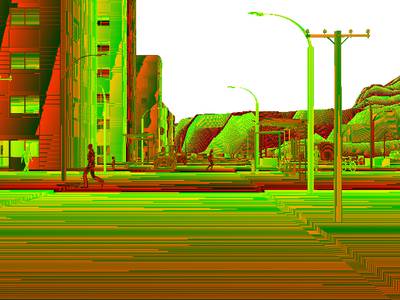
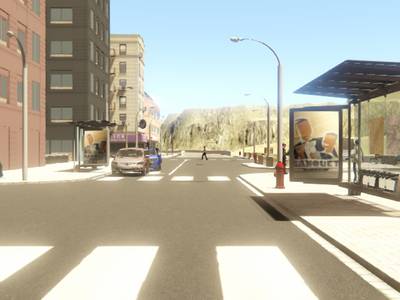
Examples of errors detected by temporal coherence approach on SYNTHIA-AL (top, middle) and ImageNet-VID(bottom). The authors show ground-truth boxes in yellow and output detections in red. After solving their graphical model based on temporal coherence, some of the detections are considered as false positives (purple), while other boxes are added as false negatives (green).
The video sequences are captured at 25 fps with a random length between 10 and 30 seconds. The authors have generated one subset with the default parameters and three smaller subsets with altered conditions. The first subset consists of 150 sequences, which amounts to 75% of all the data, with the default settings, i.e. containing cars, pedestrians, and cyclists, under different daily conditions, but only in the city and highway areas. The second subset contains 36 sequences
(20% of the dataset) captured in the town area instead. The night condition only represents 3% of the whole data (6 sequences) and it is fully contained in the third subset. Finally, they have added wheelchairs and removed cars in the fourth subset, which represents the 2% of the dataset with only 5 sequences. The test set contains 85 sequences with balanced distributions on areas and conditions (except winter) on the three main classes plus another 12 sequences including wheelchairs. All images are automatically annotated with 2D bounding boxes and class labels for every object that can be reasonably seen (more than 50 pixels).
SYNTHIA-AL data distribution. Seq. indicates the number of videos. Environment conditions are Fall (F), Winter (W), Spring (S), Rain ®, and Night (N). Areas are City ©, Town (T), and Highway (H). The spawning probabilities are given for pedestrians (Pe),cyclists (Cy), cars (Ca), and wheelchairs (Wh).
Dataset features
- XLarge Volume of Data & Groundtruth: +200,000 HD images from video streams, +20,000 HD images from independent snapshots,
- Scene Diversity: european style town, modern city, highway, green areas,
- Variety of Dynamic Objects: cars, pedestrians, cyclists,
- Multiple Seasons: dedicated themes for winter, fall, spring, and summer,
- Lighting Conditions and Weather: dynamic lights and shadows, several day-time modes, rain mode, night mode,
- Sensor Simulation: 8 RGB cameras forming a binocular 360º camera, 8 depth sensors
- Automatic Groundtruth: individual instances for: semantic segmentation (pixelwise annotations), depth, car ego-motion.
 Homepage
 Research Paper
Summary #
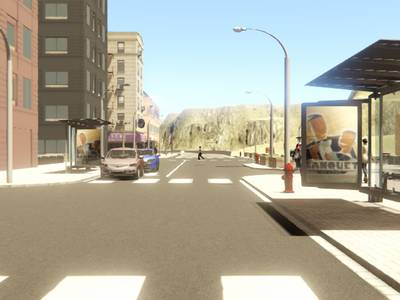
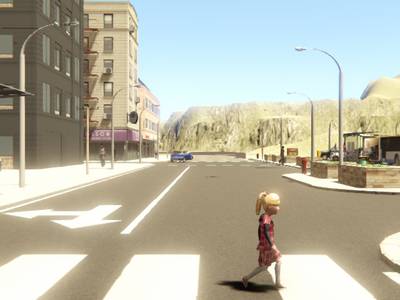
SYNTHIA: The SYNTHetic collection of Imagery and Annotations is a dataset for semantic segmentation and object detection tasks. It is used in the automotive industry.
The dataset consists of 284700 images with 13259180 labeled objects belonging to 18 different classes including road, sky, car, and other: vegetation, fence, sidewalk, building, pole, pedestrian, terrain, traffic sign, traffic light, bicycle, void, van, truck, wheelchair, and cyclist.
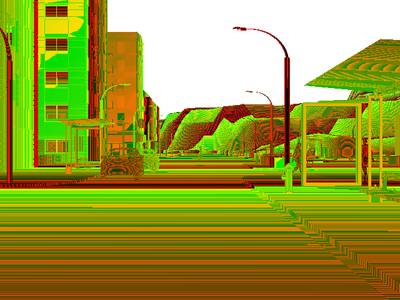
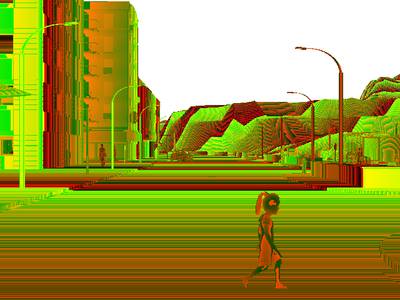
Images in the SYNTHIA-AL dataset have . All images are labeled (i.e. with annotations). There are 2 splits in the dataset: train (192950 images) and test (91750 images). Additionally, original images and depth images are grouped by im_id. Also every image contains information about its subfolder. Explore it in supervisely labeling tool. Each bbox label contain its observation angle tag. The dataset was released in 2021 by the Computer Vision Center, Barcelona.
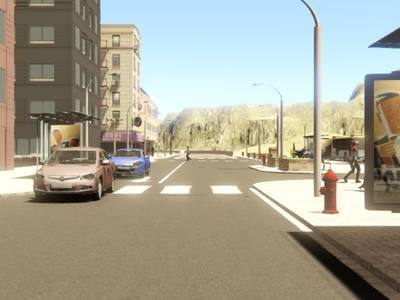
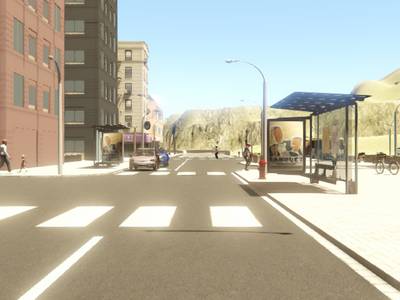
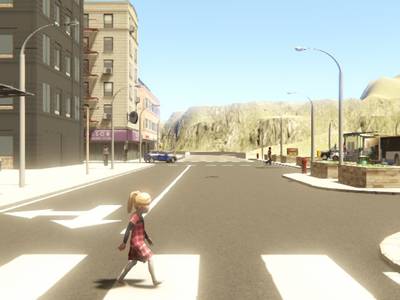
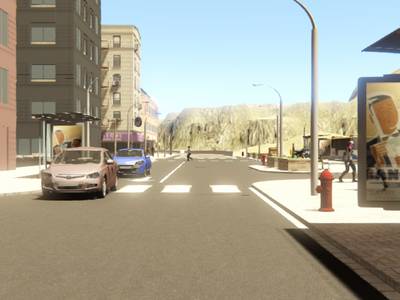
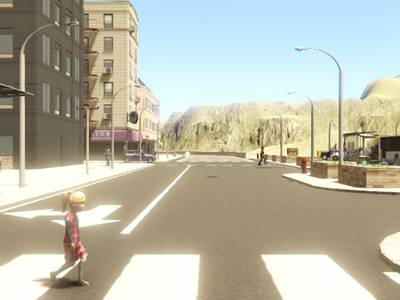
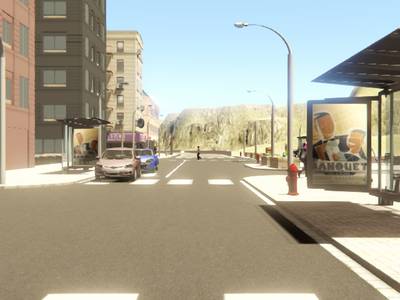
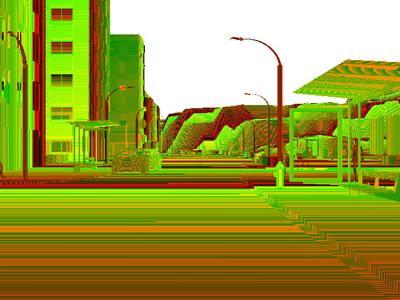
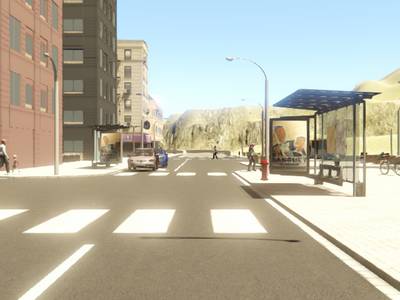
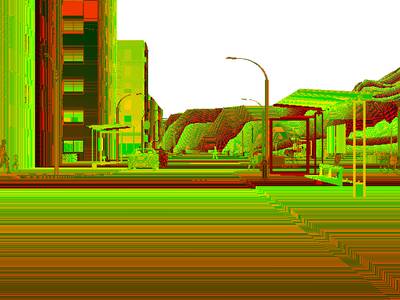
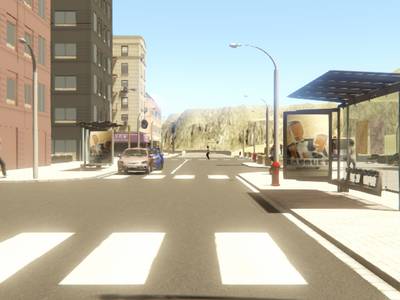
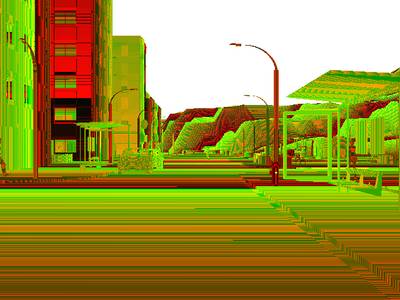
Here are the visualized examples for the classes:
Explore #
SYNTHIA-AL dataset has 284700 images. Click on one of the examples below or open "Explore" tool anytime you need to view dataset images with annotations. This tool has extended visualization capabilities like zoom, translation, objects table, custom filters and more. Hover the mouse over the images to hide or show annotations.


Class balance #
There are 18 annotation classes in the dataset. Find the general statistics and balances for every class in the table below. Click any row to preview images that have labels of the selected class. Sort by column to find the most rare or prevalent classes.

Class ㅤ | Images ㅤ | Objects ㅤ | Count on image average | Area on image average |
|---|---|---|---|---|
road➔ any | 284010 | 1248386 | 4.4 | 29.04% |
sky➔ any | 246668 | 1216274 | 4.93 | 19.95% |
car➔ any | 188450 | 723646 | 3.84 | 12.54% |
vegetation➔ any | 186026 | 1065364 | 5.73 | 5.01% |
fence➔ any | 182448 | 766486 | 4.2 | 4.98% |
sidewalk➔ any | 179846 | 1140636 | 6.34 | 6.88% |
building➔ any | 175348 | 1605234 | 9.15 | 29.97% |
pole➔ any | 170516 | 1621196 | 9.51 | 1.7% |
pedestrian➔ any | 150500 | 944578 | 6.28 | 1.22% |
terrain➔ any | 148854 | 1112544 | 7.47 | 22.85% |
Images #
Explore every single image in the dataset with respect to the number of annotations of each class it has. Click a row to preview selected image. Sort by any column to find anomalies and edge cases. Use horizontal scroll if the table has many columns for a large number of classes in the dataset.
Class sizes #
The table below gives various size properties of objects for every class. Click a row to see the image with annotations of the selected class. Sort columns to find classes with the smallest or largest objects or understand the size differences between classes.
Class | Object count | Avg area | Max area | Min area | Min height | Min height | Max height | Max height | Avg height | Avg height | Min width | Min width | Max width | Max width |
|---|---|---|---|---|---|---|---|---|---|---|---|---|---|---|
pole any | 1621196 | 0.18% | 8.59% | 0.01% | 1px | 0.21% | 480px | 100% | 80px | 16.73% | 1px | 0.16% | 314px | 49.06% |
building any | 1605234 | 3.27% | 73.15% | 0.01% | 1px | 0.21% | 388px | 80.83% | 73px | 15.17% | 1px | 0.16% | 640px | 100% |
road any | 1248386 | 6.61% | 50.49% | 0.01% | 1px | 0.21% | 318px | 66.25% | 66px | 13.72% | 1px | 0.16% | 640px | 100% |
sky any | 1216274 | 4.05% | 45.58% | 0.01% | 1px | 0.21% | 254px | 52.92% | 60px | 12.53% | 1px | 0.16% | 640px | 100% |
sidewalk any | 1140636 | 1.09% | 44.07% | 0.01% | 1px | 0.21% | 240px | 50% | 32px | 6.76% | 1px | 0.16% | 640px | 100% |
terrain any | 1112544 | 3.06% | 57.3% | 0.01% | 1px | 0.21% | 445px | 92.71% | 43px | 8.98% | 1px | 0.16% | 640px | 100% |
vegetation any | 1065364 | 0.88% | 50.93% | 0.01% | 1px | 0.21% | 474px | 98.75% | 44px | 9.16% | 1px | 0.16% | 640px | 100% |
pedestrian any | 944578 | 0.26% | 100% | 0.01% | 3px | 0.62% | 480px | 100% | 41px | 8.61% | 1px | 0.16% | 640px | 100% |
traffic light any | 848478 | 0.06% | 2.35% | 0% | 1px | 0.21% | 128px | 26.67% | 16px | 3.29% | 1px | 0.16% | 83px | 12.97% |
fence any | 766486 | 1.18% | 19.48% | 0.01% | 1px | 0.21% | 255px | 53.12% | 39px | 8.02% | 1px | 0.16% | 640px | 100% |
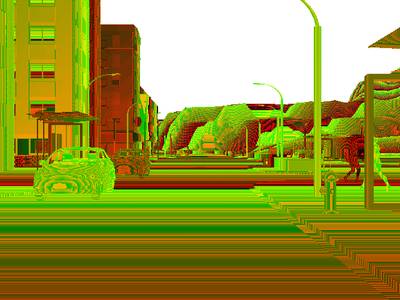
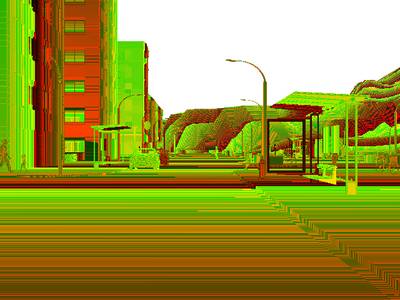
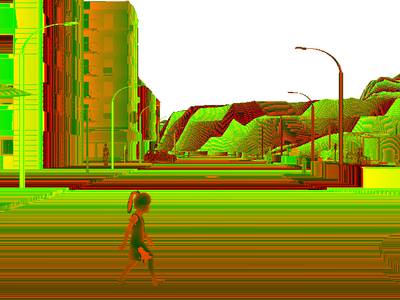
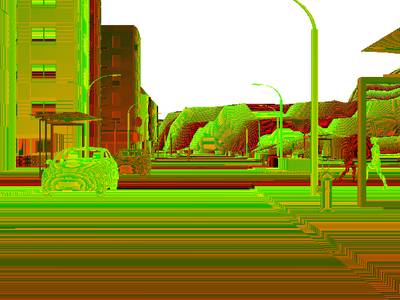
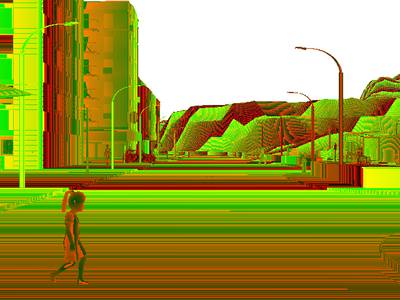
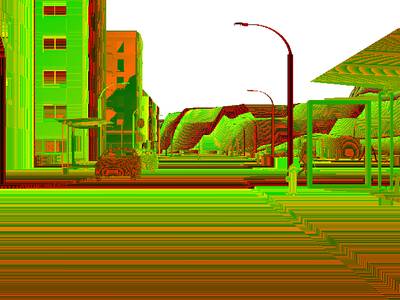
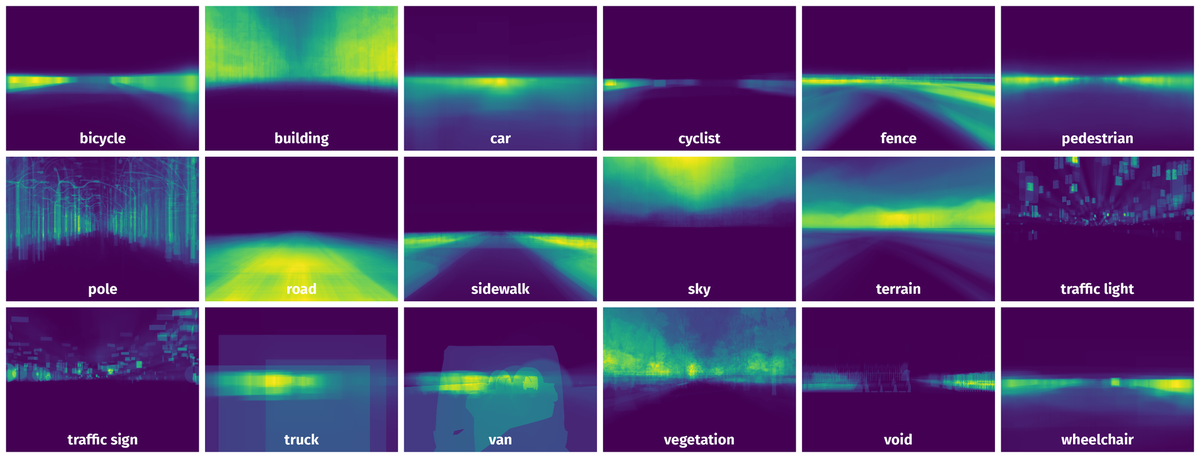
Spatial Heatmap #
The heatmaps below give the spatial distributions of all objects for every class. These visualizations provide insights into the most probable and rare object locations on the image. It helps analyze objects' placements in a dataset.
Objects #
Table contains all 101448 objects. Click a row to preview an image with annotations, and use search or pagination to navigate. Sort columns to find outliers in the dataset.
Object ID ㅤ | Class ㅤ | Image name click row to open | Image size height x width | Height ㅤ | Height ㅤ | Width ㅤ | Width ㅤ | Area ㅤ |
|---|---|---|---|---|---|---|---|---|
1➔ | road any | 11segs_weather_4_spawn_1_roadTexture_2_19-10-2018_15-30-02_depth_000205.png | 480 x 640 | 134px | 27.92% | 614px | 95.94% | 17.72% |
2➔ | road any | 11segs_weather_4_spawn_1_roadTexture_2_19-10-2018_15-30-02_depth_000205.png | 480 x 640 | 6px | 1.25% | 25px | 3.91% | 0.02% |
3➔ | road any | 11segs_weather_4_spawn_1_roadTexture_2_19-10-2018_15-30-02_depth_000205.png | 480 x 640 | 28px | 5.83% | 2px | 0.31% | 0.01% |
4➔ | road any | 11segs_weather_4_spawn_1_roadTexture_2_19-10-2018_15-30-02_depth_000205.png | 480 x 640 | 93px | 19.38% | 640px | 100% | 9.97% |
5➔ | sidewalk any | 11segs_weather_4_spawn_1_roadTexture_2_19-10-2018_15-30-02_depth_000205.png | 480 x 640 | 43px | 8.96% | 282px | 44.06% | 2.14% |
6➔ | sidewalk any | 11segs_weather_4_spawn_1_roadTexture_2_19-10-2018_15-30-02_depth_000205.png | 480 x 640 | 78px | 16.25% | 265px | 41.41% | 2.97% |
7➔ | sidewalk any | 11segs_weather_4_spawn_1_roadTexture_2_19-10-2018_15-30-02_depth_000205.png | 480 x 640 | 19px | 3.96% | 3px | 0.47% | 0.01% |
8➔ | sidewalk any | 11segs_weather_4_spawn_1_roadTexture_2_19-10-2018_15-30-02_depth_000205.png | 480 x 640 | 131px | 27.29% | 132px | 20.62% | 3.25% |
9➔ | building any | 11segs_weather_4_spawn_1_roadTexture_2_19-10-2018_15-30-02_depth_000205.png | 480 x 640 | 269px | 56.04% | 267px | 41.72% | 18.52% |
10➔ | building any | 11segs_weather_4_spawn_1_roadTexture_2_19-10-2018_15-30-02_depth_000205.png | 480 x 640 | 20px | 4.17% | 48px | 7.5% | 0.11% |
License #
SYNTHIA: The SYNTHetic collection of Imagery and Annotations is under CC BY-NC-SA 3.0 US license.
Citation #
If you make use of the SYNTHIA-AL data, please cite the following reference:
@dataset{SYNTHIA-AL,
  author={Javad Zolfaghari Bengar and Abel Gonzalez-Garcia1 Gabriel Villalonga and Bogdan Raducanu and Hamed H. Aghdam1 Mikhail Mozerov and Antonio M. Lopez and Joost van de Weijer},
  title={SYNTHIA: The SYNTHetic collection of Imagery and Annotations},
  year={2021},
  url={https://synthia-dataset.net/}
}
If you are happy with Dataset Ninja and use provided visualizations and tools in your work, please cite us:
@misc{ visualization-tools-for-synthia-all-dataset,
  title = { Visualization Tools for SYNTHIA-AL Dataset },
  type = { Computer Vision Tools },
  author = { Dataset Ninja },
  howpublished = { \url{ https://datasetninja.com/synthia-all } },
  url = { https://datasetninja.com/synthia-all },
  journal = { Dataset Ninja },
  publisher = { Dataset Ninja },
  year = { 2026 },
  month = { jul },
  note = { visited on 2026-07-22 },
}
Download #
Dataset SYNTHIA-AL can be downloaded in Supervisely format:
As an alternative, it can be downloaded with dataset-tools package:
pip install --upgrade dataset-tools
… using following python code:
import dataset_tools as dtools

dtools.download(dataset='SYNTHIA-AL', dst_dir='~/dataset-ninja/')
Make sure not to overlook the python code example available on the Supervisely Developer Portal. It will give you a clear idea of how to effortlessly work with the downloaded dataset.
The data in original format can be downloaded here:
Disclaimer #
Our gal from the legal dep told us we need to post this:
Dataset Ninja provides visualizations and statistics for some datasets that can be found online and can be downloaded by general audience. Dataset Ninja is not a dataset hosting platform and can only be used for informational purposes. The platform does not claim any rights for the original content, including images, videos, annotations and descriptions. Joint publishing is prohibited.
You take full responsibility when you use datasets presented at Dataset Ninja, as well as other information, including visualizations and statistics we provide. You are in charge of compliance with any dataset license and all other permissions. You are required to navigate datasets homepage and make sure that you can use it. In case of any questions, get in touch with us at hello@datasetninja.com.