

Introduction #
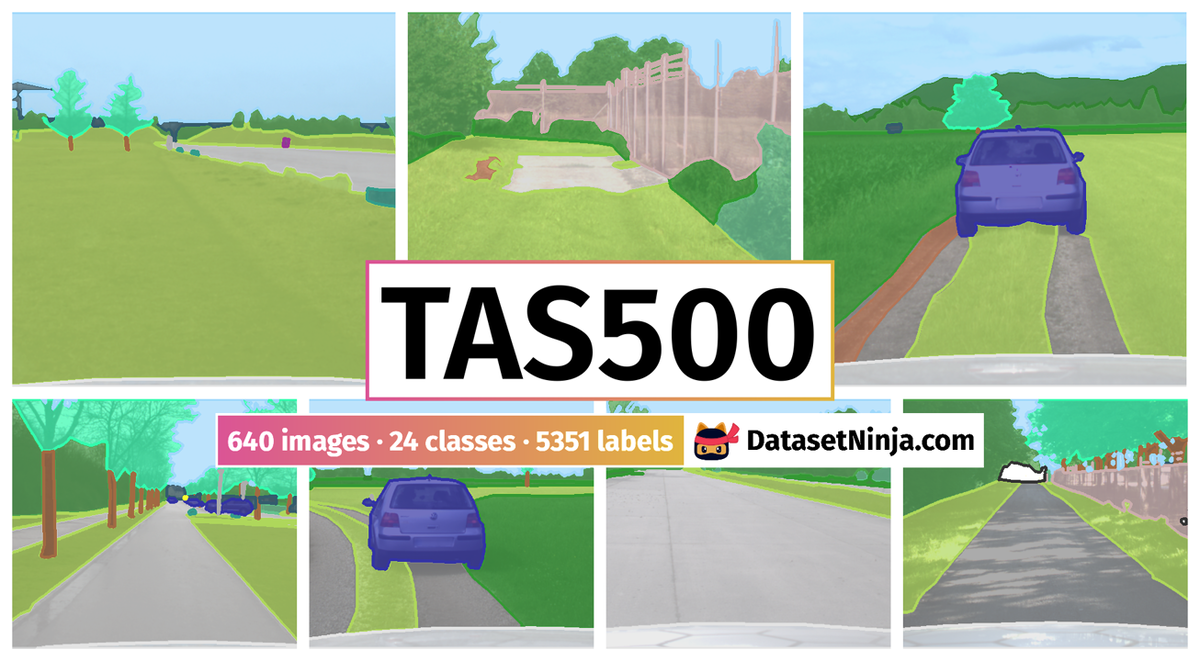
The TAS500: Semantic Segmentation Dataset For Autonomous Driving in Unstructured Environments is a unique dataset designed specifically for semantic segmentation in autonomous driving within unstructured environments. TAS500 provides detailed classifications of vegetation and terrain, enabling effective learning of drivable surfaces and natural obstacles in outdoor scenes. The authors highlight a significant gap in the research of autonomous driving for unstructured environments due to the scarcity of semantically labeled datasets, especially when compared to urban environments.
Research in autonomous driving for unstructured environments suffers from a lack of semantically labeled datasets compared to its urban counterpart. Urban and unstructured outdoor environments are challenging due to the varying lighting and weather conditions during a day and across seasons. TAS500 offers fine-grained vegetation and terrain classes to learn drivable surfaces and natural obstacles in outdoor scenes effectively. The authors evaluate the performance of modern semantic segmentation models with an additional focus on their efficiency. The authors experiments demonstrate the advantages of fine-grained semantic classes to improve the overall prediction accuracy, especially along the class boundaries.
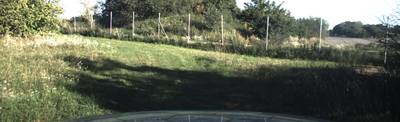
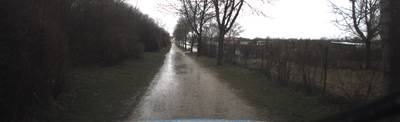
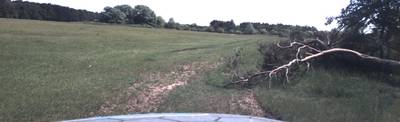
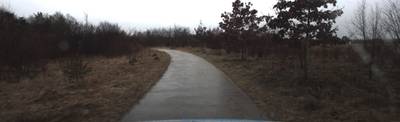
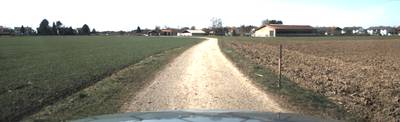
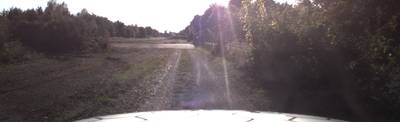
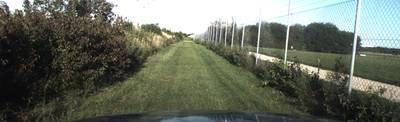
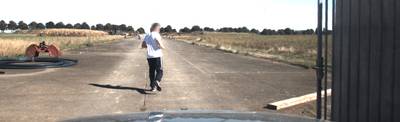
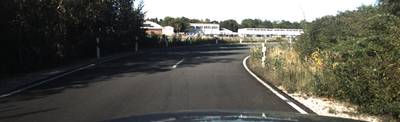
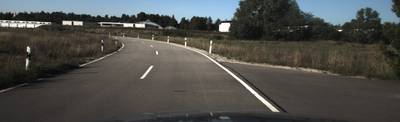
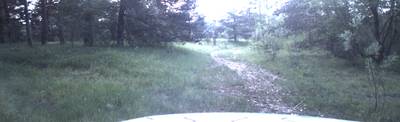
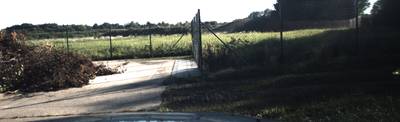
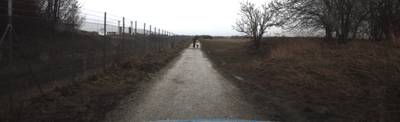
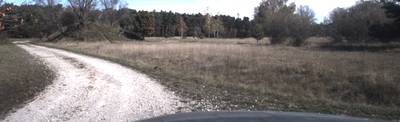
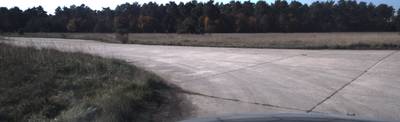
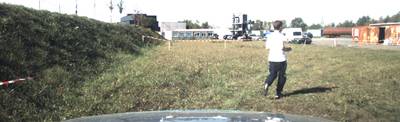
Semantic scene understanding is a key capability for autonomous robot navigation in real-world environments, but current research in autonomous driving focuses mainly on urban, suburban, and highway scenes. These scenes are considered as structured environments. In terms of their scene statistics, structured environments often provide more explicit object boundaries and contain objects with strong structural regularities. The authors are interested in robot navigation in unstructured environments, such as paths through forests and along fields. Here the occurrence of many semi-transparent classes such as tree foliage and the subtle color difference between vegetation types pose a challenge during image processing.
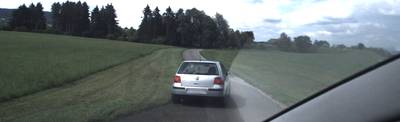
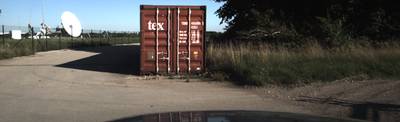
Apart from a robust detection of passable and impassable vegetation, the domain of robot navigation requires a real-time capability from the authors semantic segmentation model to be able to react to changes in the environment. The authors studied how a more fine-grained labeling policy affects the overall performance of the semantic segmentation in unstructured environments. That is, they want to distinguish between drivable (grass) and non-drivable vegetation (bush and tree trunk), and detect different kinds of drivable surfaces (asphalt, gravel, soil, sand).
Data acquisition
The authors’ goal is to improve understanding of the semantic scene in structured environments led to the development of TAS500 dataset. It contains more than
500 RGB images with pixel-level ground truth annotations for driving in unstructured outdoor environments. The data was collected using the autonomous vehicle
MuCAR-3. The authors vision system is mounted on a multifocal active/reactive camera platform called MarVEye. A camera sensor provides color images at 2.0 MP resolution. They recorded data with a frame rate of 10 Hz and cut off most of the sky and ego vehicle hood from all images. The final images have a resolution of 620 × 2026 px. Their label rate amounts to around 0.1 Hz, and they consequently provide a pixel-wise semantic mask for every hundredth recorded image. The authors provide fine-grained annotations at pixel level, they split up categories such as nature and flat to further subdivide vegetation as well as drivable surfaces. They annotated images from five test drives(Unfortunately, the authors did not provide information about the sequences).
Number of labeled frames and corresponding duration for the five annotated sequences in TAS500.
Annotation Process
The authors pixel-level semantic masks were labeled with a self-developed application, which works similar to the image annotation tool LabelMe, but their tool is also capable of annotating 3D point clouds. They use closed polygonal chains to label objects and structures in camera images; exactly one class label was assigned for every pixel. The annotation speed was increased by reusing the object boundaries and totaled approximately 45 min per frame, including a quality control process. The authors labeling policy defines 44 class labels that are categorized into nine groups (tagged as supercategory): animal construction, human, object, sky, terrain, vegetation, vehicle, and void. Moreover, they want to ensure compatibility with existing datasets. They therefore include most classes from the Cityscapes dataset but exclude rare classes. Thus they only use the classes car and bus from the vehicle category. They map infrequent classes such as rider to the closest corresponding category (here: person), while too specific class distinctions such as the classes street light and pole are consolidated into one super-class (here: pole). Through this process they arrive at 23 classes. The labeling policy for TAS500 was designed for driving in unstructured environments. Common objects were subdivided if they might require different planning behavior from an autonomous vehicle. Specifically vegetation classes can be split into drivable (e.g. high grass) and non-drivable vegetation (e.g. bush). The authors fine-grained vegetation annotations allow the distinction between passable (e.g. tree crown) and impassible (e.g. tree trunk) classes within the non-drivable vegetation subcategory. Passable vegetation covers any type of vegetation that an autonomous vehicle could graze during path planning.
Number of fine-grained pixels (y-axis) per class and their associated category (x-axis).
 Homepage
 Research Paper
Summary #
TAS500: Semantic Segmentation Dataset for Autonomous Driving in Unstructured Environments is a dataset for semantic segmentation and object detection tasks. It is used in the automotive and robotics industries.
The dataset consists of 640 images with 5351 labeled objects belonging to 24 different classes including ego vehicle, low grass, forest, and other: sky, high grass, gravel, bush, tree trunk, building, asphalt, tree crown, pole, misc. object, fence, soil, misc. vegetation, car, wall, traffic sign, person, animal, bus, undefined, and sand.
Images in the TAS500 dataset have pixel-level semantic segmentation annotations. There are 100 (16% of the total) unlabeled images (i.e. without annotations). There are 3 splits in the dataset: train (440 images), test (100 images), and val (100 images). Additionally, each label has supercategory tag. Explore it in supervisely labeling tool. The dataset was released in 2021 by the Institute for Autonomous Systems Technology, Bundeswehr University Munich, Germany.
Explore #
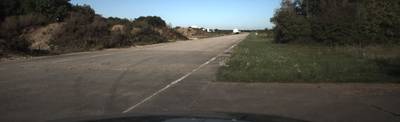
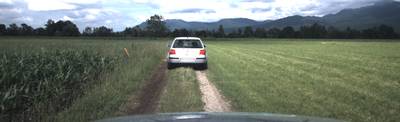
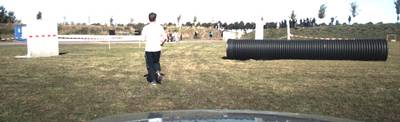
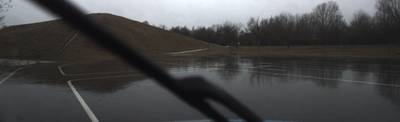
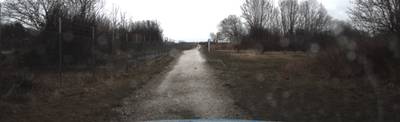
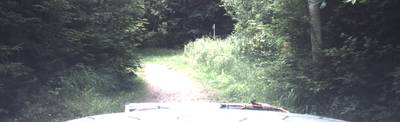
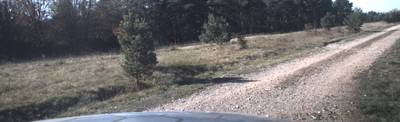
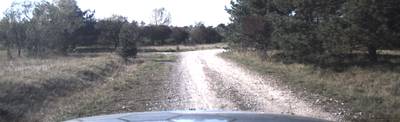
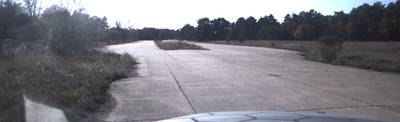
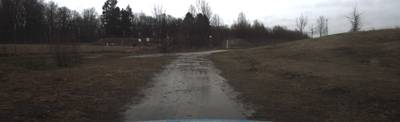
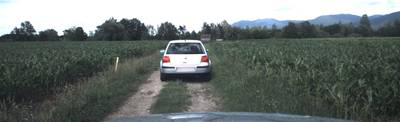
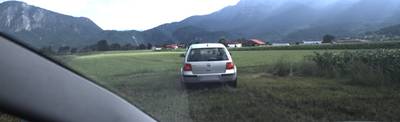
TAS500 dataset has 640 images. Click on one of the examples below or open "Explore" tool anytime you need to view dataset images with annotations. This tool has extended visualization capabilities like zoom, translation, objects table, custom filters and more. Hover the mouse over the images to hide or show annotations.


Class balance #
There are 24 annotation classes in the dataset. Find the general statistics and balances for every class in the table below. Click any row to preview images that have labels of the selected class. Sort by column to find the most rare or prevalent classes.

Class ㅤ | Images ㅤ | Objects ㅤ | Count on image average | Area on image average |
|---|---|---|---|---|
ego vehicle➔ mask | 539 | 539 | 1 | 4.76% |
low grass➔ mask | 526 | 526 | 1 | 20.58% |
forest➔ mask | 516 | 516 | 1 | 17.63% |
sky➔ mask | 499 | 499 | 1 | 11.09% |
high grass➔ mask | 455 | 455 | 1 | 20.07% |
gravel➔ mask | 349 | 349 | 1 | 10.48% |
bush➔ mask | 303 | 303 | 1 | 8.28% |
tree trunk➔ mask | 291 | 291 | 1 | 1.03% |
building➔ mask | 262 | 262 | 1 | 2.91% |
asphalt➔ mask | 229 | 229 | 1 | 22.17% |
Co-occurrence matrix #
Co-occurrence matrix is an extremely valuable tool that shows you the images for every pair of classes: how many images have objects of both classes at the same time. If you click any cell, you will see those images. We added the tooltip with an explanation for every cell for your convenience, just hover the mouse over a cell to preview the description.
Images #
Explore every single image in the dataset with respect to the number of annotations of each class it has. Click a row to preview selected image. Sort by any column to find anomalies and edge cases. Use horizontal scroll if the table has many columns for a large number of classes in the dataset.
Object distribution #
Interactive heatmap chart for every class with object distribution shows how many images are in the dataset with a certain number of objects of a specific class. Users can click cell and see the list of all corresponding images.
Class sizes #
The table below gives various size properties of objects for every class. Click a row to see the image with annotations of the selected class. Sort columns to find classes with the smallest or largest objects or understand the size differences between classes.
Class | Object count | Avg area | Max area | Min area | Min height | Min height | Max height | Max height | Avg height | Avg height | Min width | Min width | Max width | Max width |
|---|---|---|---|---|---|---|---|---|---|---|---|---|---|---|
ego vehicle mask | 539 | 4.76% | 21.77% | 0.22% | 10px | 1.61% | 620px | 100% | 92px | 14.8% | 381px | 18.81% | 2026px | 100% |
low grass mask | 526 | 20.58% | 64.15% | 0.03% | 12px | 1.94% | 620px | 100% | 390px | 62.95% | 46px | 2.27% | 2026px | 100% |
forest mask | 516 | 17.63% | 76.37% | 0% | 6px | 0.97% | 620px | 100% | 255px | 41.2% | 10px | 0.49% | 2026px | 100% |
sky mask | 499 | 11.09% | 37.44% | 0.01% | 8px | 1.29% | 299px | 48.23% | 152px | 24.58% | 14px | 0.69% | 2026px | 100% |
high grass mask | 455 | 20.07% | 54.9% | 0.04% | 15px | 2.42% | 620px | 100% | 367px | 59.25% | 31px | 1.53% | 2026px | 100% |
gravel mask | 349 | 10.48% | 48.92% | 0.03% | 8px | 1.29% | 571px | 92.1% | 342px | 55.18% | 45px | 2.22% | 2026px | 100% |
bush mask | 303 | 8.28% | 43.1% | 0.02% | 9px | 1.45% | 620px | 100% | 255px | 41.16% | 17px | 0.84% | 2026px | 100% |
tree trunk mask | 291 | 1.03% | 12.2% | 0% | 6px | 0.97% | 620px | 100% | 168px | 27.06% | 1px | 0.05% | 2026px | 100% |
building mask | 262 | 2.91% | 38.4% | 0% | 5px | 0.81% | 620px | 100% | 114px | 18.46% | 6px | 0.3% | 2026px | 100% |
asphalt mask | 229 | 22.17% | 57.88% | 0.01% | 6px | 0.97% | 525px | 84.68% | 312px | 50.27% | 30px | 1.48% | 2026px | 100% |
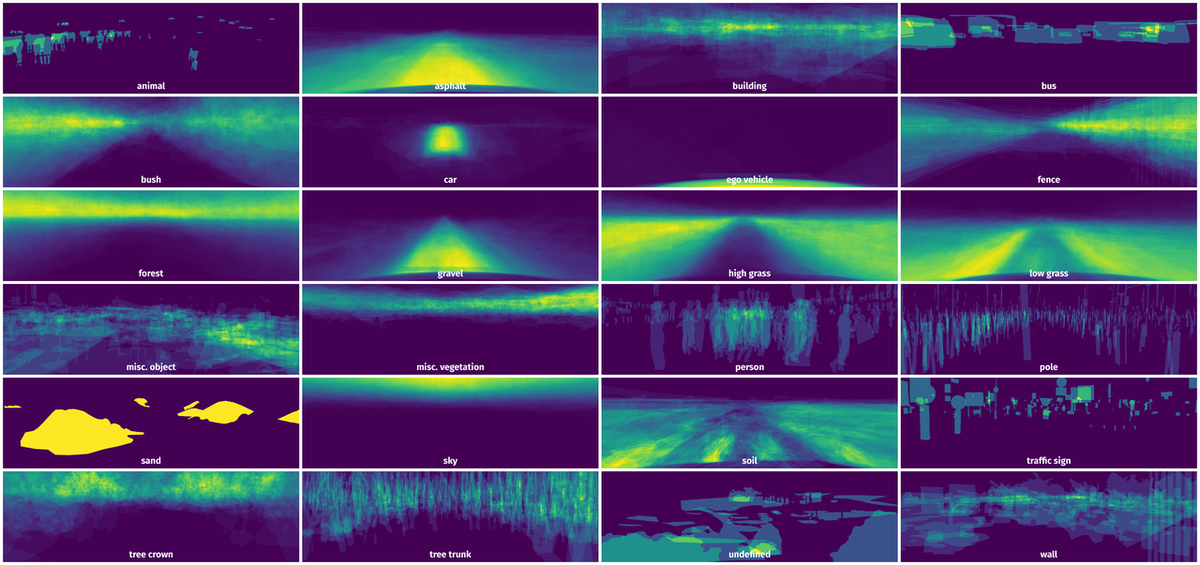
Spatial Heatmap #
The heatmaps below give the spatial distributions of all objects for every class. These visualizations provide insights into the most probable and rare object locations on the image. It helps analyze objects' placements in a dataset.
Objects #
Table contains all 5351 objects. Click a row to preview an image with annotations, and use search or pagination to navigate. Sort columns to find outliers in the dataset.
Object ID ㅤ | Class ㅤ | Image name click row to open | Image size height x width | Height ㅤ | Height ㅤ | Width ㅤ | Width ㅤ | Area ㅤ |
|---|---|---|---|---|---|---|---|---|
1➔ | asphalt mask | 1537962128147919501.png | 620 x 2026 | 257px | 41.45% | 1111px | 54.84% | 14.74% |
2➔ | low grass mask | 1537962128147919501.png | 620 x 2026 | 162px | 26.13% | 628px | 31% | 6.74% |
3➔ | high grass mask | 1537962128147919501.png | 620 x 2026 | 132px | 21.29% | 698px | 34.45% | 5.16% |
4➔ | tree crown mask | 1537962128147919501.png | 620 x 2026 | 74px | 11.94% | 12px | 0.59% | 0.05% |
5➔ | tree trunk mask | 1537962128147919501.png | 620 x 2026 | 13px | 2.1% | 5px | 0.25% | 0% |
6➔ | building mask | 1537962128147919501.png | 620 x 2026 | 397px | 64.03% | 566px | 27.94% | 7.93% |
7➔ | car mask | 1537962128147919501.png | 620 x 2026 | 620px | 100% | 1208px | 59.62% | 42.74% |
8➔ | sky mask | 1537962128147919501.png | 620 x 2026 | 162px | 26.13% | 2026px | 100% | 13.39% |
9➔ | ego vehicle mask | 1537962128147919501.png | 620 x 2026 | 334px | 53.87% | 677px | 33.42% | 9.26% |
10➔ | asphalt mask | 1537962174754592575.png | 620 x 2026 | 74px | 11.94% | 895px | 44.18% | 0.8% |
License #
TAS500: semantic segmentation dataset for autonomous driving in unstructured environments is under CC BY-NC-SA 3.0 US license.
Citation #
If you make use of the TAS500 data, please cite the following reference:
@InProceedings{tas:metzger2020icpr-dataset-semantic-segmentation,
  author    = {Kai A. Metzger AND Peter Mortimer AND Hans-Joachim Wuensche},
  title     = {{A Fine-Grained Dataset and its Efficient Semantic Segmentation for Unstructured Driving Scenarios}},
  booktitle = {International Conference on Pattern Recognition (ICPR2020)},
  year      = {2021},
  address   = {Milano, Italy (Virtual Conference)},
  month     = jan,
}
If you are happy with Dataset Ninja and use provided visualizations and tools in your work, please cite us:
@misc{ visualization-tools-for-tas500-dataset,
  title = { Visualization Tools for TAS500 Dataset },
  type = { Computer Vision Tools },
  author = { Dataset Ninja },
  howpublished = { \url{ https://datasetninja.com/tas500 } },
  url = { https://datasetninja.com/tas500 },
  journal = { Dataset Ninja },
  publisher = { Dataset Ninja },
  year = { 2026 },
  month = { jul },
  note = { visited on 2026-07-23 },
}
Download #
Dataset TAS500 can be downloaded in Supervisely format:
As an alternative, it can be downloaded with dataset-tools package:
pip install --upgrade dataset-tools
… using following python code:
import dataset_tools as dtools

dtools.download(dataset='TAS500', dst_dir='~/dataset-ninja/')
Make sure not to overlook the python code example available on the Supervisely Developer Portal. It will give you a clear idea of how to effortlessly work with the downloaded dataset.
The data in original format can be downloaded here.
Disclaimer #
Our gal from the legal dep told us we need to post this:
Dataset Ninja provides visualizations and statistics for some datasets that can be found online and can be downloaded by general audience. Dataset Ninja is not a dataset hosting platform and can only be used for informational purposes. The platform does not claim any rights for the original content, including images, videos, annotations and descriptions. Joint publishing is prohibited.
You take full responsibility when you use datasets presented at Dataset Ninja, as well as other information, including visualizations and statistics we provide. You are in charge of compliance with any dataset license and all other permissions. You are required to navigate datasets homepage and make sure that you can use it. In case of any questions, get in touch with us at hello@datasetninja.com.