Introduction #
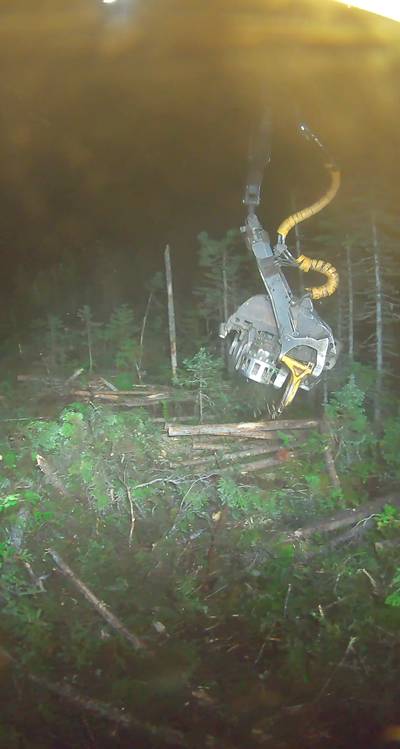
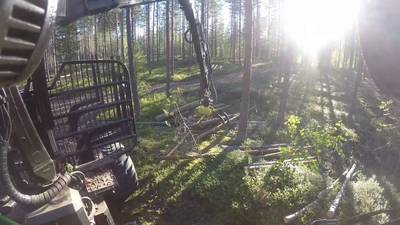
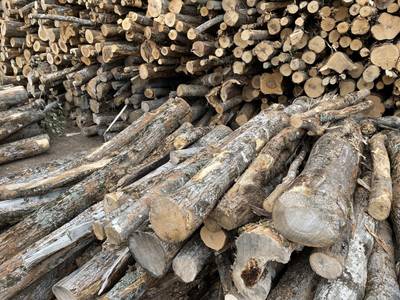
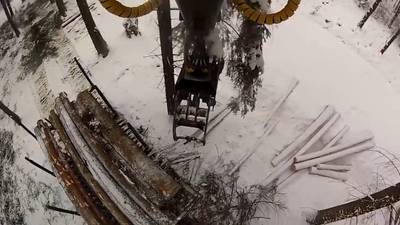
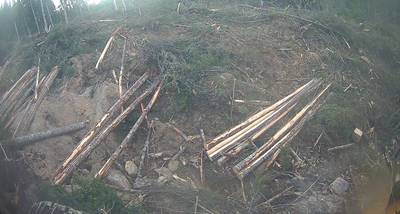
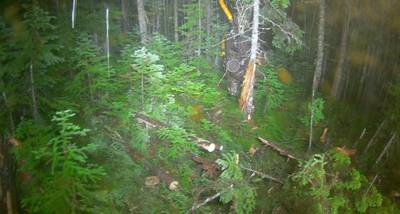
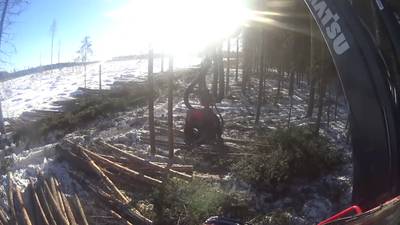
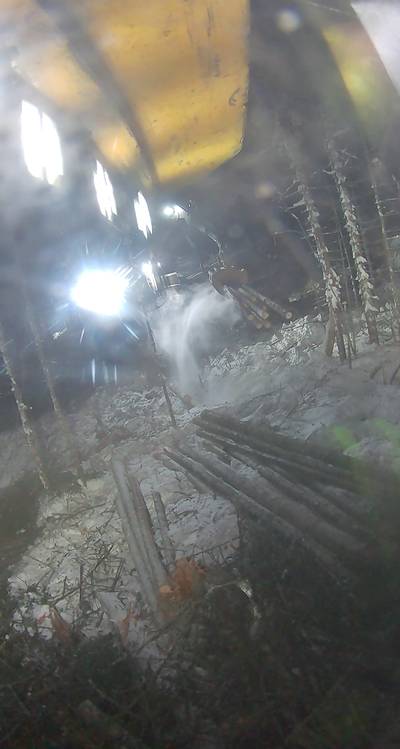
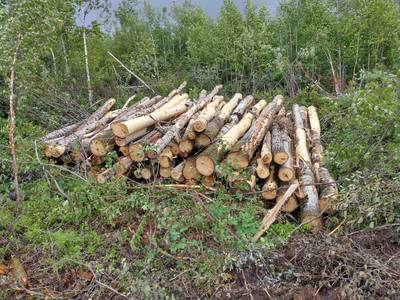
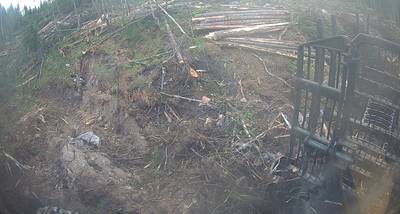
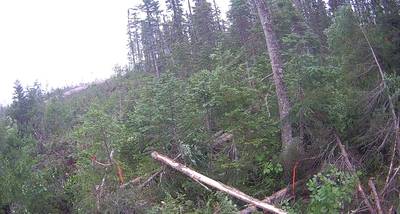
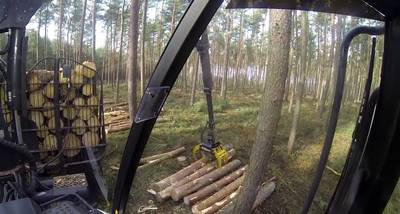
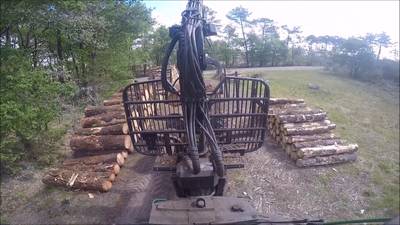
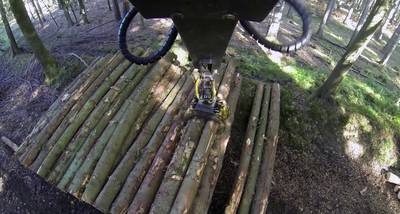
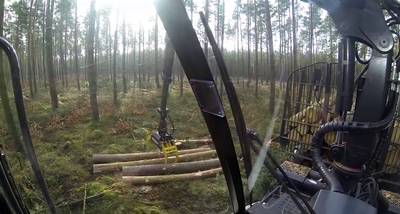
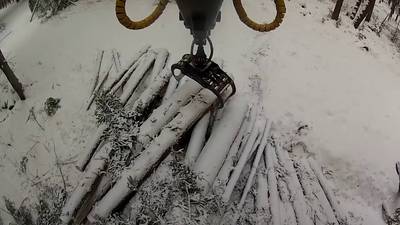
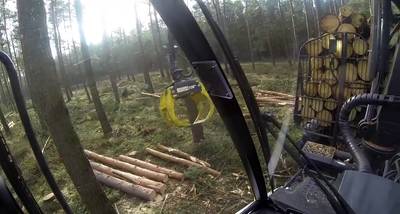
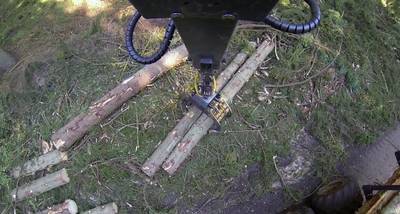
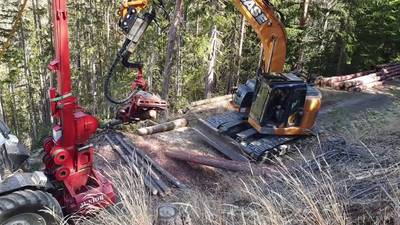
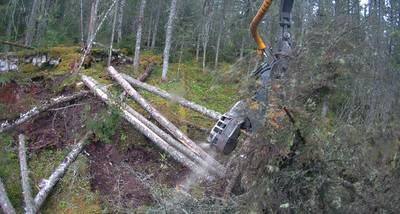
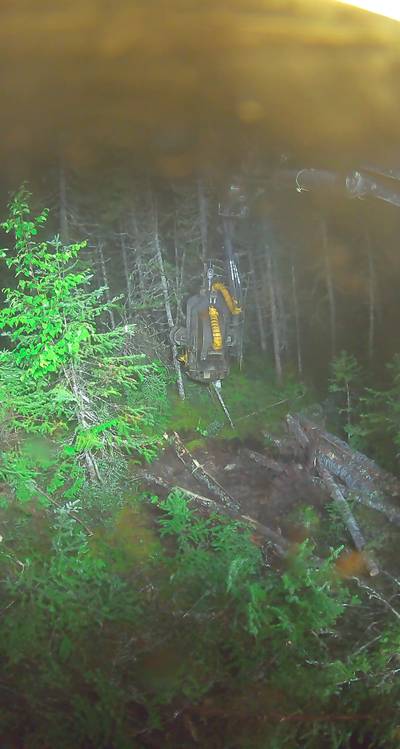
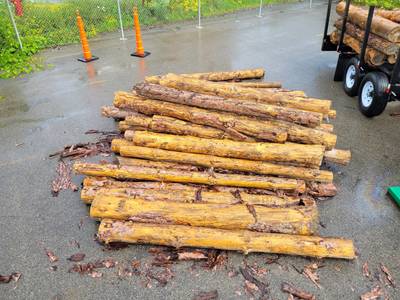
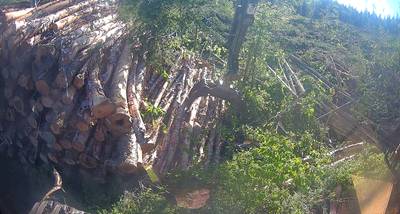
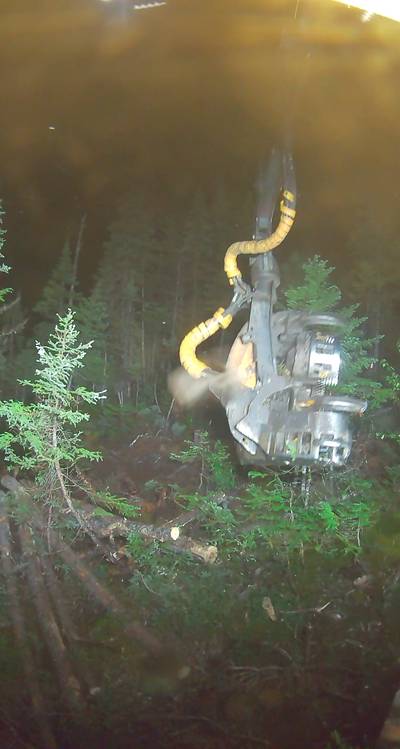
The TimberSeg 1.0 dataset is composed of 220 images showing wood logs in various environments and conditions in Canada. The images are densely annotated with segmentation masks for each log instance, as well as the corresponding bounding box and class label. This dataset aim towards enabling autonomous forestry forwarders, therefore it contains nearly 2500 instances of wood logs from an operators’ point-of-view. Images were taken in the forest, near the roadside, in lumberyards and above timber-filled trailers. The logs were annotated considering a grasping perspective, meaning that only the logs above the piles and accessible are segmented.
Motivation
The forestry sector has undergone significant mechanization efforts, yet there has been a notable lag in automating tasks that involve high-level cognitive functions. In contrast, industries like agriculture and mining have made substantial strides in automation over the past decade. Despite facing distinct challenges, the forestry sector is now making strides toward the integration of autonomous machines in both forest and mill operations.
Similar to the early automation of ore transportation in mining, the extraction of logs from the forest using heavy machinery is anticipated to be the initial focus for automation in forestry. Log picking, a crucial aspect of this process, poses challenges in terms of perception and manipulation. This exacerbates the persistent shortage of manpower in forestry operations, as new operators require extensive training to execute this repetitive task efficiently.
The authors’ system targets the segmentation of individual logs in RGB images captured by a camera positioned in or above the operator’s cabin. Detecting wood logs proves to be non-trivial due to their inherent cluttered nature. Logs, being elongated objects, are typically found scattered on the ground or in piles within recently harvested forests or lumberyards. Furthermore, logs often face partial occlusion, either from branches or other logs, complicating instance segmentation. Challenges such as variations in illumination and weather, particularly in northern countries like Canada or Sweden where forestry operations persist throughout winter in snowy conditions, further complicate the scenario.
To address these complexities, the authors have compiled a densely annotated dataset encompassing diverse scenarios, including piled and individual logs, various seasons, environments, illuminations, and perspectives.
Dataset Collection and Labeling
The TimberSeg 1.0 dataset, is composed of 220 images containing 2500 instances of wood logs in representative environments and dispositions. These images were carefully selected to capture typical viewpoints and situations that a forwarder or wood loader operator would operate with. Images have been collected in four types of environments.
Environment Types.
Forest corresponds mostly to scattered logs in freshly cut areas, whereas roadside consists of neatly piled logs ready to be transported. To compile the required data, we strategically installed three dashcams (VIOFO A129 Pro Duo 4K) on forestry forwarders operating in the vicinity of Lake Saint-Jean, Quebec, Canada. Each dashcam featured dual cameras affixed to the inner side of the cabin windows, with one camera capturing a forward view and the other capturing a sideways perspective. These dashcams meticulously recorded numerous hours of video content, spanning various resolutions (4K, 2K, 1080p) and encompassing diverse weather conditions, over several months.
Supplementing this dynamic video footage, we utilized a Canon EOS M50 digital camera to capture images in lumberyards associated with sawmills and paper mills. This included photographs taken from an elevated vantage point, offering perspectives of fully loaded timber trucks’ trailers. The amalgamation of these dynamic and static images, derived from both videos and the digital camera, contributes significant diversity to the dataset.
To enhance the dataset’s geographical representation, we incorporated additional images sourced from publicly available videos on the internet. This comprehensive approach ensures a rich and varied collection of data for our study. The forests images are predominant on purpose, as they exhibit harder visual conditions. The images contain a widely varying number of log instances, ranging from 1 to 29 logs, for an average of 11.3.
Logs per image.
The dataset curated by the authors underwent annotation through polygon mask segmentation facilitated by the SuperAnnotate tool. In the context of log picking, the focus was on detecting and segmenting exclusively the logs positioned atop a pile, as those not immediately accessible would become visible during the collection process. Consequently, a log was only segmented if it was within reach of the forwarder, excluding those covered by others or situated too far away.
Adopting a strategy akin to active learning methodologies, the authors leveraged their most accurate network, Mask2Former, to generate pre-annotations. This approach expedited the labeling process, allowing a human annotator to refine and correct errors introduced by the network rather than undertaking the segmentation task entirely from scratch.
Summary #
TimberSeg 1.0 is a dataset for instance segmentation, semantic segmentation, and object detection tasks. It is used in the forestry and robotics industries.
The dataset consists of 440 images with 10735 labeled objects belonging to 1 single class (wood).
Images in the TimberSeg dataset have pixel-level instance segmentation annotations. All images are labeled (i.e. with annotations). There are 2 splits in the dataset: original (220 images) and prescaled (220 images). The dataset was released in 2022 by the Northern Robotics Laboratory, Universite Laval, Canada.

Explore #
TimberSeg dataset has 440 images. Click on one of the examples below or open "Explore" tool anytime you need to view dataset images with annotations. This tool has extended visualization capabilities like zoom, translation, objects table, custom filters and more. Hover the mouse over the images to hide or show annotations.




























Class balance #
There are 1 annotation classes in the dataset. Find the general statistics and balances for every class in the table below. Click any row to preview images that have labels of the selected class. Sort by column to find the most rare or prevalent classes.
Class ㅤ | Images ㅤ | Objects ㅤ | Count on image average | Area on image average |
|---|---|---|---|---|
wood➔ any | 440 | 10735 | 24.4 | 25.34% |
Images #
Explore every single image in the dataset with respect to the number of annotations of each class it has. Click a row to preview selected image. Sort by any column to find anomalies and edge cases. Use horizontal scroll if the table has many columns for a large number of classes in the dataset.
Object distribution #
Interactive heatmap chart for every class with object distribution shows how many images are in the dataset with a certain number of objects of a specific class. Users can click cell and see the list of all corresponding images.
Class sizes #
The table below gives various size properties of objects for every class. Click a row to see the image with annotations of the selected class. Sort columns to find classes with the smallest or largest objects or understand the size differences between classes.
Class | Object count | Avg area | Max area | Min area | Min height | Min height | Max height | Max height | Avg height | Avg height | Min width | Min width | Max width | Max width |
|---|---|---|---|---|---|---|---|---|---|---|---|---|---|---|
wood any | 10735 | 2.85% | 78.04% | 0% | 2px | 0.26% | 3489px | 100% | 272px | 21.12% | 2px | 0.1% | 4608px | 100% |
Spatial Heatmap #
The heatmaps below give the spatial distributions of all objects for every class. These visualizations provide insights into the most probable and rare object locations on the image. It helps analyze objects' placements in a dataset.

Objects #
Table contains all 10735 objects. Click a row to preview an image with annotations, and use search or pagination to navigate. Sort columns to find outliers in the dataset.
Object ID ㅤ | Class ㅤ | Image name click row to open | Image size height x width | Height ㅤ | Height ㅤ | Width ㅤ | Width ㅤ | Area ㅤ |
|---|---|---|---|---|---|---|---|---|
1➔ | wood any | 000141.png | 3456 x 4608 | 884px | 25.58% | 202px | 4.38% | 0.55% |
2➔ | wood any | 000141.png | 3456 x 4608 | 884px | 25.58% | 202px | 4.38% | 1.12% |
3➔ | wood any | 000141.png | 3456 x 4608 | 401px | 11.6% | 134px | 2.91% | 0.22% |
4➔ | wood any | 000141.png | 3456 x 4608 | 401px | 11.6% | 133px | 2.89% | 0.33% |
5➔ | wood any | 000141.png | 3456 x 4608 | 535px | 15.48% | 198px | 4.3% | 0.39% |
6➔ | wood any | 000141.png | 3456 x 4608 | 535px | 15.48% | 198px | 4.3% | 0.67% |
7➔ | wood any | 000141.png | 3456 x 4608 | 282px | 8.16% | 494px | 10.72% | 0.18% |
8➔ | wood any | 000141.png | 3456 x 4608 | 418px | 12.09% | 480px | 10.42% | 0.3% |
9➔ | wood any | 000141.png | 3456 x 4608 | 766px | 22.16% | 1051px | 22.81% | 5.06% |
10➔ | wood any | 000141.png | 3456 x 4608 | 460px | 13.31% | 605px | 13.13% | 0.33% |
License #
Citation #
If you make use of the TimberSeg data, please cite the following reference:
@dataset{TimberSeg,
  author={Jean Michel Fortin and Olivier Gamache and Vincent Grondin and François Pomerleau and Philippe Giguère},
  title={TimberSeg 1.0},
  year={2022},
  url={https://data.mendeley.com/datasets/y5npsm3gkj/2}
}
If you are happy with Dataset Ninja and use provided visualizations and tools in your work, please cite us:
@misc{ visualization-tools-for-timber-seg-dataset,
  title = { Visualization Tools for TimberSeg Dataset },
  type = { Computer Vision Tools },
  author = { Dataset Ninja },
  howpublished = { \url{ https://datasetninja.com/timber-seg } },
  url = { https://datasetninja.com/timber-seg },
  journal = { Dataset Ninja },
  publisher = { Dataset Ninja },
  year = { 2026 },
  month = { feb },
  note = { visited on 2026-02-15 },
}
Download #
Dataset TimberSeg can be downloaded in Supervisely format:
As an alternative, it can be downloaded with dataset-tools package:
pip install --upgrade dataset-tools
… using following python code:
import dataset_tools as dtools

dtools.download(dataset='TimberSeg', dst_dir='~/dataset-ninja/')
Make sure not to overlook the python code example available on the Supervisely Developer Portal. It will give you a clear idea of how to effortlessly work with the downloaded dataset.
The data in original format can be downloaded here.
Disclaimer #
Our gal from the legal dep told us we need to post this:
Dataset Ninja provides visualizations and statistics for some datasets that can be found online and can be downloaded by general audience. Dataset Ninja is not a dataset hosting platform and can only be used for informational purposes. The platform does not claim any rights for the original content, including images, videos, annotations and descriptions. Joint publishing is prohibited.
You take full responsibility when you use datasets presented at Dataset Ninja, as well as other information, including visualizations and statistics we provide. You are in charge of compliance with any dataset license and all other permissions. You are required to navigate datasets homepage and make sure that you can use it. In case of any questions, get in touch with us at hello@datasetninja.com.


