

Introduction #
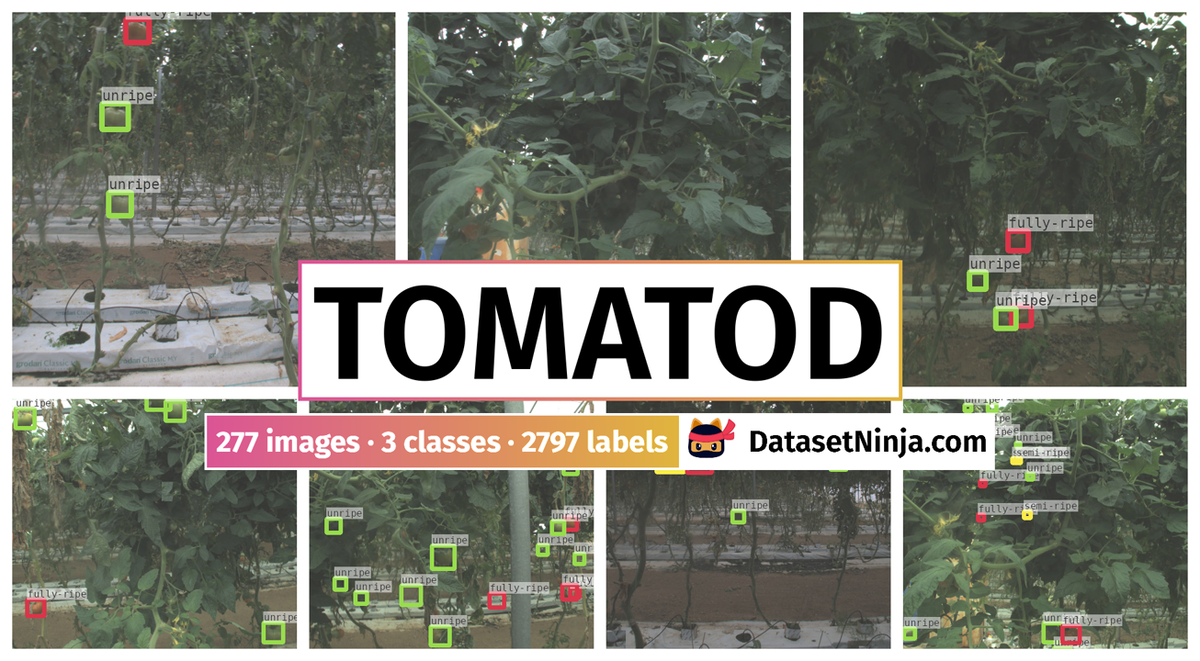
In their study, the authors of the tomatOD: Tomato Fruit Localization and Ripening Classification dataset focus on selective cropping and treatment tasks where learning algorithms can enhance crop growth and disease prediction, species recognition, and fruit detection. They introduce a specialized dataset for tomato fruit object detection and classification. This dataset consists of 277 images with 2418 annotated tomatoes and contains information about the ripening stage (unripe, semi-ripe, and fully ripe) of each tomato fruit along with its corresponding bounding box. Its purpose is to encourage the development of task-specific object detection algorithms for production-ready applications and to serve as a baseline for common state-of-the-art object detection algorithms.
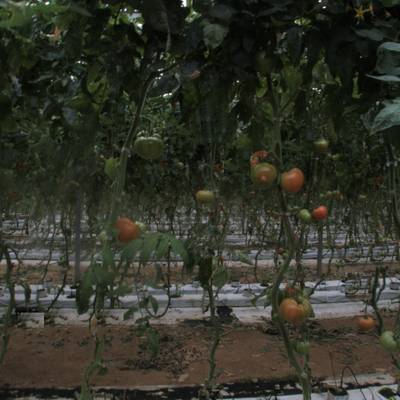
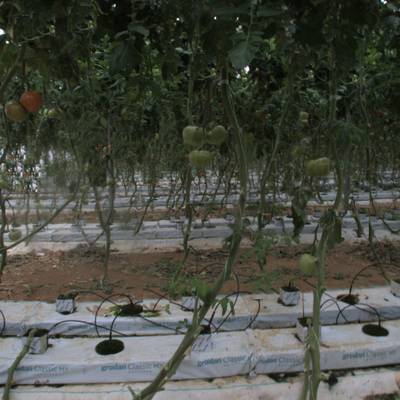
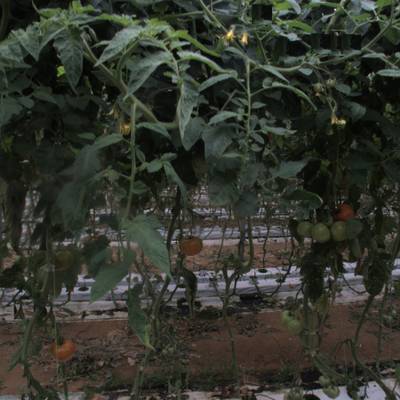
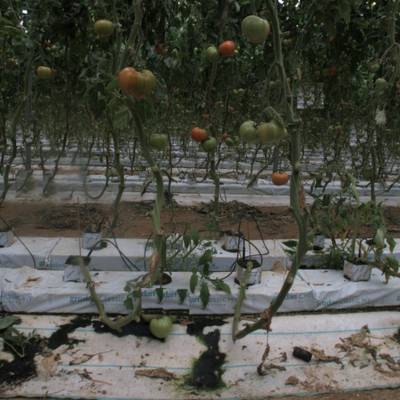
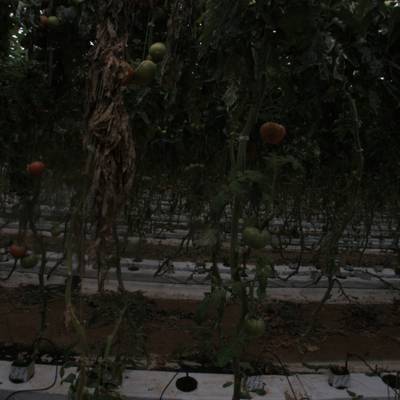
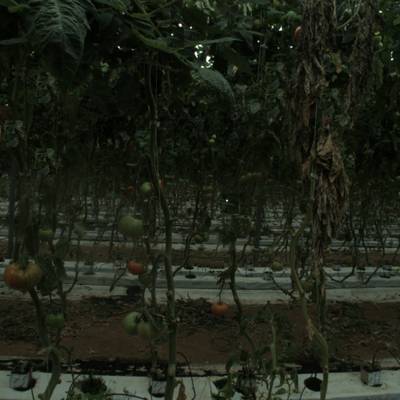
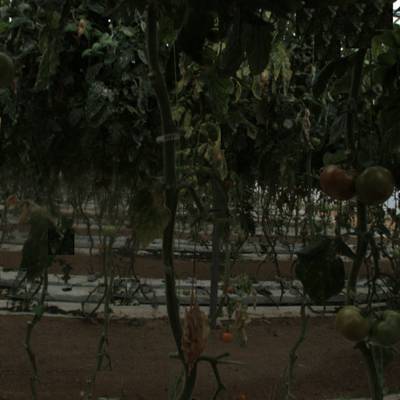
The tomatOD dataset is a novel collection created to simulate the scenario of a robotic arm navigating a soilless tomato cultivation greenhouse, mapping locations and estimating the ripening stages of each tomato fruit. The authors conducted data acquisition in a controlled environment, capturing images of tomato plants with varying ripening stages. The annotations were made manually by expert agriculturists, ensuring the accuracy of the training data for detection algorithms. The dataset’s statistical analysis reveals insights into the dataset’s content, including the relative size distribution (%) of bounding boxes, the number of labelled instances per image, and the number of categories in images.
Additionally, the authors propose an official 80%/20% train-test split for the dataset, ensuring that algorithms evaluated on it can provide easily comparable results. This split was determined using a semi-random approach, taking into account the dataset’s characteristics.
Overall, the TomatOD dataset serves as a valuable resource for developing and testing object detection algorithms tailored for tomato fruit detection and classification in the context of precision farming.
 Homepage
 Research Paper
Summary #
tomatOD: Tomato Fruit Localization and Ripening Classification is a dataset for an object detection task. It is used in the agricultural industry.
The dataset consists of 277 images with 2797 labeled objects belonging to 3 different classes including unripe, fully-ripe, and semi-ripe.
Images in the tomatOD dataset have bounding box annotations. All images are labeled (i.e. with annotations). There are 2 splits in the dataset: train (222 images) and test (55 images). The dataset was released in 2020 by the up2metric, Greece.
Explore #
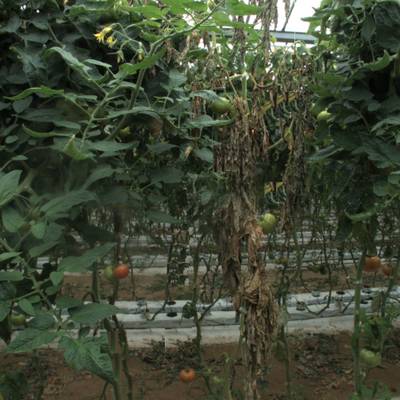
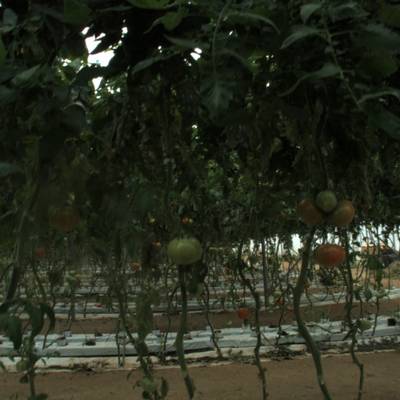
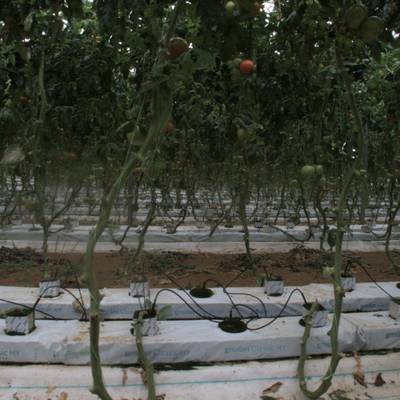
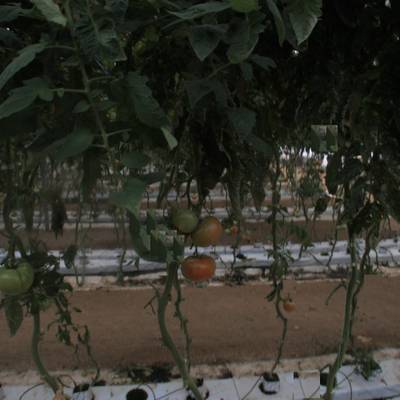
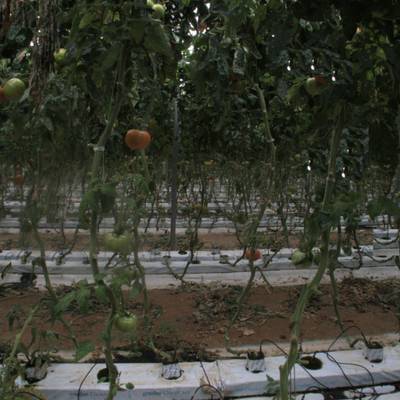
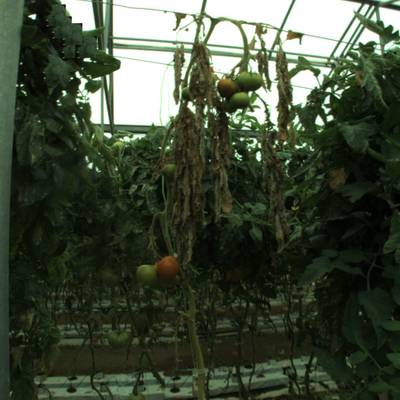
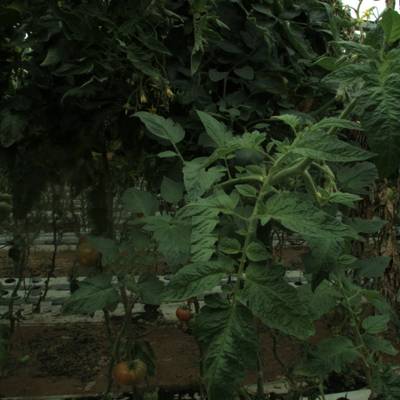
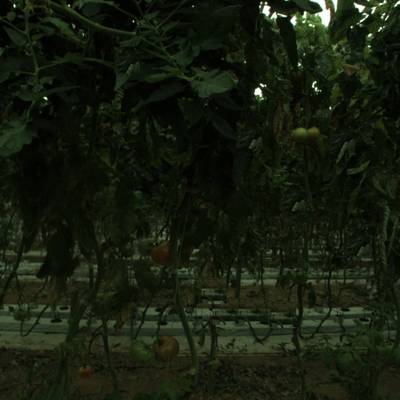
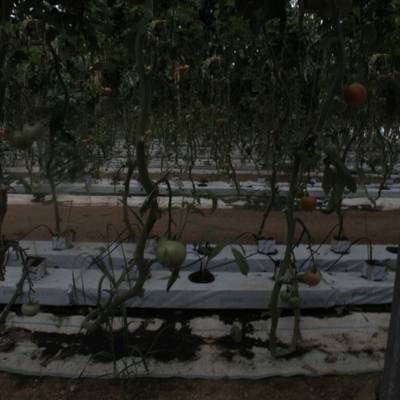
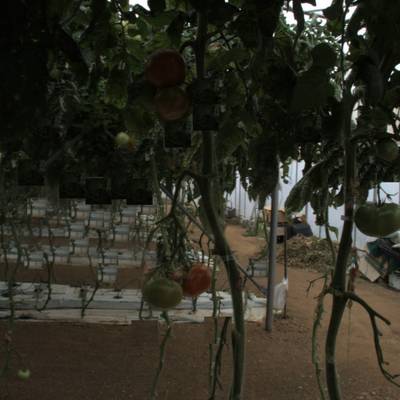
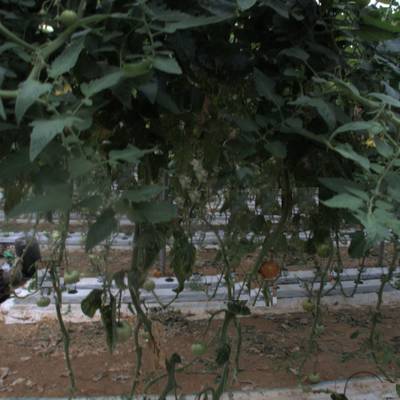
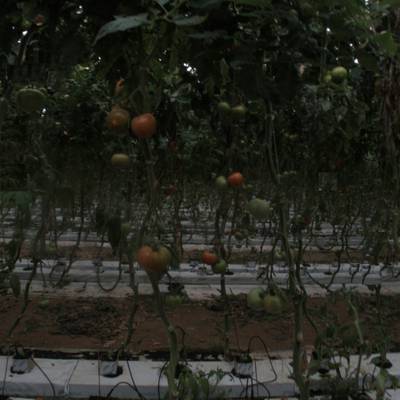
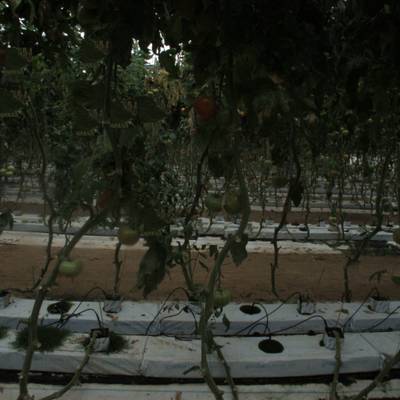
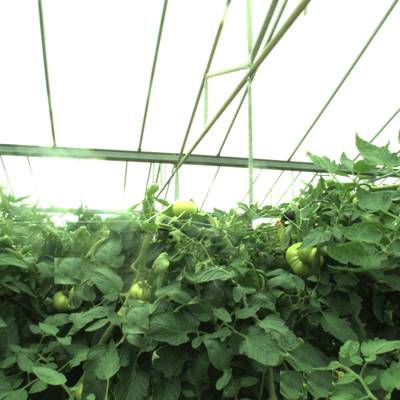
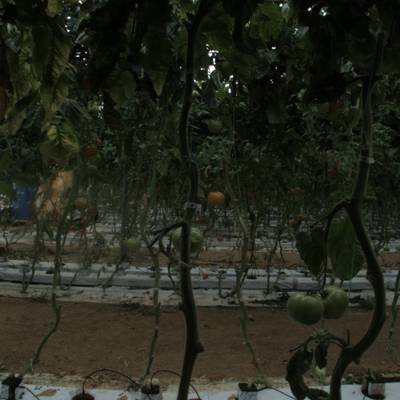
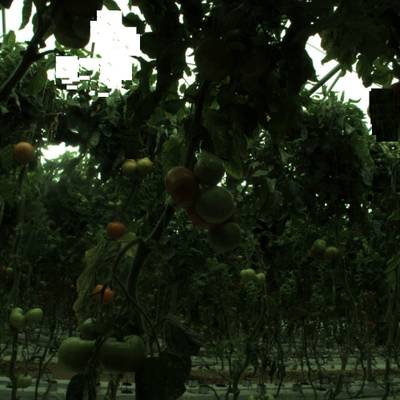
tomatOD dataset has 277 images. Click on one of the examples below or open "Explore" tool anytime you need to view dataset images with annotations. This tool has extended visualization capabilities like zoom, translation, objects table, custom filters and more. Hover the mouse over the images to hide or show annotations.


Class balance #
There are 3 annotation classes in the dataset. Find the general statistics and balances for every class in the table below. Click any row to preview images that have labels of the selected class. Sort by column to find the most rare or prevalent classes.

Class ㅤ | Images ㅤ | Objects ㅤ | Count on image average | Area on image average |
|---|---|---|---|---|
unripe➔ rectangle | 275 | 1871 | 6.8 | 2.08% |
fully-ripe➔ rectangle | 227 | 489 | 2.15 | 0.65% |
semi-ripe➔ rectangle | 198 | 437 | 2.21 | 0.84% |
Co-occurrence matrix #
Co-occurrence matrix is an extremely valuable tool that shows you the images for every pair of classes: how many images have objects of both classes at the same time. If you click any cell, you will see those images. We added the tooltip with an explanation for every cell for your convenience, just hover the mouse over a cell to preview the description.
Images #
Explore every single image in the dataset with respect to the number of annotations of each class it has. Click a row to preview selected image. Sort by any column to find anomalies and edge cases. Use horizontal scroll if the table has many columns for a large number of classes in the dataset.
Object distribution #
Interactive heatmap chart for every class with object distribution shows how many images are in the dataset with a certain number of objects of a specific class. Users can click cell and see the list of all corresponding images.
Class sizes #
The table below gives various size properties of objects for every class. Click a row to see the image with annotations of the selected class. Sort columns to find classes with the smallest or largest objects or understand the size differences between classes.
Class | Object count | Avg area | Max area | Min area | Min height | Min height | Max height | Max height | Avg height | Avg height | Min width | Min width | Max width | Max width |
|---|---|---|---|---|---|---|---|---|---|---|---|---|---|---|
unripe rectangle | 1871 | 0.32% | 2.18% | 0.02% | 31px | 1.55% | 295px | 14.75% | 106px | 5.33% | 31px | 1.55% | 295px | 14.75% |
fully-ripe rectangle | 489 | 0.3% | 5.13% | 0.03% | 35px | 1.75% | 453px | 22.65% | 103px | 5.19% | 35px | 1.75% | 453px | 22.65% |
semi-ripe rectangle | 437 | 0.39% | 1.89% | 0.03% | 33px | 1.75% | 275px | 13.75% | 117px | 5.92% | 33px | 1.75% | 275px | 13.75% |
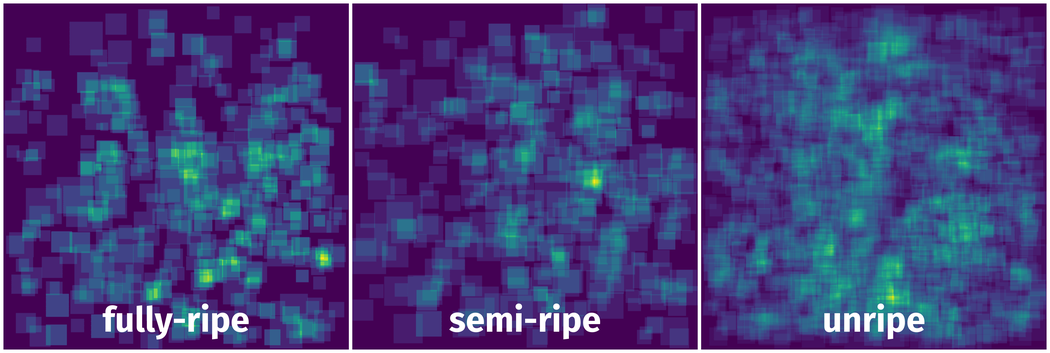
Spatial Heatmap #
The heatmaps below give the spatial distributions of all objects for every class. These visualizations provide insights into the most probable and rare object locations on the image. It helps analyze objects' placements in a dataset.
Objects #
Table contains all 2797 objects. Click a row to preview an image with annotations, and use search or pagination to navigate. Sort columns to find outliers in the dataset.
Object ID ㅤ | Class ㅤ | Image name click row to open | Image size height x width | Height ㅤ | Height ㅤ | Width ㅤ | Width ㅤ | Area ㅤ |
|---|---|---|---|---|---|---|---|---|
1➔ | semi-ripe rectangle | stereo20190406_065607_p0_snap_094.jpg | 2000 x 2000 | 93px | 4.65% | 93px | 4.65% | 0.22% |
2➔ | fully-ripe rectangle | stereo20190406_065607_p0_snap_094.jpg | 2000 x 2000 | 93px | 4.65% | 93px | 4.65% | 0.22% |
3➔ | unripe rectangle | stereo20190406_065607_p0_snap_094.jpg | 2000 x 2000 | 193px | 9.65% | 193px | 9.65% | 0.93% |
4➔ | unripe rectangle | stereo20190406_065607_p0_snap_094.jpg | 2000 x 2000 | 119px | 5.95% | 119px | 5.95% | 0.35% |
5➔ | unripe rectangle | stereo20190406_065607_p0_snap_094.jpg | 2000 x 2000 | 119px | 5.95% | 119px | 5.95% | 0.35% |
6➔ | unripe rectangle | stereo20190406_065607_p0_snap_094.jpg | 2000 x 2000 | 207px | 10.35% | 207px | 10.35% | 1.07% |
7➔ | unripe rectangle | stereo20190405_133623_p2_snap_177.jpg | 2000 x 2000 | 125px | 6.25% | 125px | 6.25% | 0.39% |
8➔ | unripe rectangle | stereo20190405_133623_p2_snap_177.jpg | 2000 x 2000 | 75px | 3.75% | 75px | 3.75% | 0.14% |
9➔ | unripe rectangle | stereo20190405_133623_p2_snap_177.jpg | 2000 x 2000 | 127px | 6.35% | 127px | 6.35% | 0.4% |
10➔ | unripe rectangle | stereo20190405_133623_p2_snap_177.jpg | 2000 x 2000 | 65px | 3.25% | 65px | 3.25% | 0.11% |
License #
tomatOD: Tomato Fruit Localization and Ripening Classification is under CC BY-NC-SA 4.0 license.
Citation #
If you make use of the TomatOD data, please cite the following reference:
Tsironis V., Bourou S., Stentoumis C. (2020). tomatOD: Evaluation of object detection algorithms on a new real-world tomato dataset. In ISPRS - International Archives of the Photogrammetry, Remote Sensing and Spatial Information Sciences. Available from https://github.com/up2metric/tomatOD
If you are happy with Dataset Ninja and use provided visualizations and tools in your work, please cite us:
@misc{ visualization-tools-for-tomatod-dataset,
  title = { Visualization Tools for tomatOD Dataset },
  type = { Computer Vision Tools },
  author = { Dataset Ninja },
  howpublished = { \url{ https://datasetninja.com/tomatod } },
  url = { https://datasetninja.com/tomatod },
  journal = { Dataset Ninja },
  publisher = { Dataset Ninja },
  year = { 2026 },
  month = { jul },
  note = { visited on 2026-07-16 },
}
Download #
Dataset tomatOD can be downloaded in Supervisely format:
As an alternative, it can be downloaded with dataset-tools package:
pip install --upgrade dataset-tools
… using following python code:
import dataset_tools as dtools

dtools.download(dataset='tomatOD', dst_dir='~/dataset-ninja/')
Make sure not to overlook the python code example available on the Supervisely Developer Portal. It will give you a clear idea of how to effortlessly work with the downloaded dataset.
The data in original format can be downloaded here:
Disclaimer #
Our gal from the legal dep told us we need to post this:
Dataset Ninja provides visualizations and statistics for some datasets that can be found online and can be downloaded by general audience. Dataset Ninja is not a dataset hosting platform and can only be used for informational purposes. The platform does not claim any rights for the original content, including images, videos, annotations and descriptions. Joint publishing is prohibited.
You take full responsibility when you use datasets presented at Dataset Ninja, as well as other information, including visualizations and statistics we provide. You are in charge of compliance with any dataset license and all other permissions. You are required to navigate datasets homepage and make sure that you can use it. In case of any questions, get in touch with us at hello@datasetninja.com.