Introduction #
Total-Text is a dataset tailored for instance segmentation, semantic segmentation, and object detection tasks, containing 1555 images with 11165 labeled objects belonging to a single class — text with text label tag. Its primary aim is to open new research avenues in the scene text domain. Unlike traditional text datasets, Total-Text uniquely includes curved-oriented text in addition to horizontal and multi-oriented text, offering diverse text orientations in more than half of its images. This variety makes it a crucial resource for advancing text-related studies in computer vision and natural language processing.
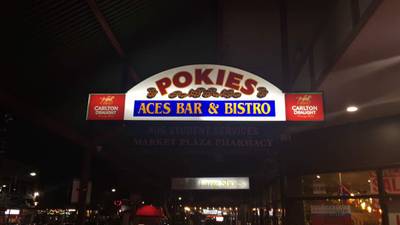
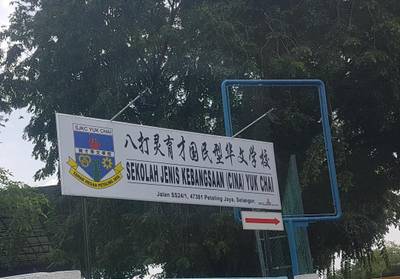
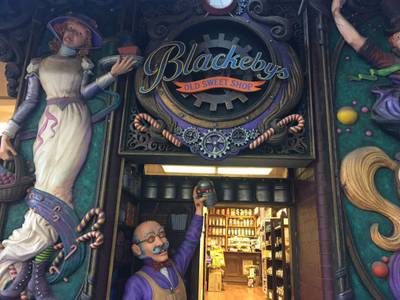
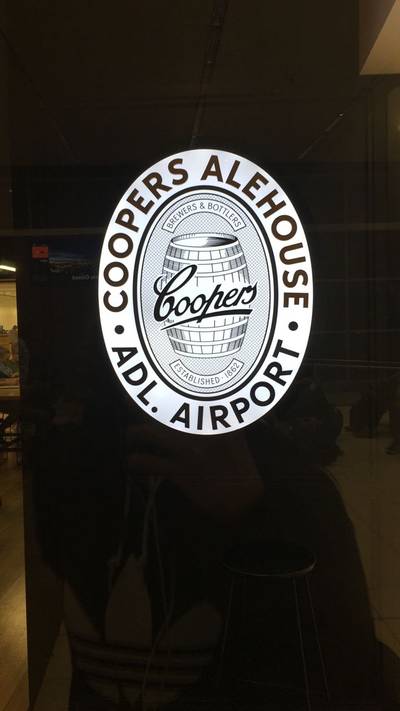
The effort of collecting this dataset is motivated by the missing of curved text in existing scene text datasets. Curved text can be easily found in real life scenes such as: business logos, signs, entrances etc, surprisingly such data has close to zero existence in the current datasets. The most popular scene text dataset over the decade, ICDARs have only horizontal text.
Authors propose Total-Text with 4,265 curved text out of 9,330 total text instances, hoping to spur an interest in the community to address curved text.

Statistics of Total-Text dataset.
Curved text observation
Geometrically speaking, a straight line has no angle variation along the line, and thus can be described as a linear function, y = mx + c. A curved line is not a straight line. It is free of angle variation restriction throughout the line. Shifting to the scene text perspective, authors observed that horizontal oriented text or word is a series of characters that can be connected by a straight line; their bottom alignment in particular for most cases. At the same time, multi-oriented text, in scene text convention, can also be connected by a straight line, given an offset with respect to a horizontal line. Meanwhile, characters a in curved word will not have unified angle offset, in which deemed to fit a polynomial line in text
level.

1st row: Examples from ICDAR 2013, ICDAR2015 and MSRA-TD500; 2nd row: Slightly curved to extremely curved text examples from the Total-Text.
In authors’ dataset collection, they found out that curved text in natural images could vary from slightly curved to extremely curved. Also, it is not surprising to find that most of them are in the shape of a symmetric arc due to the symmetrical preferences in human vision.
Orientation diversity
Approximate by half of the text instances are curved, and the other half is split almost equally between horizontal and multi-oriented. Curve text has its own variation too. Based on authors’ observation, they classified them as horizontal curved, vertical curved, circular, and wavy (refer to 6a for image example). Although all the images were collected with curved text in mind, other orientations still occupy half of the total instances. A closer look into the dataset shows that curved text usually appears with either horizontal or multi-oriented texts. The mixture of orientations in an image, challenges text detection algorithms to achieve robustness and generalization in terms of text orientations.
Scene diversity
In comparison to CUTE80 (the only publicly available curved text dataset), which majority of the images are football jerseys, Total-Text is much more diversified. Business related places like restaurant (i.e., Nandos, Starbucks), company branding logos, and merchant stores take up of 61.2% of the curved text instances. Tourist spots such as park (i.e., Beverly Hills in America), museums and landmarks (i.e., Harajuku in Japan) occupy 21.1%.

Curved text is commonly seen in real world scenery.
Summary #
Total-Text is a dataset for instance segmentation, semantic segmentation, and object detection tasks. It is used in the optical character recognition (OCR) domain.
The dataset consists of 1555 images with 11165 labeled objects belonging to 1 single class (text).
Images in the Total-Text dataset have pixel-level instance segmentation annotations. Due to the nature of the instance segmentation task, it can be automatically transformed into a semantic segmentation (only one mask for every class) or object detection (bounding boxes for every object) tasks. There are 300 (19% of the total) unlabeled images (i.e. without annotations). There are 2 splits in the dataset: train (1255 images) and test (300 images). Also the dataset includes text object tag. Explore them in supervisely labeling tool. The dataset was released in 2017 by the University of Malaya, Malaysia.

Explore #
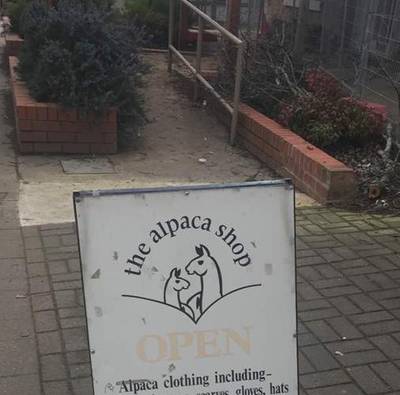
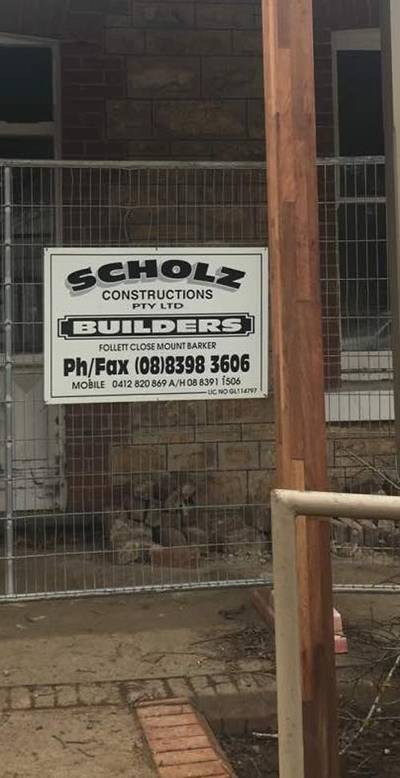
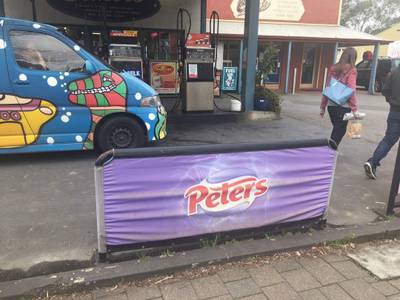
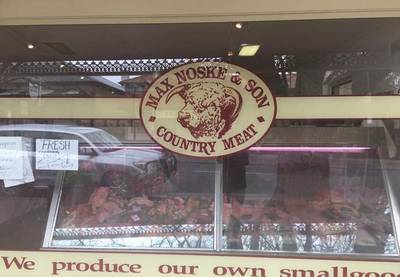
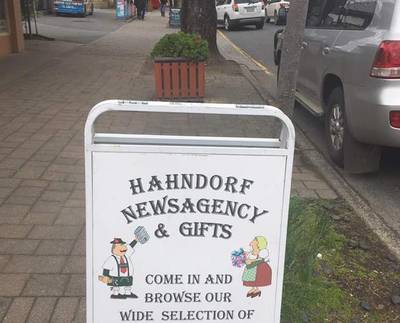
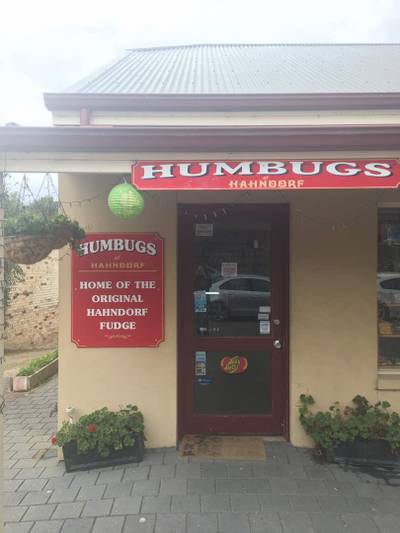
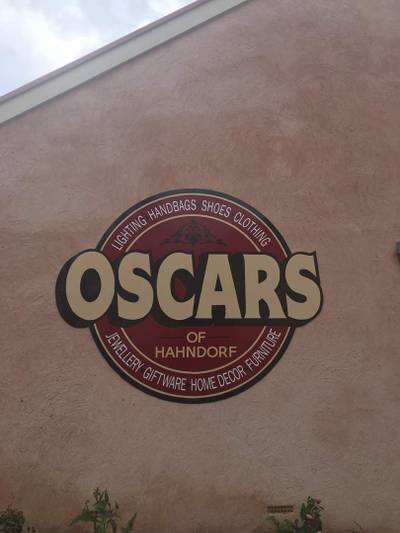
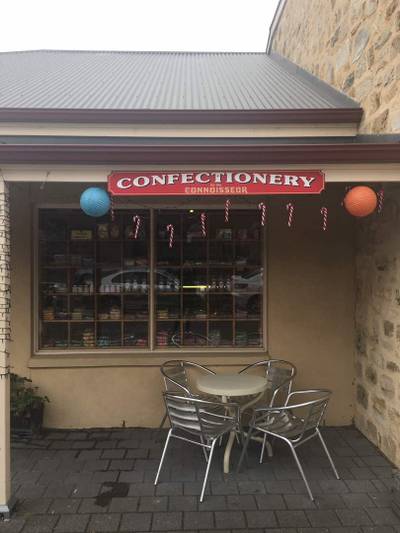
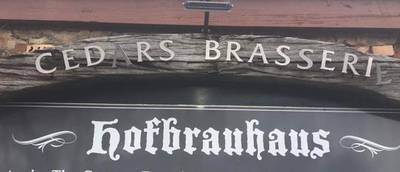
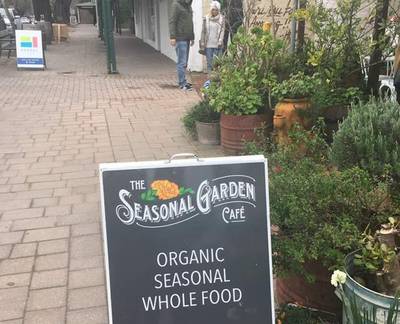
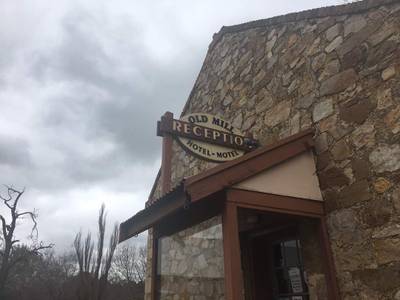
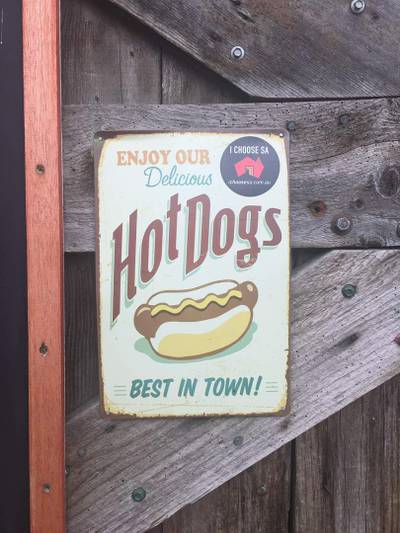
Total-Text dataset has 1555 images. Click on one of the examples below or open "Explore" tool anytime you need to view dataset images with annotations. This tool has extended visualization capabilities like zoom, translation, objects table, custom filters and more. Hover the mouse over the images to hide or show annotations.









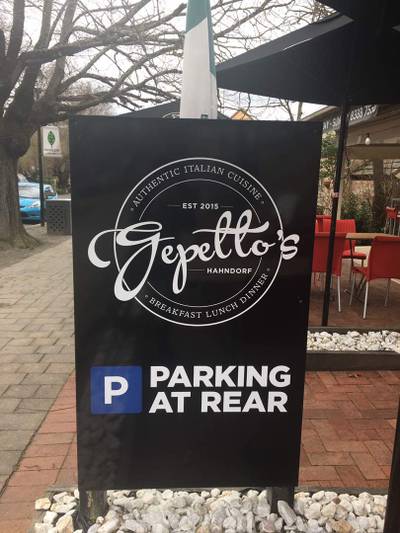

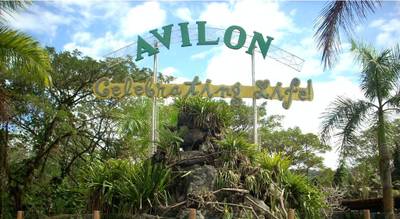

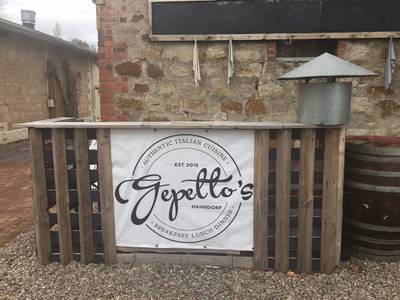

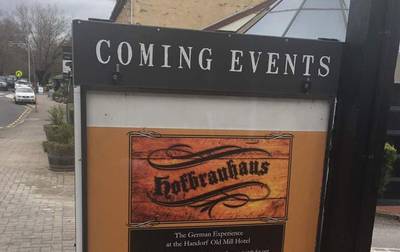





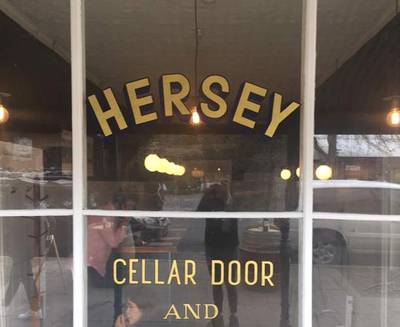

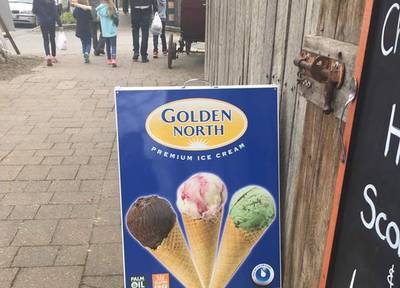

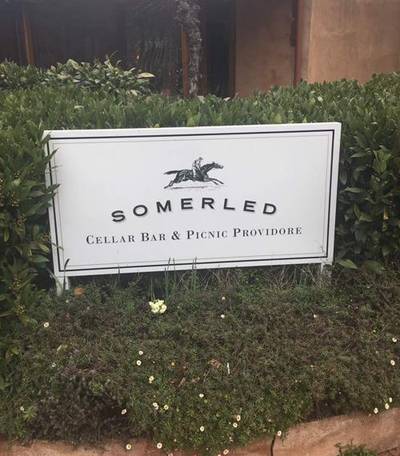

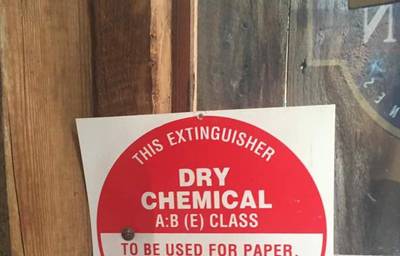

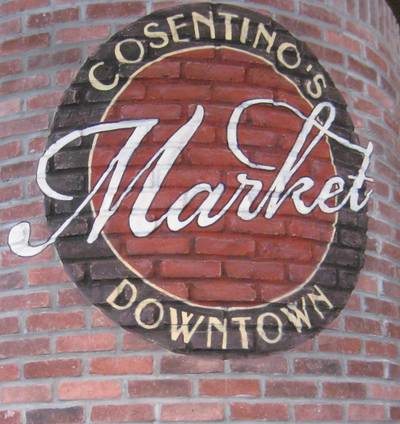

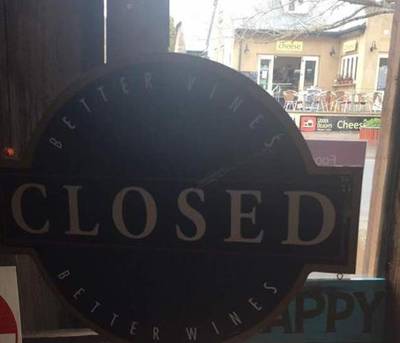

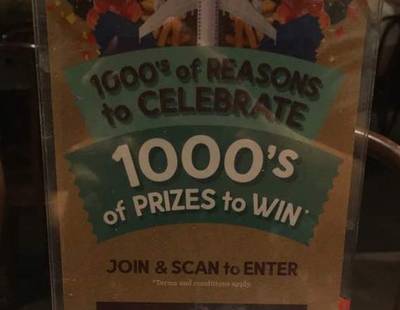

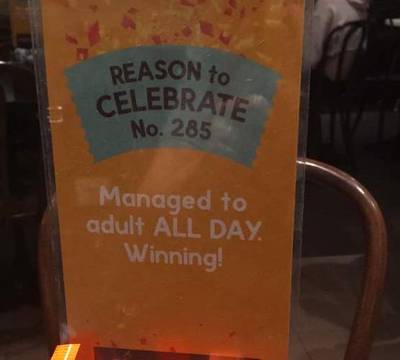







Class balance #
There are 1 annotation classes in the dataset. Find the general statistics and balances for every class in the table below. Click any row to preview images that have labels of the selected class. Sort by column to find the most rare or prevalent classes.
Class ㅤ | Images ㅤ | Objects ㅤ | Count on image average | Area on image average |
|---|---|---|---|---|
text➔ polygon | 1255 | 11165 | 8.9 | 9.15% |
Images #
Explore every single image in the dataset with respect to the number of annotations of each class it has. Click a row to preview selected image. Sort by any column to find anomalies and edge cases. Use horizontal scroll if the table has many columns for a large number of classes in the dataset.
Class sizes #
The table below gives various size properties of objects for every class. Click a row to see the image with annotations of the selected class. Sort columns to find classes with the smallest or largest objects or understand the size differences between classes.
Class | Object count | Avg area | Max area | Min area | Min height | Min height | Max height | Max height | Avg height | Avg height | Min width | Min width | Max width | Max width |
|---|---|---|---|---|---|---|---|---|---|---|---|---|---|---|
text polygon | 11165 | 1% | 41.57% | 0.01% | 6px | 0.83% | 1180px | 97.48% | 69px | 8.63% | 7px | 0.69% | 2507px | 98.85% |
Spatial Heatmap #
The heatmaps below give the spatial distributions of all objects for every class. These visualizations provide insights into the most probable and rare object locations on the image. It helps analyze objects' placements in a dataset.

Objects #
Table contains all 11165 objects. Click a row to preview an image with annotations, and use search or pagination to navigate. Sort columns to find outliers in the dataset.
Object ID ㅤ | Class ㅤ | Image name click row to open | Image size height x width | Height ㅤ | Height ㅤ | Width ㅤ | Width ㅤ | Area ㅤ |
|---|---|---|---|---|---|---|---|---|
1➔ | text polygon | img283.jpg | 1328 x 2000 | 77px | 5.8% | 122px | 6.1% | 0.19% |
2➔ | text polygon | img283.jpg | 1328 x 2000 | 108px | 8.13% | 217px | 10.85% | 0.37% |
3➔ | text polygon | img958.jpg | 640 x 486 | 57px | 8.91% | 228px | 46.91% | 2.05% |
4➔ | text polygon | img958.jpg | 640 x 486 | 37px | 5.78% | 94px | 19.34% | 0.87% |
5➔ | text polygon | img958.jpg | 640 x 486 | 35px | 5.47% | 85px | 17.49% | 0.51% |
6➔ | text polygon | img958.jpg | 640 x 486 | 33px | 5.16% | 83px | 17.08% | 0.76% |
7➔ | text polygon | img958.jpg | 640 x 486 | 25px | 3.91% | 87px | 17.9% | 0.44% |
8➔ | text polygon | img958.jpg | 640 x 486 | 14px | 2.19% | 73px | 15.02% | 0.21% |
9➔ | text polygon | img1351.jpg | 494 x 640 | 127px | 25.71% | 172px | 26.88% | 5.22% |
10➔ | text polygon | img1351.jpg | 494 x 640 | 148px | 29.96% | 189px | 29.53% | 5.79% |
License #
Total-Text is under 3-Clause BSD License license.
Citation #
If you make use of the Total-Text data, please cite the following reference:
@misc{chng2017totaltext,
  title={Total-Text: A Comprehensive Dataset for Scene Text Detection and Recognition},
  author={Chee Kheng Chng and Chee Seng Chan},
  year={2017},
  eprint={1710.10400},
  archivePrefix={arXiv},
  primaryClass={cs.CV}
}
If you are happy with Dataset Ninja and use provided visualizations and tools in your work, please cite us:
@misc{ visualization-tools-for-total-text-dataset,
  title = { Visualization Tools for Total-Text Dataset },
  type = { Computer Vision Tools },
  author = { Dataset Ninja },
  howpublished = { \url{ https://datasetninja.com/total-text } },
  url = { https://datasetninja.com/total-text },
  journal = { Dataset Ninja },
  publisher = { Dataset Ninja },
  year = { 2026 },
  month = { feb },
  note = { visited on 2026-02-15 },
}
Download #
Dataset Total-Text can be downloaded in Supervisely format:
As an alternative, it can be downloaded with dataset-tools package:
pip install --upgrade dataset-tools
… using following python code:
import dataset_tools as dtools

dtools.download(dataset='Total-Text', dst_dir='~/dataset-ninja/')
Make sure not to overlook the python code example available on the Supervisely Developer Portal. It will give you a clear idea of how to effortlessly work with the downloaded dataset.
The data in original format can be downloaded here.
Disclaimer #
Our gal from the legal dep told us we need to post this:
Dataset Ninja provides visualizations and statistics for some datasets that can be found online and can be downloaded by general audience. Dataset Ninja is not a dataset hosting platform and can only be used for informational purposes. The platform does not claim any rights for the original content, including images, videos, annotations and descriptions. Joint publishing is prohibited.
You take full responsibility when you use datasets presented at Dataset Ninja, as well as other information, including visualizations and statistics we provide. You are in charge of compliance with any dataset license and all other permissions. You are required to navigate datasets homepage and make sure that you can use it. In case of any questions, get in touch with us at hello@datasetninja.com.


