
Introduction #
The Traffic Vehicles Object Detection dataset is a valuable resource containing 1,201 images capturing the dynamic world of traffic, featuring 11,134 meticulously labeled objects. These objects are classified into seven distinct categories, including common vehicles like car, two_wheeler, as well as blur_number_plate, and other essential elements such as auto, number_plate, bus, and truck. The dataset’s origins lie in the collection of training images from traffic scenes and CCTV footage, followed by precise object annotation and labeling, making it an ideal tool for object detection tasks in the realm of transportation and surveillance.
The dataset contains labeled images of transport vehicles and number plates using LabelImg in YOLOv5 format. Author first collected some 1000 training images of traffic, vehicles and number plates, and CCTV footage videos. Then he extracted frames from videos using OpenCV. Drew a box around each object that he want the detector to see and label each box with the object class that he would like the detector to predict. Data was collected from open-source websites.
 Homepage
Summary #
Traffic Vehicles Object Detection is a dataset for an object detection task. Possible applications of the dataset could be in the smart city and surveillance industries.
The dataset consists of 1201 images with 11134 labeled objects belonging to 7 different classes including car, two_wheeler, blur_number_plate, and other: auto, number_plate, bus, and truck.
Images in the Traffic Vehicles Object Detection dataset have bounding box annotations. There are 285 (24% of the total) unlabeled images (i.e. without annotations). There are 3 splits in the dataset: train (738 images), test (278 images), and val (185 images). The dataset was released in 2021.
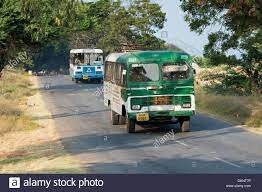
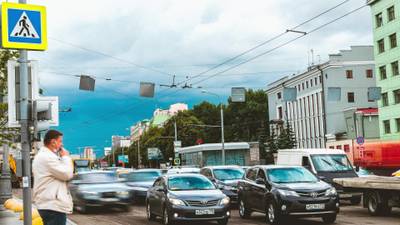
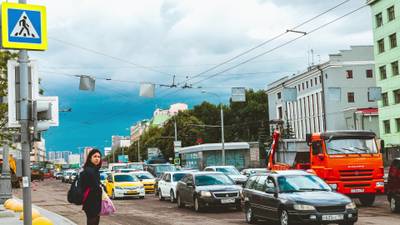
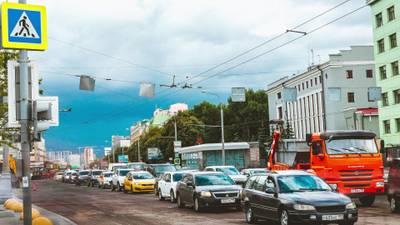
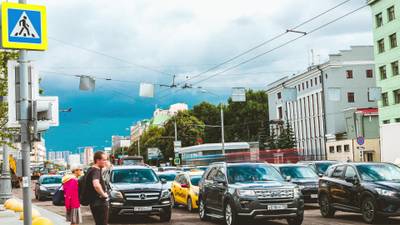
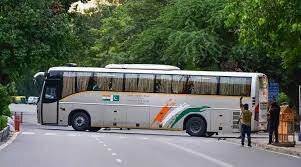
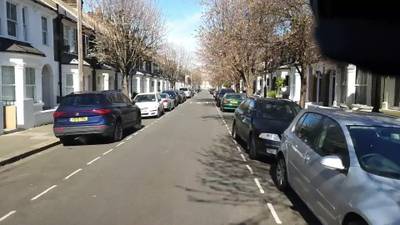
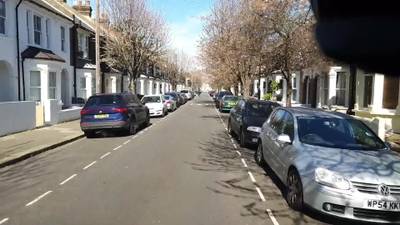
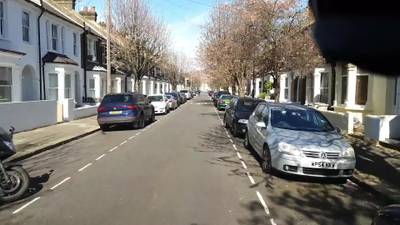
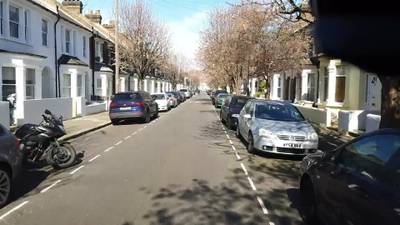
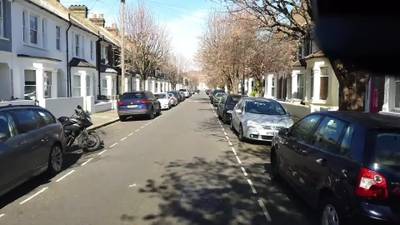
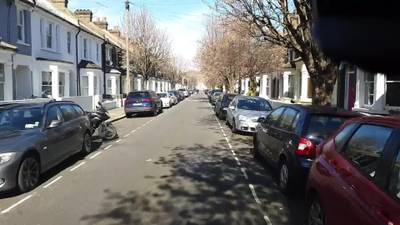
Here are the visualized examples for the classes:
Explore #
Traffic Vehicles Object Detection dataset has 1201 images. Click on one of the examples below or open "Explore" tool anytime you need to view dataset images with annotations. This tool has extended visualization capabilities like zoom, translation, objects table, custom filters and more. Hover the mouse over the images to hide or show annotations.


Class balance #
There are 7 annotation classes in the dataset. Find the general statistics and balances for every class in the table below. Click any row to preview images that have labels of the selected class. Sort by column to find the most rare or prevalent classes.

Class ㅤ | Images ㅤ | Objects ㅤ | Count on image average | Area on image average |
|---|---|---|---|---|
car➔ rectangle | 737 | 5177 | 7.02 | 16.92% |
two_wheeler➔ rectangle | 536 | 1869 | 3.49 | 6.14% |
blur_number_plate➔ rectangle | 534 | 1310 | 2.45 | 0.27% |
auto➔ rectangle | 413 | 1166 | 2.82 | 4.61% |
number_plate➔ rectangle | 398 | 653 | 1.64 | 0.32% |
bus➔ rectangle | 298 | 415 | 1.39 | 9.8% |
truck➔ rectangle | 294 | 544 | 1.85 | 14.21% |
Co-occurrence matrix #
Co-occurrence matrix is an extremely valuable tool that shows you the images for every pair of classes: how many images have objects of both classes at the same time. If you click any cell, you will see those images. We added the tooltip with an explanation for every cell for your convenience, just hover the mouse over a cell to preview the description.
Images #
Explore every single image in the dataset with respect to the number of annotations of each class it has. Click a row to preview selected image. Sort by any column to find anomalies and edge cases. Use horizontal scroll if the table has many columns for a large number of classes in the dataset.
Object distribution #
Interactive heatmap chart for every class with object distribution shows how many images are in the dataset with a certain number of objects of a specific class. Users can click cell and see the list of all corresponding images.
Class sizes #
The table below gives various size properties of objects for every class. Click a row to see the image with annotations of the selected class. Sort columns to find classes with the smallest or largest objects or understand the size differences between classes.
Class | Object count | Avg area | Max area | Min area | Min height | Min height | Max height | Max height | Avg height | Avg height | Min width | Min width | Max width | Max width |
|---|---|---|---|---|---|---|---|---|---|---|---|---|---|---|
car rectangle | 5177 | 2.57% | 81.09% | 0.02% | 9px | 1.67% | 751px | 89.62% | 130px | 14.96% | 12px | 1.25% | 1897px | 100% |
two_wheeler rectangle | 1869 | 1.87% | 79.83% | 0.02% | 14px | 2.59% | 1586px | 100% | 107px | 17.25% | 5px | 0.52% | 1888px | 93.12% |
blur_number_plate rectangle | 1310 | 0.11% | 8.93% | 0% | 4px | 0.57% | 381px | 39.85% | 15px | 2.48% | 1px | 0.1% | 295px | 22.69% |
auto rectangle | 1166 | 1.67% | 53.81% | 0.02% | 12px | 2.22% | 681px | 88.13% | 73px | 13.3% | 6px | 0.62% | 786px | 66.55% |
number_plate rectangle | 653 | 0.2% | 3.18% | 0.01% | 7px | 0.47% | 116px | 10.85% | 27px | 2.83% | 19px | 1.6% | 241px | 36.24% |
truck rectangle | 544 | 7.72% | 91.73% | 0.03% | 11px | 2.04% | 2823px | 100% | 224px | 27.07% | 14px | 1.46% | 3565px | 96.44% |
bus rectangle | 415 | 7.06% | 93.5% | 0.13% | 16px | 2.65% | 1481px | 99.44% | 185px | 22.75% | 22px | 3.6% | 2862px | 99.87% |
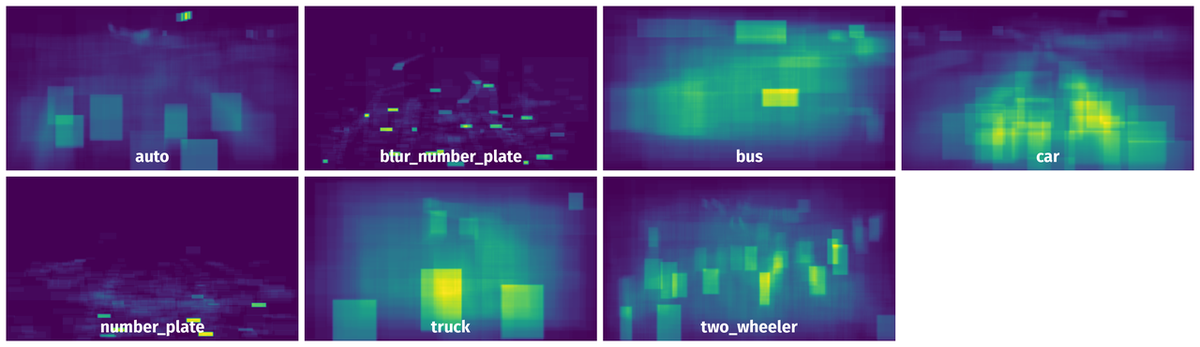
Spatial Heatmap #
The heatmaps below give the spatial distributions of all objects for every class. These visualizations provide insights into the most probable and rare object locations on the image. It helps analyze objects' placements in a dataset.
Objects #
Table contains all 11134 objects. Click a row to preview an image with annotations, and use search or pagination to navigate. Sort columns to find outliers in the dataset.
Object ID ㅤ | Class ㅤ | Image name click row to open | Image size height x width | Height ㅤ | Height ㅤ | Width ㅤ | Width ㅤ | Area ㅤ |
|---|---|---|---|---|---|---|---|---|
1➔ | car rectangle | Video2_2.jpg | 540 x 960 | 35px | 6.48% | 97px | 10.1% | 0.65% |
2➔ | car rectangle | Video2_2.jpg | 540 x 960 | 99px | 18.33% | 93px | 9.69% | 1.78% |
3➔ | car rectangle | Video2_2.jpg | 540 x 960 | 34px | 6.3% | 63px | 6.56% | 0.41% |
4➔ | blur_number_plate rectangle | Video2_2.jpg | 540 x 960 | 11px | 2.04% | 29px | 3.02% | 0.06% |
5➔ | auto rectangle | Video2_2.jpg | 540 x 960 | 21px | 3.89% | 16px | 1.67% | 0.06% |
6➔ | bus rectangle | Video2_2.jpg | 540 x 960 | 34px | 6.3% | 47px | 4.9% | 0.31% |
7➔ | bus rectangle | 00 (11).jpg | 167 x 301 | 74px | 44.31% | 237px | 78.74% | 34.89% |
8➔ | car rectangle | Video5_29.jpg | 540 x 960 | 79px | 14.63% | 130px | 13.54% | 1.98% |
9➔ | car rectangle | Video5_29.jpg | 540 x 960 | 102px | 18.89% | 124px | 12.92% | 2.44% |
10➔ | car rectangle | Video5_29.jpg | 540 x 960 | 134px | 24.81% | 146px | 15.21% | 3.77% |
License #
License is unknown for the Traffic Vehicles Object Detection dataset.
Citation #
If you make use of the Traffic Vehicles Object Detection data, please cite the following reference:
@dataset{Traffic Vehicles Object Detection,
  author={Saumya Patel},
  title={Traffic Vehicles Object Detection},
  year={2021},
  url={https://www.kaggle.com/datasets/saumyapatel/traffic-vehicles-object-detection}
}
If you are happy with Dataset Ninja and use provided visualizations and tools in your work, please cite us:
@misc{ visualization-tools-for-traffic-vehicles-object-detection-dataset,
  title = { Visualization Tools for Traffic Vehicles Object Detection Dataset },
  type = { Computer Vision Tools },
  author = { Dataset Ninja },
  howpublished = { \url{ https://datasetninja.com/traffic-vehicles-object-detection } },
  url = { https://datasetninja.com/traffic-vehicles-object-detection },
  journal = { Dataset Ninja },
  publisher = { Dataset Ninja },
  year = { 2026 },
  month = { jul },
  note = { visited on 2026-07-29 },
}
Download #
Please visit dataset homepage to download the data.
Disclaimer #
Our gal from the legal dep told us we need to post this:
Dataset Ninja provides visualizations and statistics for some datasets that can be found online and can be downloaded by general audience. Dataset Ninja is not a dataset hosting platform and can only be used for informational purposes. The platform does not claim any rights for the original content, including images, videos, annotations and descriptions. Joint publishing is prohibited.
You take full responsibility when you use datasets presented at Dataset Ninja, as well as other information, including visualizations and statistics we provide. You are in charge of compliance with any dataset license and all other permissions. You are required to navigate datasets homepage and make sure that you can use it. In case of any questions, get in touch with us at hello@datasetninja.com.