Introduction #
The authors presented the TrashCan 1.0: An Instance-Segmentation Labeled Dataset of Trash Observations, a large dataset comprised of images of underwater trash collected from a variety of sources, annotated both using bounding boxes and segmentation labels, for development of robust detectors of marine debris. The dataset has two versions, TrashCan-Material and TrashCan-Instance, corresponding to different object class configurations. The eventual goal is to develop efficient and accurate trash detection methods suitable for onboard robot deployment.
Motivation
The proliferation of marine debris presents a significant threat to aquatic ecosystems, posing an increasingly daunting challenge to address. Despite numerous proposals and adoption of various cleanup approaches by environmental and governmental agencies, few have achieved widespread success. Compounding the difficulty of cleanup efforts is the necessity to precisely detect and locate underwater trash deposits, followed by their removal while safeguarding underwater flora and fauna. One promising avenue for tackling these challenges involves leveraging vision-equipped autonomous underwater vehicles (AUVs). By integrating robust trash detection capabilities alongside underwater visual localization algorithms, AUVs could effectively identify and pinpoint trash deposits. This capability could facilitate either autonomous removal of debris or streamline manned cleanup missions.
However, developing an accurate underwater trash detection system necessitates access to a substantial dataset to train deep neural networks, such as Convolutional Neural Networks (CNNs). Debris in underwater environments often takes irregular, non-rigid shapes, presenting a unique set of challenges. Regrettably, there is currently a lack of publicly available datasets tailored for training such models. While the scientific community has long explored methods for removing marine debris from both surface and subsea environments, autonomous trash detection has received comparatively less attention. Some research endeavors have focused on debris removal from ocean surfaces, mapping trash on beaches using LIDAR, and utilizing forward-looking sonar (FLS) imagery for underwater debris detection through CNN training.
Dataset description
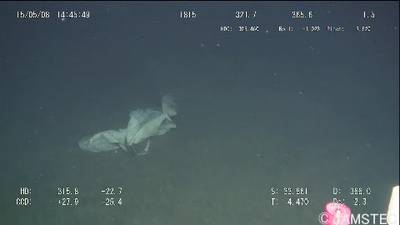
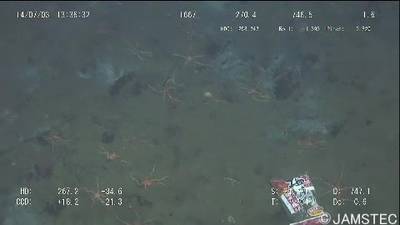
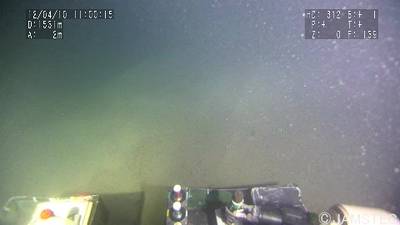
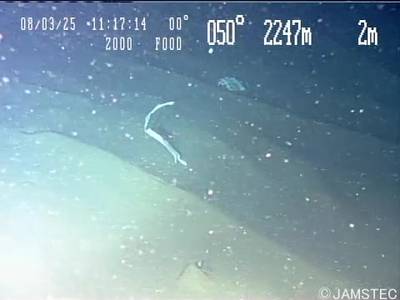
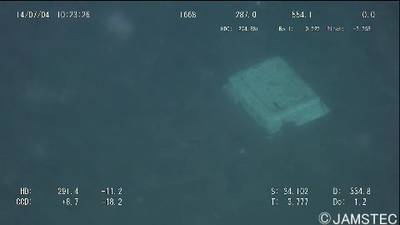
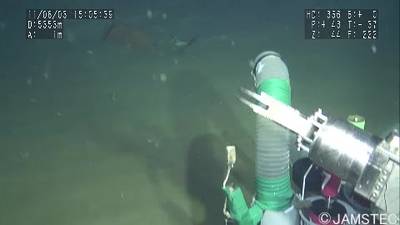
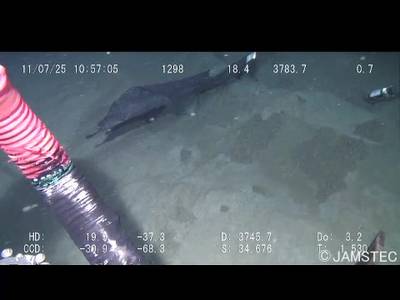
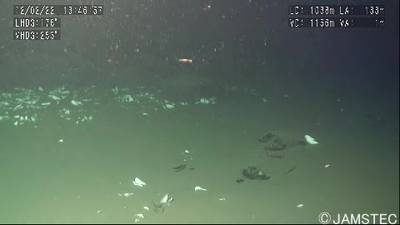
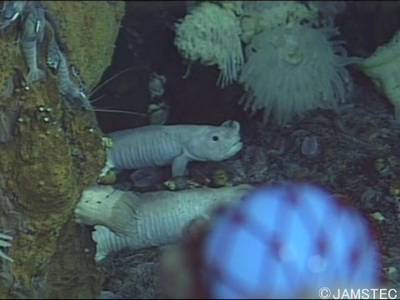
The TrashCan dataset comprises annotated images, currently totaling 7,212 images, capturing a wide array of undersea phenomena including trash, Remotely Operated Vehicles (ROVs), and diverse marine flora and fauna. Annotations within this dataset adopt the format of instance segmentation annotations, represented as bitmaps delineating object masks for each observed entity.
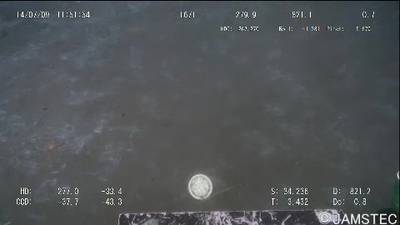
The imagery featured in TrashCan is sourced from the J-EDI (JAMSTEC E-Library of Deep-sea Images) dataset, meticulously curated by the Japan Agency of Marine Earth Science and Technology (JAMSTEC). This extensive dataset encompasses videos captured by ROVs operated by JAMSTEC since 1982, primarily in the sea of Japan. While a small subset of these videos includes observations of marine debris, the entirety of the authors’ trash data originates from nearly one thousand videos of varying durations, specifically selected from these archives. Additionally, supplementary videos were chosen to enhance the diversity of biological entities represented within the dataset.
After the video selection process, frames were extracted from each video at a rate of one frame per second, resulting in a substantial collection of frames for each video stored in separate folders. Subsequently, the videos were partitioned into similarly-sized segments and uploaded to Supervisely, an online image annotation tool. Upon upload, a team of 21 individuals meticulously annotated the images, working through each image individually. This annotation process consumed approximately 1,500 work hours, spanning several months. If deemed suitable for labeling, the assigned annotator delineated a segmentation mask over the image, categorizing it into one of four classes: “trash” (comprising any marine debris), “ROV” (indicating any intentionally placed man-made item in the scene), “bio” (representing plants and animals), and “unknown” (designated for unidentified objects). Trash objects received additional tagging specifying their material (e.g., metal, plastic), instance (e.g., cup, bag, container), and binary tags denoting attributes such as overgrowth, significant decay, or being crushed or broken. Bio objects were categorized as either plant or animal, with animal specimens further specified by type (e.g., crab, fish, eel). Objects falling into the ROV and unknown classes did not require additional tags.
Sampled results for object detection and image segmentation for both versions of the TrashCan dataset.
To prepare the dataset for deep network training, it underwent conversion from a proprietary JSON format to the COCO format. This conversion entailed transforming bitmap masks into COCO annotations represented by polygon vertices and mapping Supervisely annotations’ classes and tags to COCO object classes. The authors then derived two dataset versions: TrashCan-Material and TrashCan-Instance, named after the tag data used to distinguish various types of trash. In the Material version, each trash object was assigned a class name following the convention trash_material_name (e.g., trash_paper, trash_plastic), provided the material had more than 50 instances in the dataset. Objects with fewer examples were categorized under the class trash_etc, analogous to annotators’ classification when the material was unidentified. Similarly, in the TrashCan-Instance version, trash classes were generated based on instance tags approximating the object type being annotated (e.g., trash_cup, trash_bag). The same threshold of 50 instances was applied, with the generic class being trash_unknown_instance for less represented types. In both versions, any object labeled as unknown was typically included in the general trash class. The ROV class remained consistent across both versions, while bio objects were categorized as either plant or animal_animal_type (e.g., animal_starfish, animal_crab), based on applied tags.
| TrashCan-Material | TrashCan-Instance |
|---|---|
Summary #
TrashCan 1.0: An Instance-Segmentation Labeled Dataset of Trash Observations is a dataset for instance segmentation, semantic segmentation, and object detection tasks. It is used in the waste recycling, marine, and robotics industries.
The dataset consists of 14424 images with 54285 labeled objects belonging to 22 different classes including rov, trash unknown instance, trash plastic, and other: trash metal, trash etc, animal fish, plant, trash wood, animal eel, animal etc, trash fabric, animal crab, trash branch, trash fishing gear, animal shells, animal starfish, trash paper, trash rubber, trash wreckage, trash rope, trash tarp, and trash net.
Images in the TrashCan 1.0 dataset have pixel-level instance segmentation and bounding box annotations. Due to the nature of the instance segmentation task, it can be automatically transformed into a semantic segmentation task (only one mask for every class). There are 129 (1% of the total) unlabeled images (i.e. without annotations). There are 4 splits in the dataset: instance train (6065 images), materials train (6008 images), materials val (1204 images), and instance val (1147 images). Additionally, every image marked with its video id tag. The dataset was released in 2020 by the University of Minnesota Twin Cities, USA.
Here are the visualized examples for the classes:
Explore #
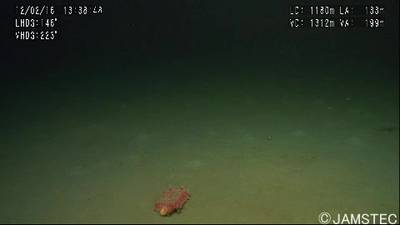
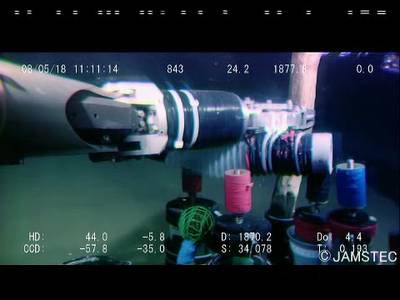
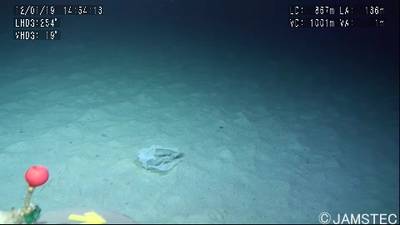
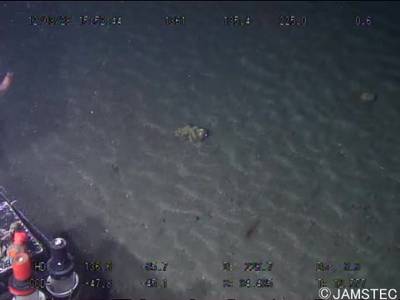
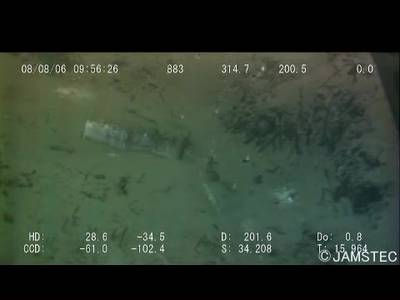
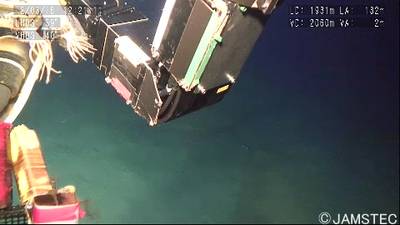
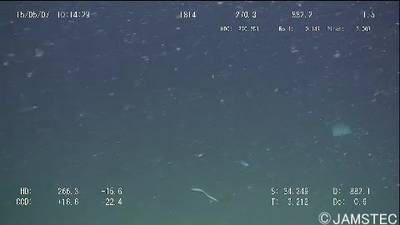
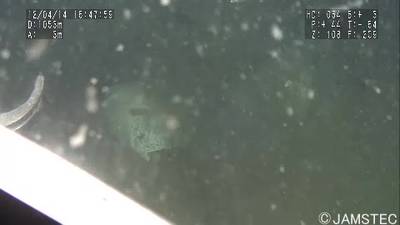
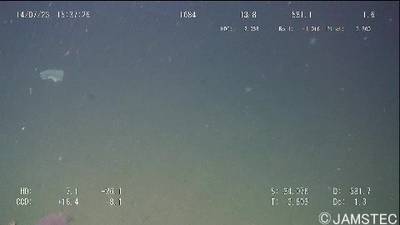
TrashCan 1.0 dataset has 14424 images. Click on one of the examples below or open "Explore" tool anytime you need to view dataset images with annotations. This tool has extended visualization capabilities like zoom, translation, objects table, custom filters and more. Hover the mouse over the images to hide or show annotations.

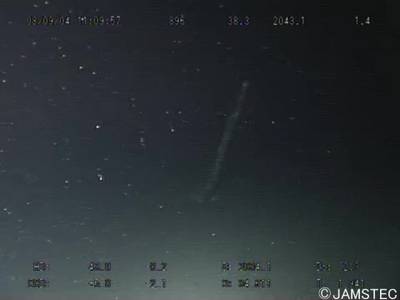


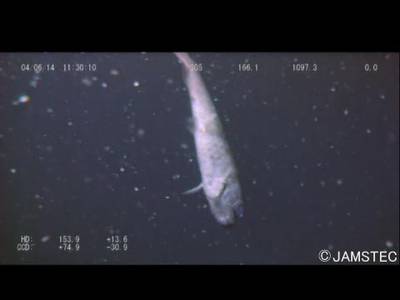

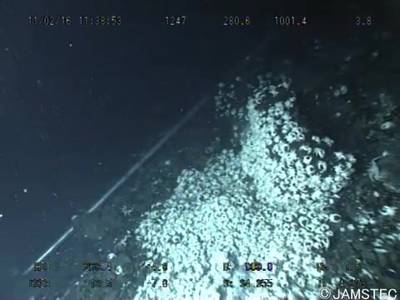

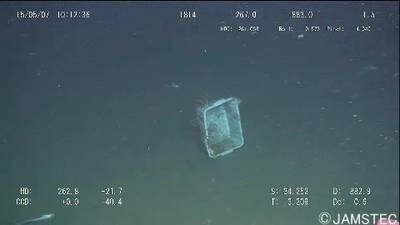























Class balance #
There are 22 annotation classes in the dataset. Find the general statistics and balances for every class in the table below. Click any row to preview images that have labels of the selected class. Sort by column to find the most rare or prevalent classes.
Class ㅤ | Images ㅤ | Objects ㅤ | Count on image average | Area on image average |
|---|---|---|---|---|
rov➔ any | 5442 | 15910 | 2.92 | 26.19% |
trash unknown instance➔ any | 2279 | 5947 | 2.61 | 7.81% |
trash plastic➔ any | 2209 | 4974 | 2.25 | 10.67% |
trash metal➔ any | 1991 | 4571 | 2.3 | 9.74% |
trash etc➔ any | 1822 | 4465 | 2.45 | 9.13% |
animal fish➔ any | 1288 | 3142 | 2.44 | 14.04% |
plant➔ any | 964 | 2344 | 2.43 | 12.32% |
trash wood➔ any | 807 | 1771 | 2.19 | 8.29% |
animal eel➔ any | 518 | 1390 | 2.68 | 3.86% |
animal etc➔ any | 442 | 1082 | 2.45 | 8.58% |
Co-occurrence matrix #
Co-occurrence matrix is an extremely valuable tool that shows you the images for every pair of classes: how many images have objects of both classes at the same time. If you click any cell, you will see those images. We added the tooltip with an explanation for every cell for your convenience, just hover the mouse over a cell to preview the description.
Images #
Explore every single image in the dataset with respect to the number of annotations of each class it has. Click a row to preview selected image. Sort by any column to find anomalies and edge cases. Use horizontal scroll if the table has many columns for a large number of classes in the dataset.
Object distribution #
Interactive heatmap chart for every class with object distribution shows how many images are in the dataset with a certain number of objects of a specific class. Users can click cell and see the list of all corresponding images.
Class sizes #
The table below gives various size properties of objects for every class. Click a row to see the image with annotations of the selected class. Sort columns to find classes with the smallest or largest objects or understand the size differences between classes.
Class | Object count | Avg area | Max area | Min area | Min height | Min height | Max height | Max height | Avg height | Avg height | Min width | Min width | Max width | Max width |
|---|---|---|---|---|---|---|---|---|---|---|---|---|---|---|
rov any | 15910 | 13.83% | 100% | 0% | 2px | 0.74% | 360px | 100% | 123px | 40.8% | 2px | 0.42% | 480px | 100% |
trash unknown instance any | 5947 | 4.62% | 100% | 0.02% | 3px | 1.11% | 360px | 100% | 61px | 19.68% | 6px | 1.25% | 480px | 100% |
trash plastic any | 4974 | 7.66% | 100% | 0% | 2px | 0.56% | 359px | 100% | 77px | 25.89% | 3px | 0.62% | 480px | 100% |
trash metal any | 4571 | 6.69% | 100% | 0% | 2px | 0.56% | 360px | 100% | 77px | 25.26% | 3px | 0.62% | 480px | 100% |
trash etc any | 4465 | 5.79% | 99.21% | 0% | 2px | 0.56% | 360px | 100% | 65px | 20.74% | 4px | 0.83% | 480px | 100% |
animal fish any | 3142 | 8.83% | 91.67% | 0.02% | 5px | 1.85% | 358px | 99.44% | 91px | 27.82% | 7px | 1.46% | 480px | 100% |
plant any | 2344 | 7.09% | 78.12% | 0.02% | 4px | 1.11% | 270px | 100% | 81px | 25.95% | 5px | 1.04% | 480px | 100% |
trash wood any | 1771 | 5.81% | 62.98% | 0% | 2px | 0.56% | 322px | 89.44% | 74px | 22.69% | 4px | 0.83% | 480px | 100% |
animal starfish any | 1622 | 1.16% | 44.47% | 0.01% | 3px | 1.11% | 179px | 66.3% | 37px | 13.13% | 3px | 0.62% | 336px | 70% |
animal eel any | 1390 | 1.81% | 32.57% | 0.01% | 6px | 2.22% | 358px | 100% | 39px | 13.39% | 8px | 1.67% | 406px | 84.58% |
Spatial Heatmap #
The heatmaps below give the spatial distributions of all objects for every class. These visualizations provide insights into the most probable and rare object locations on the image. It helps analyze objects' placements in a dataset.

Objects #
Table contains all 54285 objects. Click a row to preview an image with annotations, and use search or pagination to navigate. Sort columns to find outliers in the dataset.
Object ID ㅤ | Class ㅤ | Image name click row to open | Image size height x width | Height ㅤ | Height ㅤ | Width ㅤ | Width ㅤ | Area ㅤ |
|---|---|---|---|---|---|---|---|---|
1➔ | trash wood any | vid_000028_frame0000033.jpg | 270 x 480 | 72px | 26.67% | 158px | 32.92% | 1.03% |
2➔ | trash wood any | vid_000028_frame0000033.jpg | 270 x 480 | 72px | 26.67% | 158px | 32.92% | 8.78% |
3➔ | trash etc any | vid_000346_frame0000014.jpg | 270 x 480 | 15px | 5.56% | 17px | 3.54% | 0.13% |
4➔ | trash etc any | vid_000346_frame0000014.jpg | 270 x 480 | 15px | 5.56% | 17px | 3.54% | 0.2% |
5➔ | trash etc any | vid_000148_frame0000039.jpg | 360 x 480 | 93px | 25.83% | 97px | 20.21% | 3.73% |
6➔ | trash etc any | vid_000148_frame0000039.jpg | 360 x 480 | 94px | 26.11% | 97px | 20.21% | 5.28% |
7➔ | trash fishing gear any | vid_000148_frame0000039.jpg | 360 x 480 | 165px | 45.83% | 167px | 34.79% | 14.71% |
8➔ | trash fishing gear any | vid_000148_frame0000039.jpg | 360 x 480 | 12px | 3.33% | 12px | 2.5% | 0.05% |
9➔ | trash fishing gear any | vid_000148_frame0000039.jpg | 360 x 480 | 165px | 45.83% | 167px | 34.79% | 15.95% |
10➔ | trash wood any | vid_000235_frame0000017.jpg | 360 x 480 | 70px | 19.44% | 259px | 53.96% | 4.42% |
License #
Use of the data is free for academic teaching and research purposes. Attribution must be given to both the authors of this dataset and the original providers of the data, JAMSTEC. Attribution shall take the form of a reference in any associated academic papers, presentations, reports, or documents, as well as similar references on any materials made available via the internet (emails, websites, derivative datasets, etc.)
For commercial use of this dataset, you must obtain permission from JAMSTEC for the commercial use of their images. Please follow the instructions at http://www.godac.jamstec.go.jp/darwin/explain/1/e#condition to obtain permission for commercial use". You must still provide attribution to the authors of this dataset after obtaining commerical use permissions for JAMSTEC.
Citation #
If you make use of the TrashCan 1.0 data, please cite the following reference:
@dataset{TrashCan 1.0,
  author={Hong Jungseok and Fulton Michael and Sattar Junaed},
  title={TrashCan 1.0: An Instance-Segmentation Labeled Dataset of Trash Observations},
  year={2020},
  url={https://conservancy.umn.edu/handle/11299/214865}
}
If you are happy with Dataset Ninja and use provided visualizations and tools in your work, please cite us:
@misc{ visualization-tools-for-trash-can-dataset,
  title = { Visualization Tools for TrashCan 1.0 Dataset },
  type = { Computer Vision Tools },
  author = { Dataset Ninja },
  howpublished = { \url{ https://datasetninja.com/trash-can } },
  url = { https://datasetninja.com/trash-can },
  journal = { Dataset Ninja },
  publisher = { Dataset Ninja },
  year = { 2026 },
  month = { feb },
  note = { visited on 2026-02-04 },
}
Download #
Dataset TrashCan 1.0 can be downloaded in Supervisely format:
As an alternative, it can be downloaded with dataset-tools package:
pip install --upgrade dataset-tools
… using following python code:
import dataset_tools as dtools

dtools.download(dataset='TrashCan 1.0', dst_dir='~/dataset-ninja/')
Make sure not to overlook the python code example available on the Supervisely Developer Portal. It will give you a clear idea of how to effortlessly work with the downloaded dataset.
The data in original format can be downloaded here.
Disclaimer #
Our gal from the legal dep told us we need to post this:
Dataset Ninja provides visualizations and statistics for some datasets that can be found online and can be downloaded by general audience. Dataset Ninja is not a dataset hosting platform and can only be used for informational purposes. The platform does not claim any rights for the original content, including images, videos, annotations and descriptions. Joint publishing is prohibited.
You take full responsibility when you use datasets presented at Dataset Ninja, as well as other information, including visualizations and statistics we provide. You are in charge of compliance with any dataset license and all other permissions. You are required to navigate datasets homepage and make sure that you can use it. In case of any questions, get in touch with us at hello@datasetninja.com.


