

Introduction #
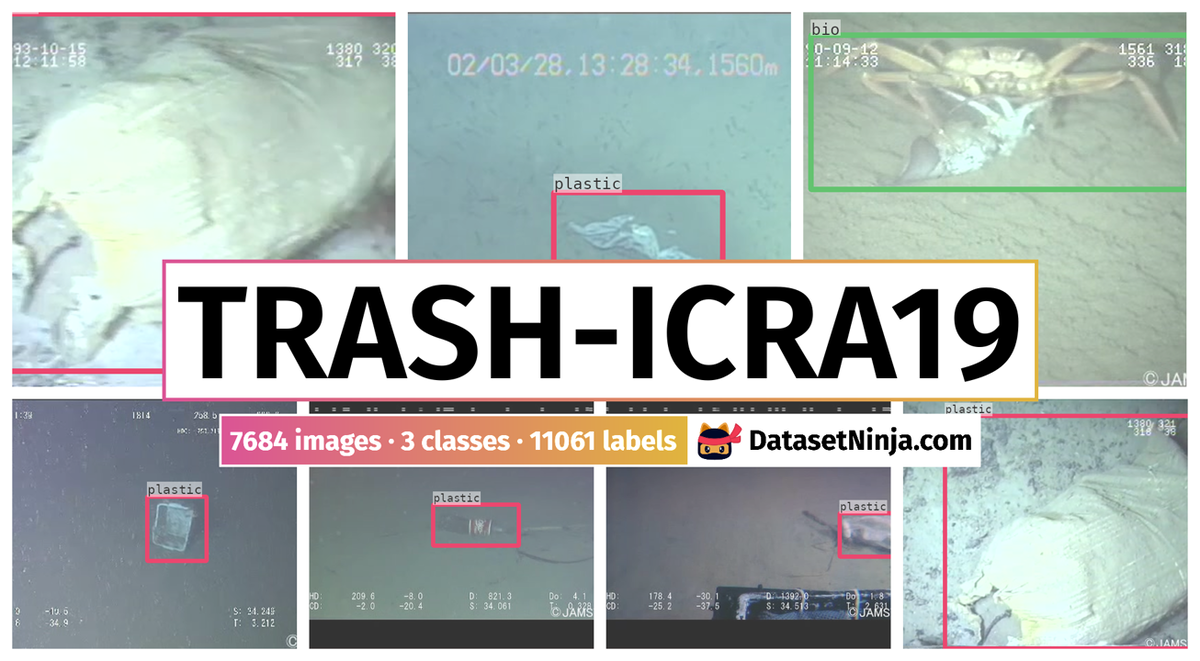
The authors create a large and publicly-available Trash-ICRA19: A Bounding Box Labeled Dataset of Underwater Trash of actual debris in open-water locations is annotated for training a number of convolutional neural network architectures for object detection. This data was sourced from the J-EDI dataset of marine debris. The videos that comprise that dataset vary greatly in quality, depth, objects in scenes, and the cameras used. They contain images of many different types of marine debris, captured from real-world environments, providing a variety of objects in different states of decay, occlusion, and overgrowth. Additionally, the clarity of the water and quality of the light vary significantly from video to video. These videos were processed to extract 5,700 images, which comprise this dataset, all labeled with bounding boxes on instances of plastic trash, biological objects such as plants and animals (bio), and rov.
Motivation
Marine debris poses a growing threat to the health of our planet. Beginning its life as discarded fishing gear, improperly recycled packaging, or simply discarded plastic grocery bags and soda bottles, marine debris makes its way into the ocean or another body of water by a number of means and remains there. There is virtually no place on earth that is unpolluted by marine debris, which kills and injures aquatic life, chokes ecosystems, and contaminates the water. Recycling and other efforts to keep debris out of the ocean have had limited impact. The vast amount of trash already in the ocean must somehow be removed. Despite the importance of this problem, there are few large-scale efforts attempting to combat it, due in part to the manpower required. The authors propose that a key element of an effective strategy for removing debris from marine environments is by using autonomous underwater vehicles (AUVs) to implement a trash detection and removal mechanism. They examine the problem of detecting debris, particularly plastic debris, in an underwater environment, the first of a set of capabilities needed for such AUVs. They consider a number of deep learning-based visual object detection algorithms, build a dataset to train and evaluate them on.
Detecting marine debris solely through visual observation poses significant challenges. Like many object detection tasks relying on visual cues, slight alterations in the surroundings can drastically alter an object’s appearance, particularly in underwater environments. Changes in lighting conditions, especially in shallower waters, and fluctuations in water turbidity can obscure or entirely conceal objects. Moreover, marine debris seldom maintains its original condition, often deteriorating over time, necessitating detectors capable of identifying various types of trash under any circumstances. Compounding the challenge is the sheer diversity of objects classified as marine debris, even within the subset of plastic materials, which is the primary focus due to its prevalence and ecological impact. To address this monumental task of detecting all forms of marine litter, the authors initial focus is on identifying plastic, a ubiquitous and highly detrimental type of debris found in today’s oceans.
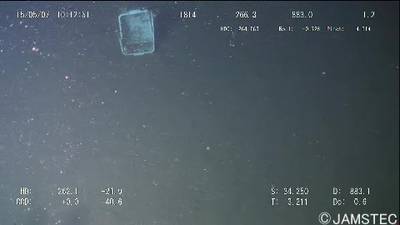
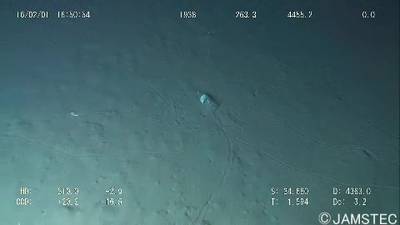
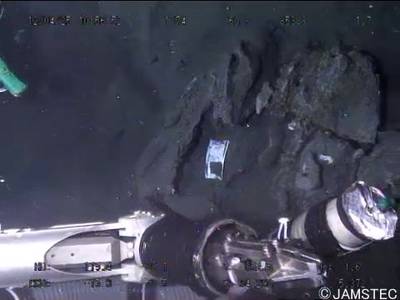
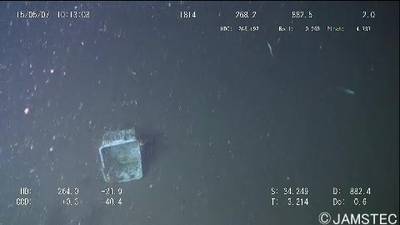
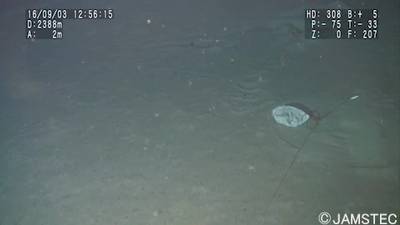
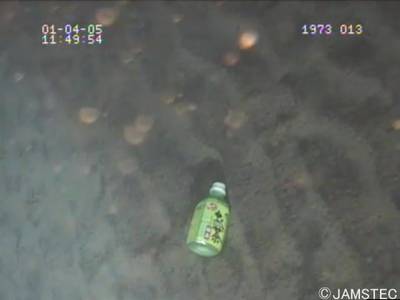
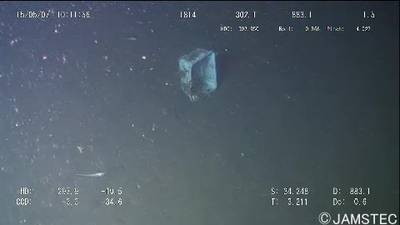
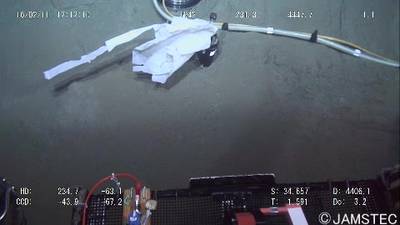
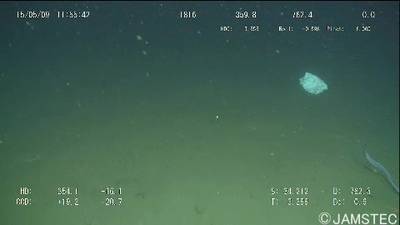
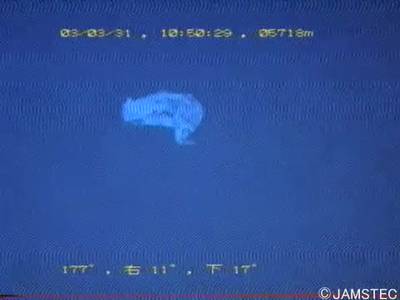
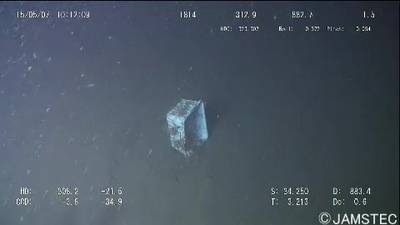
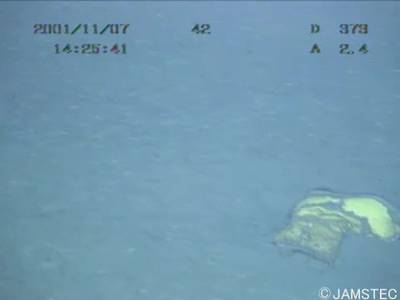
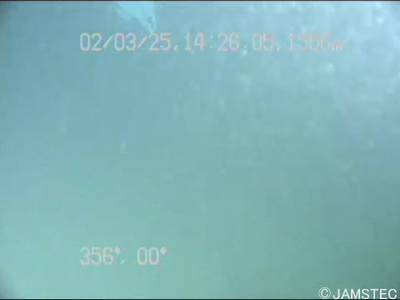
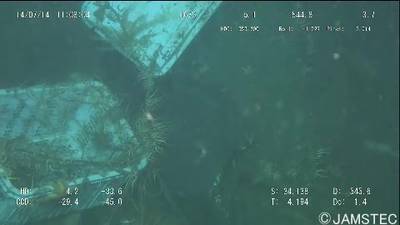
Examples of plastic and other refuse material in various marine environments. (a) A plastic bottle lying on the sea floor off the coast of Barbados; image collected by the authors, January 2018. (b) A beverage can on the sea bed off the coast of Japan, taken from the J-EDI dataset.
Dataset description
The dataset utilized in this study was obtained from the J-EDI dataset focusing on marine debris. The videos within this dataset exhibit considerable diversity in terms of quality, depth, scenes, and the cameras employed. They feature a wide array of marine debris types captured in authentic environments, presenting objects in various stages of degradation, obstruction, and overgrowth. Furthermore, the water clarity and lighting conditions vary significantly across different videos, enabling the creation of a training dataset that closely mirrors real-world scenarios, unlike previous studies that predominantly rely on artificially generated datasets. For training purposes, the authors extracted data from videos labeled as containing debris spanning from 2000 to 2017. From this subset, videos containing plastic debris were specifically selected, partly to streamline the dataset for practical use and also due to the critical importance of plastic as a type of marine debris. Subsequently, each video was sampled at a rate of three frames per second to generate images suitable for annotation in preparation for model training. This sampling process yielded over 240,000 frames, from which the most representative examples of plastic marine debris were identified and annotated. The final training dataset comprises 5,720 images, each with dimensions of 480x320 pixels.
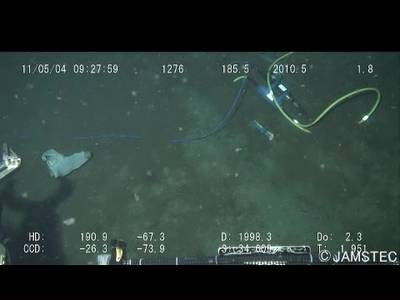
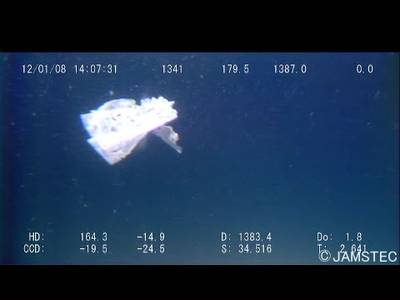
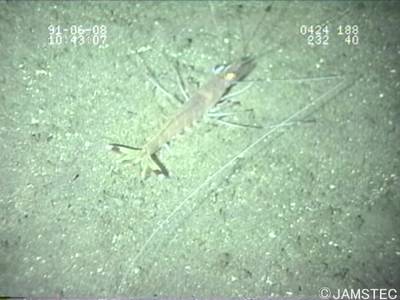
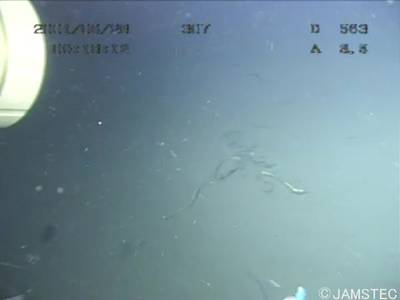
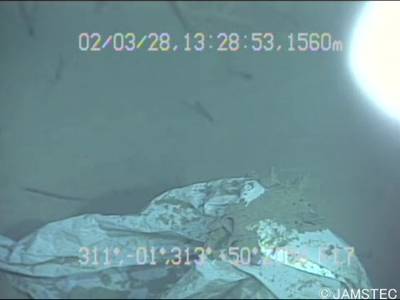
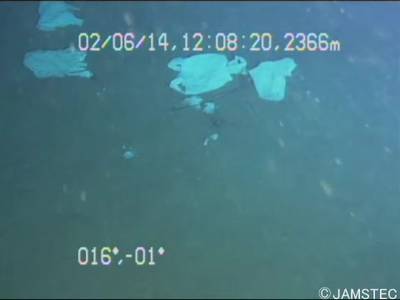
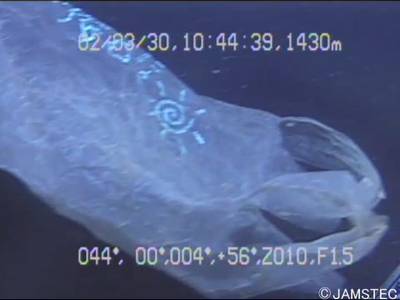
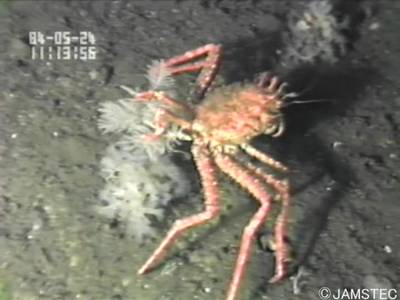
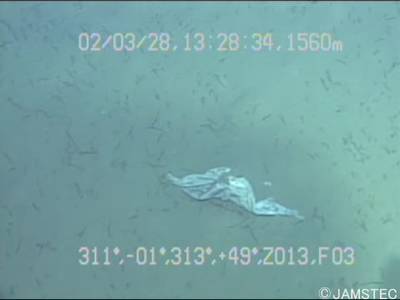
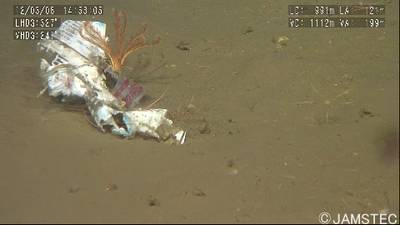
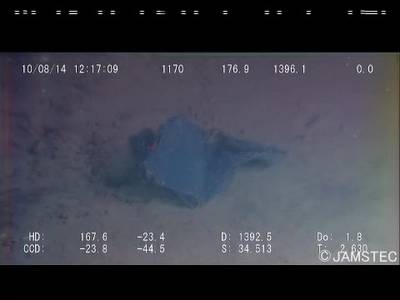
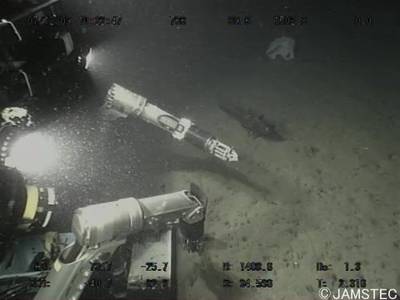
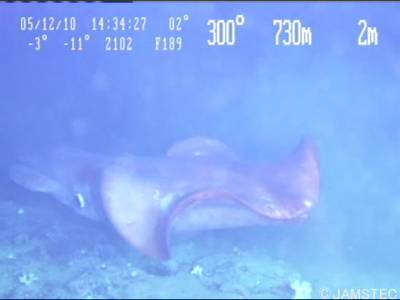
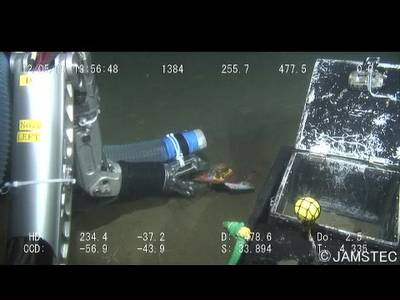
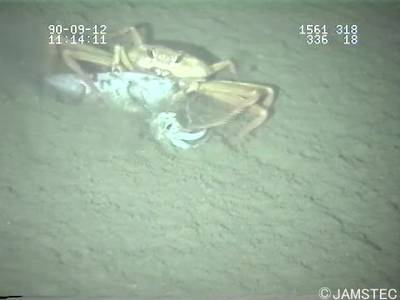
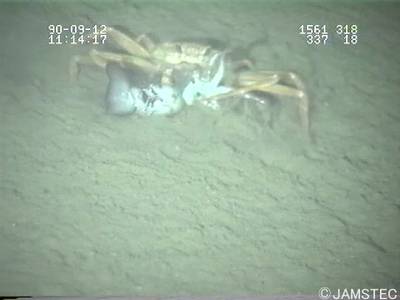
Example labeled image.
Dataset has three classes, defined as follows:
- plastic: Marine debris, all plastic materials.
- rov: All man-made objects (i.e., ROV, permanent sensors, etc), intentionally placed in the environment.
- bio: All natural biological material, including fish, plants, and biological detritus.
 Homepage
 Research Paper
Summary #
Trash-ICRA19: A Bounding Box Labeled Dataset of Underwater Trash is a dataset for object detection and identification tasks. It is used in the waste recycling, marine, and robotics industries.
The dataset consists of 7684 images with 11061 labeled objects belonging to 3 different classes including plastic, bio, and rov.
Images in the Trash-ICRA19 dataset have bounding box annotations. There is 1 unlabeled image (i.e. without annotations). There are 3 splits in the dataset: train (5720 images), test (1144 images), and val (820 images). Additionally, every image marked with its sequence tag. The dataset was released in 2018 by the University of Minnesota, USA.
Explore #
Trash-ICRA19 dataset has 7684 images. Click on one of the examples below or open "Explore" tool anytime you need to view dataset images with annotations. This tool has extended visualization capabilities like zoom, translation, objects table, custom filters and more. Hover the mouse over the images to hide or show annotations.


Class balance #
There are 3 annotation classes in the dataset. Find the general statistics and balances for every class in the table below. Click any row to preview images that have labels of the selected class. Sort by column to find the most rare or prevalent classes.

Class ㅤ | Images ㅤ | Objects ㅤ | Count on image average | Area on image average |
|---|---|---|---|---|
plastic➔ rectangle | 5868 | 6370 | 1.09 | 14.69% |
bio➔ rectangle | 1997 | 2417 | 1.21 | 24.05% |
rov➔ rectangle | 1771 | 2274 | 1.28 | 30.67% |
Co-occurrence matrix #
Co-occurrence matrix is an extremely valuable tool that shows you the images for every pair of classes: how many images have objects of both classes at the same time. If you click any cell, you will see those images. We added the tooltip with an explanation for every cell for your convenience, just hover the mouse over a cell to preview the description.
Images #
Explore every single image in the dataset with respect to the number of annotations of each class it has. Click a row to preview selected image. Sort by any column to find anomalies and edge cases. Use horizontal scroll if the table has many columns for a large number of classes in the dataset.
Object distribution #
Interactive heatmap chart for every class with object distribution shows how many images are in the dataset with a certain number of objects of a specific class. Users can click cell and see the list of all corresponding images.
Class sizes #
The table below gives various size properties of objects for every class. Click a row to see the image with annotations of the selected class. Sort columns to find classes with the smallest or largest objects or understand the size differences between classes.
Class | Object count | Avg area | Max area | Min area | Min height | Min height | Max height | Max height | Avg height | Avg height | Min width | Min width | Max width | Max width |
|---|---|---|---|---|---|---|---|---|---|---|---|---|---|---|
plastic rectangle | 6370 | 13.54% | 99.31% | 0.14% | 10px | 2.78% | 359px | 100% | 111px | 34.2% | 19px | 3.96% | 479px | 99.79% |
bio rectangle | 2417 | 19.94% | 99.1% | 0.16% | 16px | 4.44% | 359px | 99.72% | 131px | 36.9% | 17px | 3.54% | 479px | 99.79% |
rov rectangle | 2274 | 24.13% | 99.42% | 0.13% | 14px | 3.89% | 359px | 100% | 155px | 51.22% | 16px | 3.33% | 479px | 99.79% |
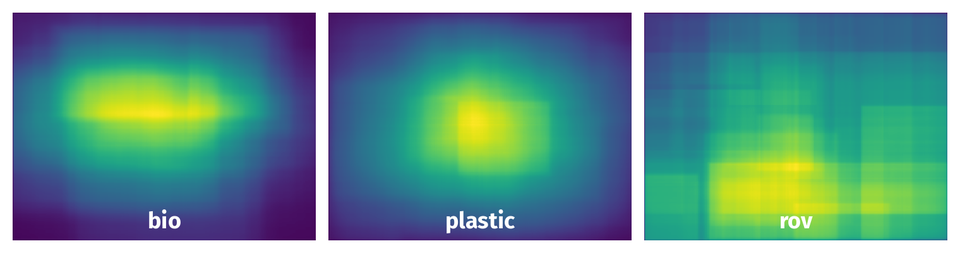
Spatial Heatmap #
The heatmaps below give the spatial distributions of all objects for every class. These visualizations provide insights into the most probable and rare object locations on the image. It helps analyze objects' placements in a dataset.
Objects #
Table contains all 11061 objects. Click a row to preview an image with annotations, and use search or pagination to navigate. Sort columns to find outliers in the dataset.
Object ID ㅤ | Class ㅤ | Image name click row to open | Image size height x width | Height ㅤ | Height ㅤ | Width ㅤ | Width ㅤ | Area ㅤ |
|---|---|---|---|---|---|---|---|---|
1➔ | bio rectangle | bio0016_frame0000317.jpg | 360 x 480 | 163px | 45.28% | 412px | 85.83% | 38.86% |
2➔ | bio rectangle | bio0017_frame0000065.jpg | 270 x 480 | 39px | 14.44% | 157px | 32.71% | 4.72% |
3➔ | plastic rectangle | obj0009_frame0000050.jpg | 360 x 480 | 77px | 21.39% | 112px | 23.33% | 4.99% |
4➔ | plastic rectangle | obj0009_frame0000006.jpg | 360 x 480 | 70px | 19.44% | 88px | 18.33% | 3.56% |
5➔ | plastic rectangle | obj1294_frame0000056.jpg | 270 x 480 | 173px | 64.07% | 193px | 40.21% | 25.76% |
6➔ | rov rectangle | obj1657_frame0000080.jpg | 270 x 480 | 128px | 47.41% | 215px | 44.79% | 21.23% |
7➔ | plastic rectangle | obj1657_frame0000080.jpg | 270 x 480 | 78px | 28.89% | 110px | 22.92% | 6.62% |
8➔ | rov rectangle | bio0001_frame0000368.jpg | 360 x 480 | 180px | 50% | 258px | 53.75% | 26.88% |
9➔ | bio rectangle | bio0001_frame0000368.jpg | 360 x 480 | 169px | 46.94% | 247px | 51.46% | 24.16% |
10➔ | rov rectangle | obj1654_frame0000253.jpg | 270 x 480 | 270px | 100% | 302px | 62.92% | 62.92% |
License #
Use of the data in this repository is free for academic teaching and research purposes. Attribution must be given to both the authors of this dataset and the original providers of the data, JAMSTEC. Attribution shall take the form of a reference in any associated academic papers, presentations, reports, or documents, as well as similar references on any materials made available via the internet (emails, websites, derivative datasets, etc.)
For commercial use of this dataset, you must obtain permission from JAMSTEC for the commercial use of their images. Please follow the instructions at http://www.godac.jamstec.go.jp/darwin/explain/1/e#condition to obtain permission for commercial use". You must still provide attribution to the authors of this dataset after obtaining commerical use permissions for JAMSTEC.
Citation #
If you make use of the Trash-ICRA19 data, please cite the following reference:
@dataset{Trash-ICRA19,
  author={Michael Fulton and Jungseok Hong and Jahidul Islam and Junaed Sattar},
  title={Trash-ICRA19: A Bounding Box Labeled Dataset of Underwater Trash},
  year={2018},
  url={https://conservancy.umn.edu/handle/11299/214366}
}
If you are happy with Dataset Ninja and use provided visualizations and tools in your work, please cite us:
@misc{ visualization-tools-for-trash-icra19-dataset,
  title = { Visualization Tools for Trash-ICRA19 Dataset },
  type = { Computer Vision Tools },
  author = { Dataset Ninja },
  howpublished = { \url{ https://datasetninja.com/trash-icra19 } },
  url = { https://datasetninja.com/trash-icra19 },
  journal = { Dataset Ninja },
  publisher = { Dataset Ninja },
  year = { 2026 },
  month = { jul },
  note = { visited on 2026-07-20 },
}
Download #
Please visit dataset homepage to download the data.
Afterward, you have the option to download it in the universal Supervisely format by utilizing the dataset-tools package:
pip install --upgrade dataset-tools
… using following python code:
import dataset_tools as dtools

dtools.download(dataset='Trash-ICRA19', dst_dir='~/dataset-ninja/')
Make sure not to overlook the python code example available on the Supervisely Developer Portal. It will give you a clear idea of how to effortlessly work with the downloaded dataset.
Disclaimer #
Our gal from the legal dep told us we need to post this:
Dataset Ninja provides visualizations and statistics for some datasets that can be found online and can be downloaded by general audience. Dataset Ninja is not a dataset hosting platform and can only be used for informational purposes. The platform does not claim any rights for the original content, including images, videos, annotations and descriptions. Joint publishing is prohibited.
You take full responsibility when you use datasets presented at Dataset Ninja, as well as other information, including visualizations and statistics we provide. You are in charge of compliance with any dataset license and all other permissions. You are required to navigate datasets homepage and make sure that you can use it. In case of any questions, get in touch with us at hello@datasetninja.com.