
Introduction #
The Tree Binary Segmentation dataset originates from the Biome App developed by Earthshot Labs. Biome is an iOS application designed for on-site tree measurements and the creation of forest inventories, which play a critical role in carbon accounting. The use of smartphones for collecting data on tree attributes such as diameter, height, species, and GPS coordinates is a well-suited approach. Beyond data collection, Biome offers a user-friendly data organization format for researchers and technicians.
While it is still in the developmental phase, Biome represents a significant leap forward in the field of forest inventory practices. Conventional methods rely on manual measurements involving tools like measuring tapes, stakes, clinometers, and notebooks. By transitioning to a digital approach, Biome has the potential to standardize and streamline the process of forest inventorying. Traditional methods are susceptible to human error, data loss, and variations in techniques across different regions. The development of a mobile application like Biome not only allows for larger and more standardized datasets but also enables untrained individuals to contribute to forest restoration projects.
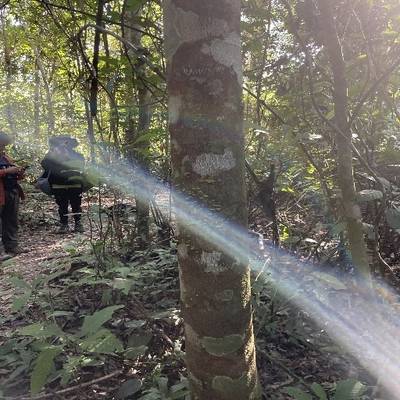
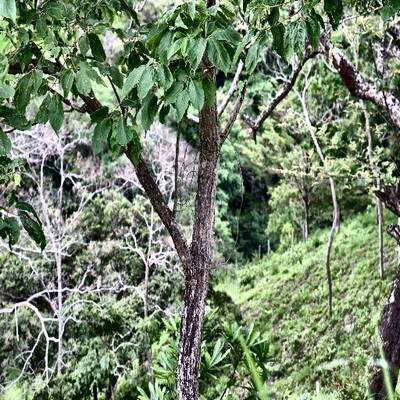
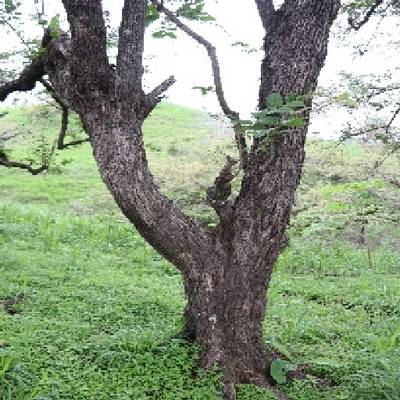
In a typical forest inventory, field workers use measuring tape to determine a tree’s diameter at a height of 1.3 meters, commonly referred to as “diameter at breast height” or “DBH.” This measurement represents the diameter of a tree’s trunk taken at the height of an average person’s chest. With the Biome app, capturing the DBH measurement becomes as simple as photographing a tree, marking a significant improvement over traditional methods. A measuring tape can be unwieldy, especially for large trees, often requiring two people. Trees may have uneven surfaces, thorns, or even house insects, such as venomous ants, making the non-contact approach offered by the app a substantial advantage.
One of the most noteworthy benefits of the Biome app is its speed. During a recent field trip to Panama, the research team conducted measurements in sample plots ranging from 5 to 10 meters in diameter. The team was divided into two groups: one using traditional methods (a team of three), and the other using the Biome application (a single person). This simple experiment clearly demonstrated that the Biome app was approximately five times faster at measuring the same plot compared to the three-person team using manual methods.

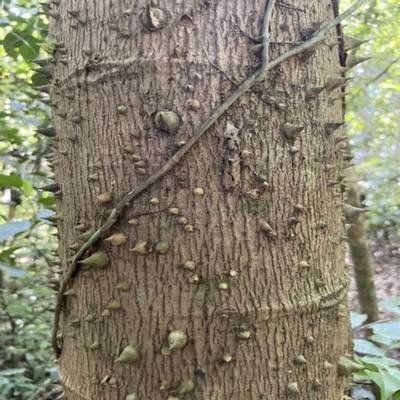
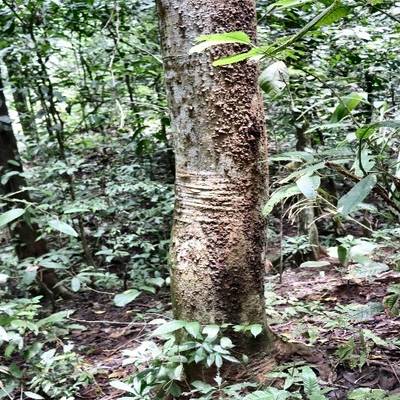
This palm tree with large spikes is extremely difficult to measure with DBH tape.

Measuring this spikey palm tree with Biome is easy. The segmentation does a good job even with the irregular trunk.
Authors have two machine learning models that make this possible: a binary semantic segmentation model and a regression model.
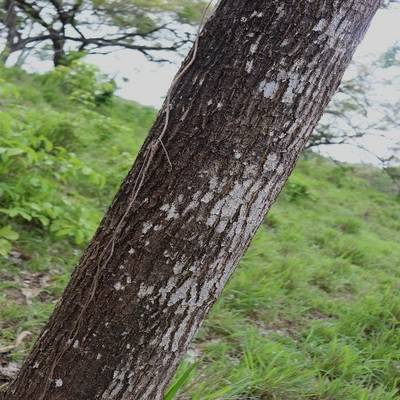
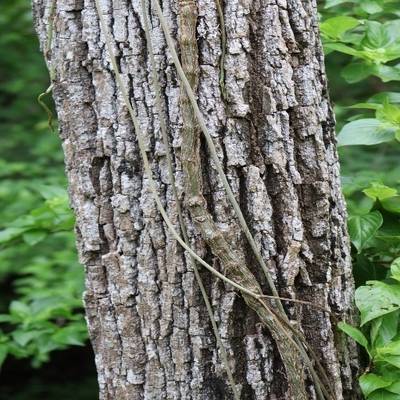
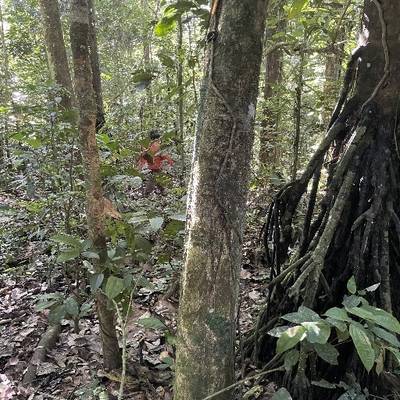
A binary semantic segmentation model is used to localize the trunk at a pixel level on the camera image, allowing us to determine the width of the trunk. The authors’ segmentation model is robust enough to recognize all types of trees, even oddly shaped ones that are common in the dense jungle environments where carbon projects take place. Many trees have bent trunks, spiky trunks, and vines growing around them, so authors developed their AI model for a diverse selection of trees.
In addition, the authors’ model was specifically trained to avoid “false positives”. When the user takes a picture of a post, a bottle, or a lamp, it won’t be detected as a tree. The model also focuses on a single tree in the foreground. This is important for the measurement process which can be hindered by multiple trees being grouped together.

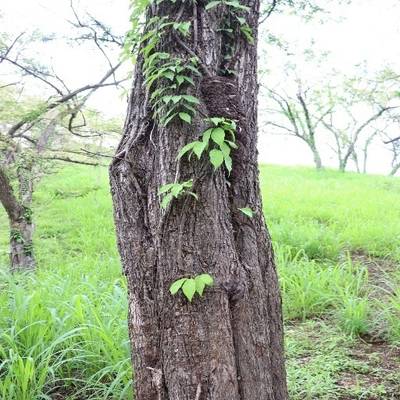
Author training set includes “false positives”, like this pole on a sidewalk.

Authors used Scale.ai for batch labelling, and then augmented the dataset for a result of 3030 pairs (img+mask). They store the datasets on Activeloop.
Biome also uses a regression model trained to correlate the diameter of a tree with the pixel width of the segmentation mask as well as the distance of the phone’s camera to the tree trunk. Authors are able to calculate the distance easily using the Lidar sensor on the most recent iPhones. The average error of their model in their test set was 1.66cm. Their test set was created by measuring several trees’ DBH with a DBH tape. The authors made sure to have a wide range of diameters (5-140cm) in the set in order to test a range of widths.

This graph shows the differences between Biome calculated DBH values versus manual measurements taken of the same trees. The goal here is to have the DBH measured with Biome as close as possible to the DBH measured by hand (green line). The closer the data points are to this line, the smaller their error is over traditional methods. In this case, the measurements with the Biome app match the DBH measured by hand reasonably well, except for the highest data point, which was measured manually at 140 cm while the Biome app estimated the diameter at ~118 cm.
The error for very small and very large trees represents the operating range authors initially assumed when gathering data. To improve the model, they plan to gather data outside the 10-100 cm range. Of course, there are many useful applications for measuring trees outside of this range, for example: measuring small saplings in the first few years of growth.
Please note the discrepancy in the number of images in the example(3030) and in the dataset(2718).
 Homepage
 Blog Post
Summary #
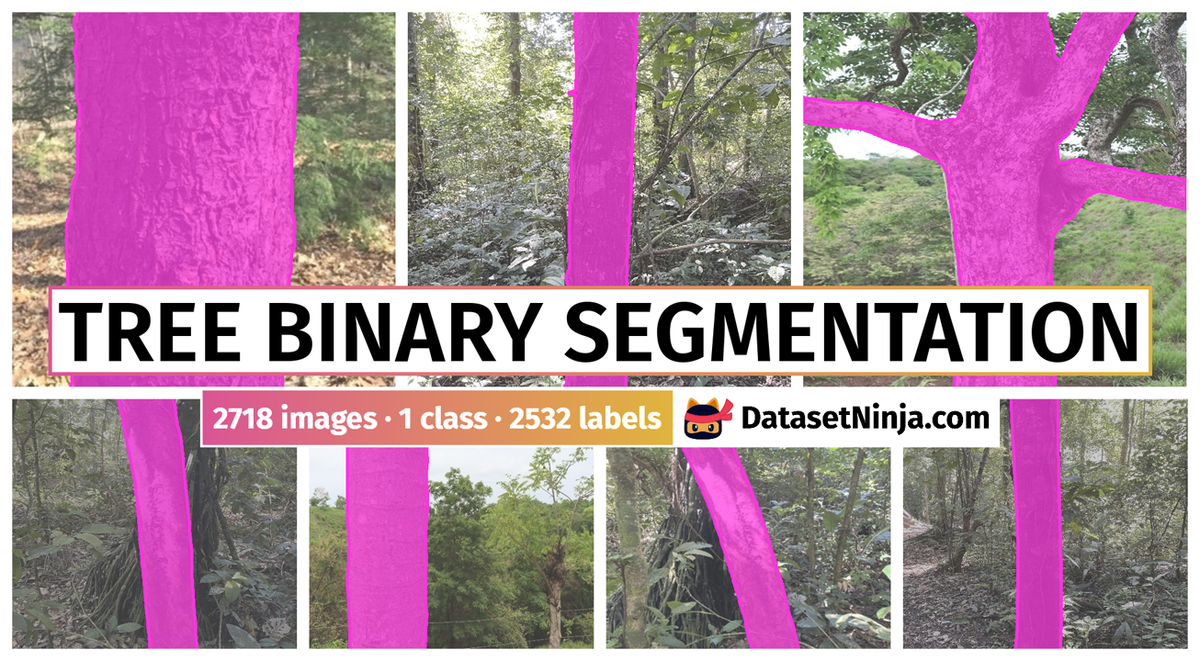
Tree Binary Segmentation is a dataset for a semantic segmentation task. It is used in the environmental industry.
The dataset consists of 2718 images with 2532 labeled objects belonging to 1 single class (tree).
Images in the Tree Binary Segmentation dataset have pixel-level semantic segmentation annotations. There are 186 (7% of the total) unlabeled images (i.e. without annotations). There are no pre-defined train/val/test splits in the dataset. The dataset was released in 2022 by the Earthshot Labs.
Explore #
Tree Binary Segmentation dataset has 2718 images. Click on one of the examples below or open "Explore" tool anytime you need to view dataset images with annotations. This tool has extended visualization capabilities like zoom, translation, objects table, custom filters and more. Hover the mouse over the images to hide or show annotations.


Class balance #
There are 1 annotation classes in the dataset. Find the general statistics and balances for every class in the table below. Click any row to preview images that have labels of the selected class. Sort by column to find the most rare or prevalent classes.

Class ㅤ | Images ㅤ | Objects ㅤ | Count on image average | Area on image average |
|---|---|---|---|---|
tree➔ mask | 2532 | 2532 | 1 | 24.82% |
Images #
Explore every single image in the dataset with respect to the number of annotations of each class it has. Click a row to preview selected image. Sort by any column to find anomalies and edge cases. Use horizontal scroll if the table has many columns for a large number of classes in the dataset.
Object distribution #
Interactive heatmap chart for every class with object distribution shows how many images are in the dataset with a certain number of objects of a specific class. Users can click cell and see the list of all corresponding images.
Class sizes #
The table below gives various size properties of objects for every class. Click a row to see the image with annotations of the selected class. Sort columns to find classes with the smallest or largest objects or understand the size differences between classes.
Class | Object count | Avg area | Max area | Min area | Min height | Min height | Max height | Max height | Avg height | Avg height | Min width | Min width | Max width | Max width |
|---|---|---|---|---|---|---|---|---|---|---|---|---|---|---|
tree mask | 2532 | 24.82% | 79.75% | 2.9% | 268px | 52.34% | 512px | 100% | 498px | 97.21% | 47px | 9.18% | 512px | 100% |
Spatial Heatmap #
The heatmaps below give the spatial distributions of all objects for every class. These visualizations provide insights into the most probable and rare object locations on the image. It helps analyze objects' placements in a dataset.
Objects #
Table contains all 2532 objects. Click a row to preview an image with annotations, and use search or pagination to navigate. Sort columns to find outliers in the dataset.
Object ID ㅤ | Class ㅤ | Image name click row to open | Image size height x width | Height ㅤ | Height ㅤ | Width ㅤ | Width ㅤ | Area ㅤ |
|---|---|---|---|---|---|---|---|---|
1➔ | tree mask | 1168.jpg | 512 x 512 | 512px | 100% | 80px | 15.62% | 8.68% |
2➔ | tree mask | 1720.jpg | 512 x 512 | 512px | 100% | 138px | 26.95% | 23.85% |
3➔ | tree mask | 2013.jpg | 512 x 512 | 512px | 100% | 66px | 12.89% | 5.97% |
4➔ | tree mask | 1912.jpg | 512 x 512 | 512px | 100% | 132px | 25.78% | 18.47% |
5➔ | tree mask | 558.jpg | 512 x 512 | 485px | 94.73% | 186px | 36.33% | 22.35% |
6➔ | tree mask | 2113.jpg | 512 x 512 | 512px | 100% | 402px | 78.52% | 75.13% |
7➔ | tree mask | 1221.jpg | 512 x 512 | 512px | 100% | 153px | 29.88% | 25.27% |
8➔ | tree mask | 1118.jpg | 512 x 512 | 455px | 88.87% | 448px | 87.5% | 31.41% |
9➔ | tree mask | 2126.jpg | 512 x 512 | 512px | 100% | 125px | 24.41% | 13.91% |
10➔ | tree mask | 239.jpg | 512 x 512 | 512px | 100% | 114px | 22.27% | 14.8% |
License #
License is unknown for the Tree Binary Segmentation dataset.
Citation #
If you make use of the Tree Binary Segmentation data, please cite the following reference:
@dataset{Tree Binary Segmentation,
  organization={Earthshot Labs},
  title={Tree Binary Segmentation},
  year={2022},
  url={https://www.kaggle.com/datasets/earthshot/tree-binary-segmentation}
}
If you are happy with Dataset Ninja and use provided visualizations and tools in your work, please cite us:
@misc{ visualization-tools-for-tree-binary-segmentation-dataset,
  title = { Visualization Tools for Tree Binary Segmentation Dataset },
  type = { Computer Vision Tools },
  author = { Dataset Ninja },
  howpublished = { \url{ https://datasetninja.com/tree-binary-segmentation } },
  url = { https://datasetninja.com/tree-binary-segmentation },
  journal = { Dataset Ninja },
  publisher = { Dataset Ninja },
  year = { 2026 },
  month = { jul },
  note = { visited on 2026-07-28 },
}
Download #
Please visit dataset homepage to download the data.
Disclaimer #
Our gal from the legal dep told us we need to post this:
Dataset Ninja provides visualizations and statistics for some datasets that can be found online and can be downloaded by general audience. Dataset Ninja is not a dataset hosting platform and can only be used for informational purposes. The platform does not claim any rights for the original content, including images, videos, annotations and descriptions. Joint publishing is prohibited.
You take full responsibility when you use datasets presented at Dataset Ninja, as well as other information, including visualizations and statistics we provide. You are in charge of compliance with any dataset license and all other permissions. You are required to navigate datasets homepage and make sure that you can use it. In case of any questions, get in touch with us at hello@datasetninja.com.