

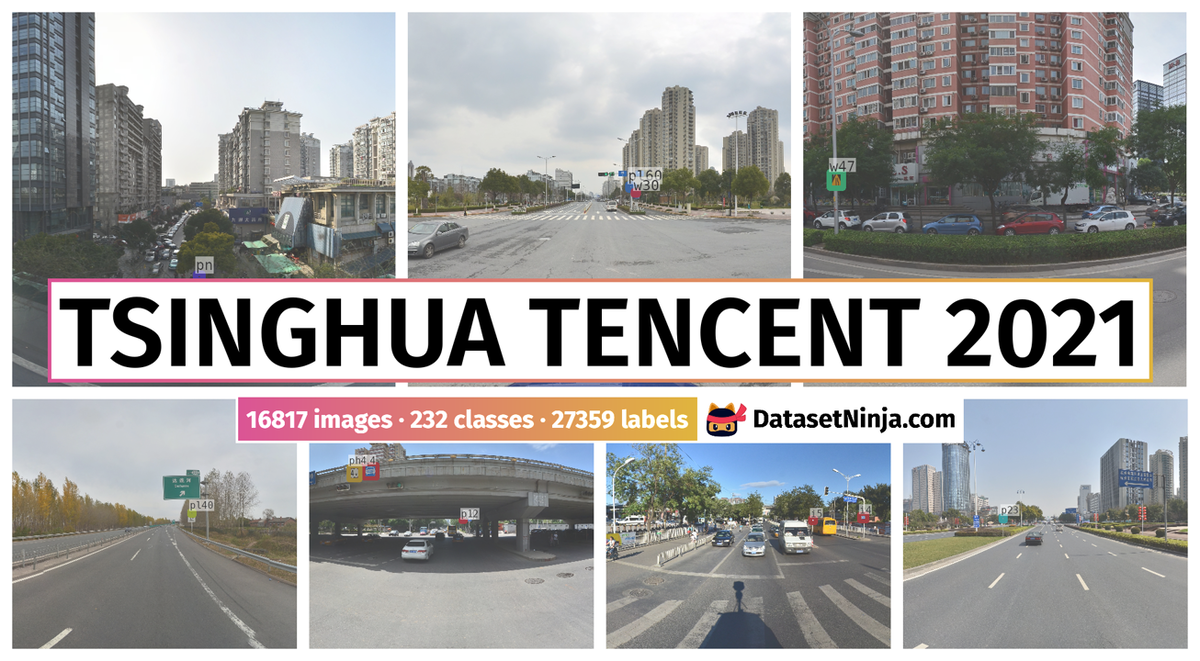
Introduction #
The authors have created a large traffic-sign benchmark from 100000 Tencent Street View panoramas, called Tsinghua Tencent 100K 2021 Dataset. It provides 100000 images containing 30000 traffic-sign instances. These images cover large variations in illuminance and weather conditions. Each traffic sign in the benchmark is annotated with a class label and bounding box.
Note, similar Tsinghua Tencent 100K 2021 Dataset datasets are also available on the DatasetNinja.com:
Motivation
Scene understanding is the ultimate goal of computer vision; detecting and classifying objects of various sizes in the scene is an important sub-task. Recently, deep learning methods have shown superior performance for many tasks such as image classification and speech recognition. Traffic signs may be divided into different categories according to function, and in each category they may be further divided into subclasses with similar generic shape and appearance but different details. This suggests traffic sign recognition should be carried out as a two-phase task: detection followed by classification. The detection step uses shared information to suggest bounding boxes that may contain traffic-signs in a specific category, while the classification step uses differences to determine which specific kind of sign is present (if any). Current methods achieve perfect or near perfect results for detection and classification tasks, with 100% recall and precision for detection and 99.67% precision for classification. While it may appear that these are thus solved problems, unfortunately, this benchmark data is not representative of that encountered in real tasks.
Chinese traffic-sign classes. Signs in yellow, red and blue boxes are warning, prohibitory and mandatory signs respectively. Each traffic sign has a unique label. Some signs shown are representative of a family (e.g. speed limit signs for different speeds). Such signs are generically denoted above (e.g. ‘pl*’); the unique label is determined by replacing ‘*’ by a specific value (e.g. ‘pl40’ for a 40 kmh speed limit sign).
Data collection
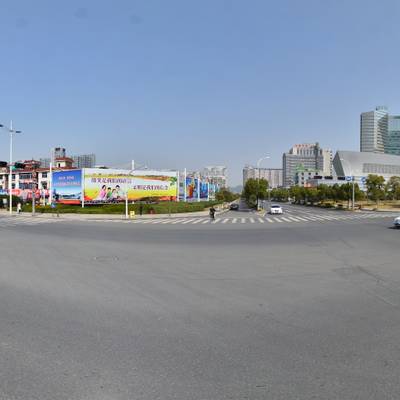
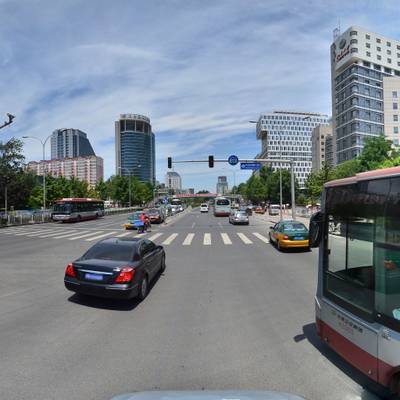
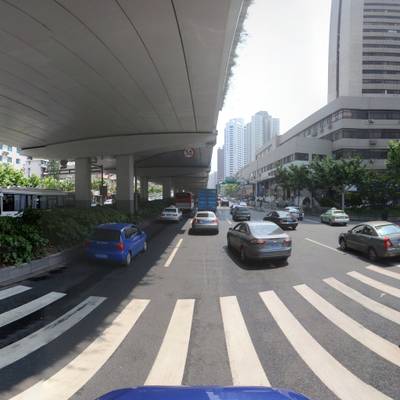
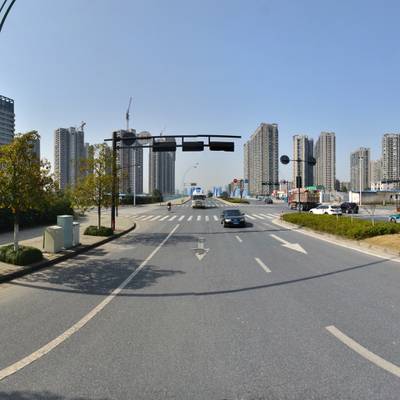
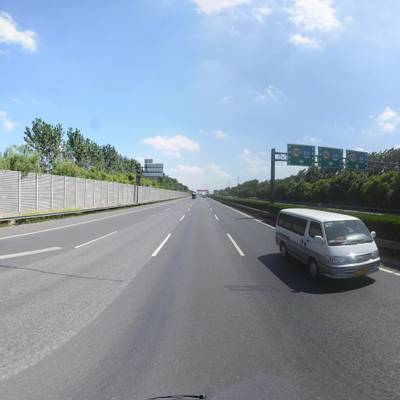
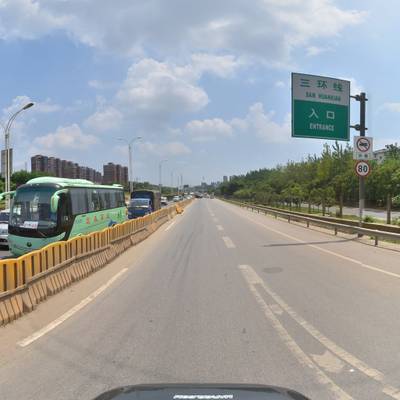
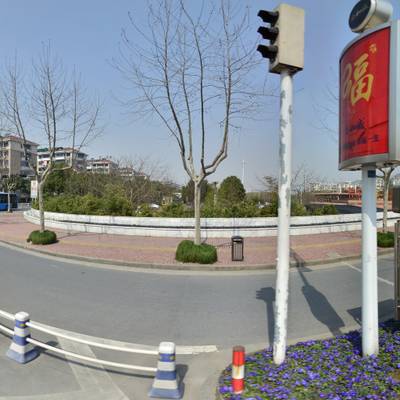
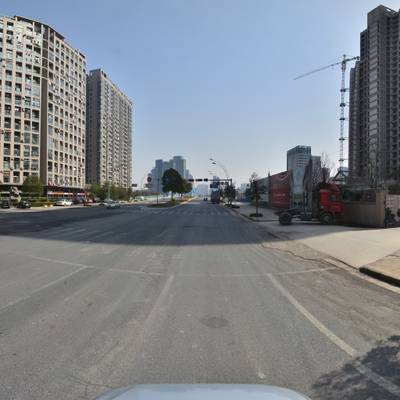
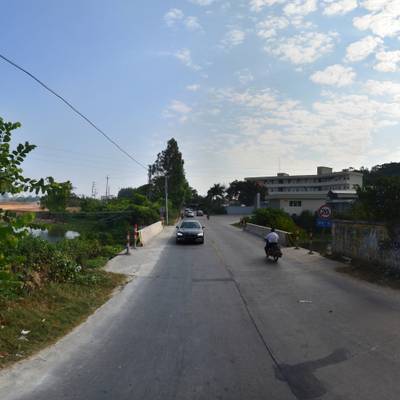
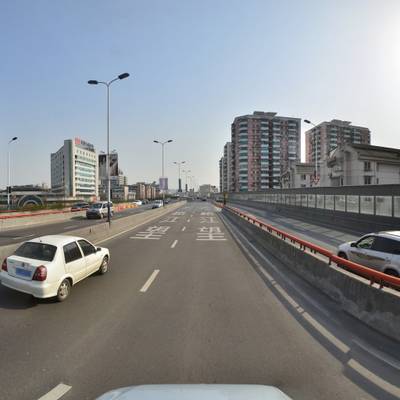
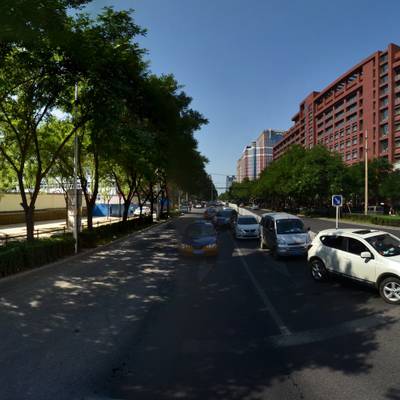
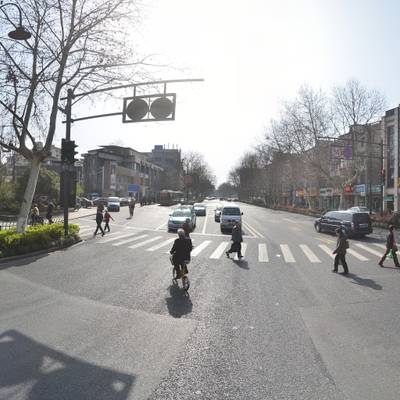
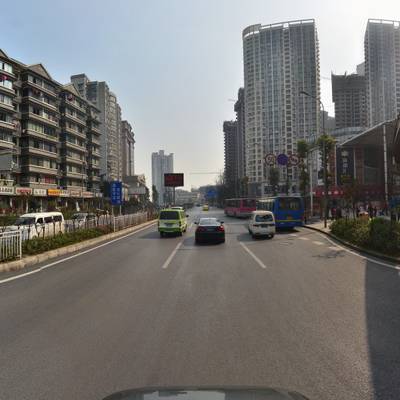
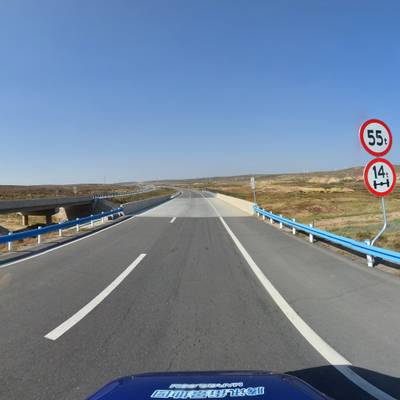
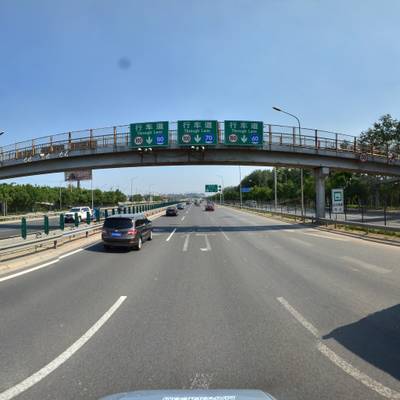
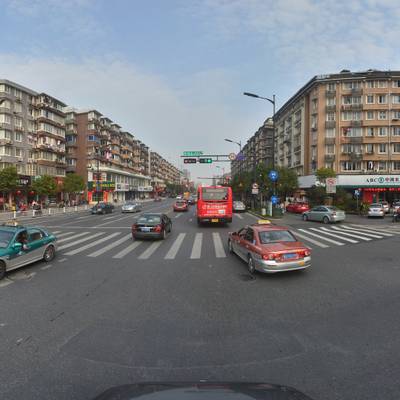
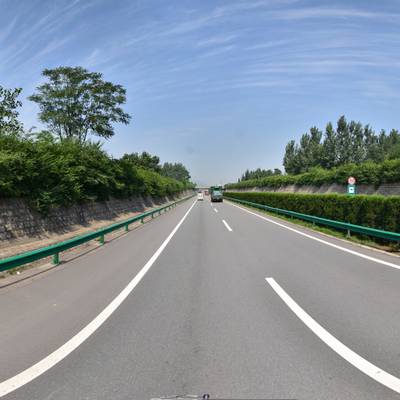
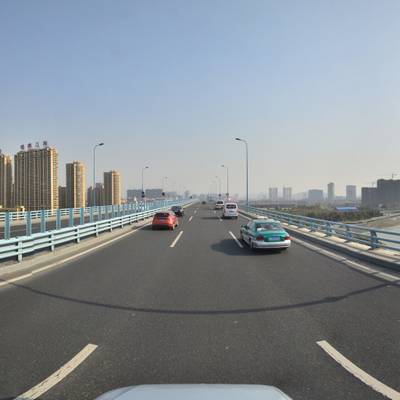
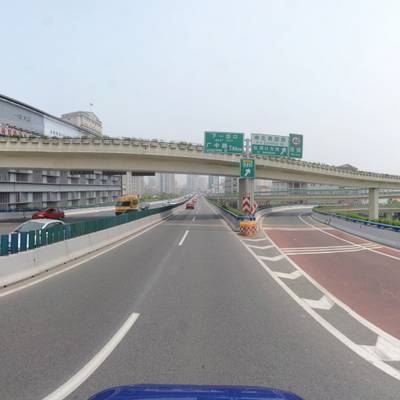
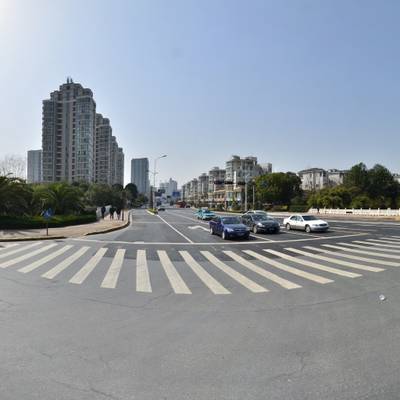
Presently, Tencent Street Views covers about 300 Chinese cities and the road networks linking them. The original panoramas were captured by 6 SLR cameras and then stitched together. Image processing techniques such as exposure adjustment were also used. Images were captured both from vehicles and shoulder-mounted equipment, at intervals of about 10 m. The nature of the images provides two benefits for our benchmark. Firstly, the appearances of an instance of a traffic sign in the authors benchmark vary significantly. Secondly, an instance of a traffic sign in successive images helps the participants constructing the
benchmark to correctly determine its classes: partially occluded or blurred traffic signs can be recognized from their occurrences in previous or subsequent shots. To create the benchmark images, the top 25% and bottom 25% of each panorama image was cropped off (as unlikely to contain any signs), and the remainder sliced vertically into 4 sub-images. The authors chose 10 regions from 5 different cities in China (including both downtown regions and suburbs for each city)
and downloaded 100000 panoramas from the Tencent Data Center.
8192×2048 panorama from Tencent Street View before slicing vertically into 4 images. Sky and ground at top and bottom have been cropped.
| Bounding box and class label | Pixel mask annotation |
|---|---|
Data annotation
The collected images were next annotated by hand. Traffic signs in China follow international patterns, and can be classified into three categories: warnings (mostly yellow triangles with a black boundary and information), prohibitions (mostly white surrounded by a red circle and also possibly having a diagonal bar), and mandatory (mostly blue circles with white information). Other signs exist that resemble traffic-signs but are in fact not. Such signs are placed in an ‘other’ class of a particular category. During traffic-sign annotation, the authors recorded the bounding box, boundary vertices and class label for the sign. The most complicated cases concern occluded signs.
Signs like traffic signs, but with other meanings.
Dataset statistics
The authors benchmark has 100000 cropped images after discarding some of the images only containing background. Of these, 10000 contain 30000 traffic signs in total. Although their source images cover much of China, an imbalance still exists between different classes of traffic signs. This is unavoidable: classes such as signs to warn the driver to be cautious on mountain roads appear rarely. The images have resolution 2048×2048 and cover large variations in illuminance and weather conditions.
Number of instances in each class, for classes with more than 100 instances.
Number of instances of each size.
 Homepage
 Research Paper
Summary #
Tsinghua Tencent 100K 2021 Dataset is a dataset for an object detection task. It is used in the automotive industry.
The dataset consists of 16817 images with 27359 labeled objects belonging to 232 different classes including pn, pne, i5, and other: p11, pl40, pl50, pl80, pl60, p26, i4, pl30, i2, i2r, p5, pl100, w57, pl5, il60, p10, i4l, ip, p23, il80, p13, pl120, w59, pr40, p12, and 204 more.
Images in the Tsinghua Tencent 2021 dataset have bounding box annotations. There are 6219 (37% of the total) unlabeled images (i.e. without annotations). There are 3 splits in the dataset: other (7641 images), train (6105 images), and test (3071 images). The dataset was released in 2021 by the Tsinghua University, China, Lehigh University Bethlehem, USA, and Tencent, China.
Explore #
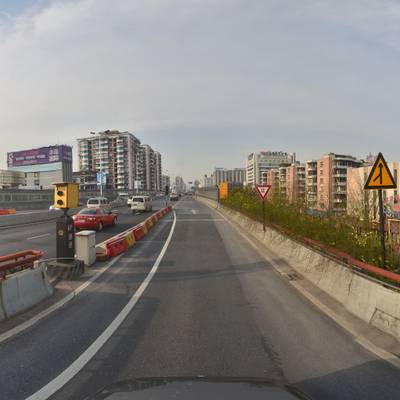
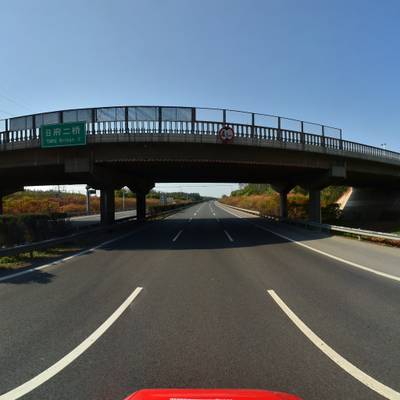
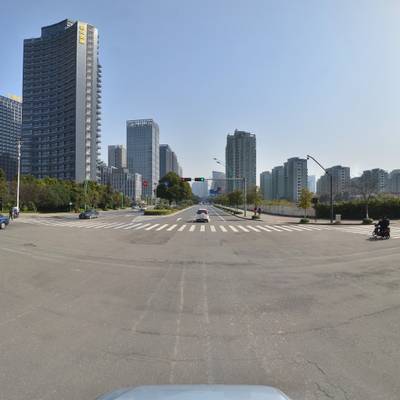
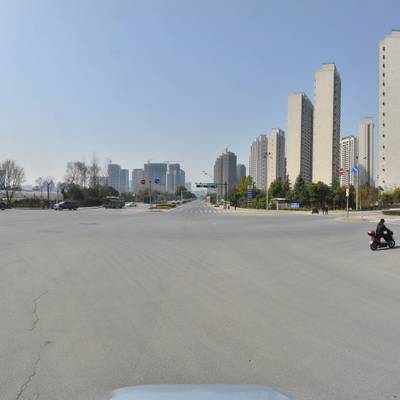
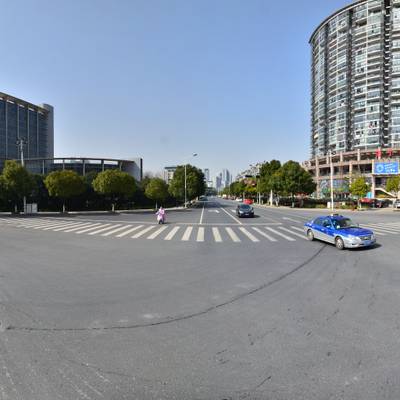
Tsinghua Tencent 2021 dataset has 16817 images. Click on one of the examples below or open "Explore" tool anytime you need to view dataset images with annotations. This tool has extended visualization capabilities like zoom, translation, objects table, custom filters and more. Hover the mouse over the images to hide or show annotations.


Class balance #
There are 232 annotation classes in the dataset. Find the general statistics and balances for every class in the table below. Click any row to preview images that have labels of the selected class. Sort by column to find the most rare or prevalent classes.

Class ㅤ | Images ㅤ | Objects ㅤ | Count on image average | Area on image average |
|---|---|---|---|---|
pn➔ rectangle | 3018 | 3178 | 1.05 | 0.06% |
pne➔ rectangle | 2142 | 2384 | 1.11 | 0.05% |
i5➔ rectangle | 1599 | 1734 | 1.08 | 0.05% |
p11➔ rectangle | 1560 | 1582 | 1.01 | 0.06% |
pl40➔ rectangle | 1376 | 1413 | 1.03 | 0.08% |
pl50➔ rectangle | 1062 | 1073 | 1.01 | 0.07% |
pl80➔ rectangle | 829 | 906 | 1.09 | 0.08% |
pl60➔ rectangle | 803 | 835 | 1.04 | 0.1% |
p26➔ rectangle | 786 | 840 | 1.07 | 0.07% |
i4➔ rectangle | 774 | 814 | 1.05 | 0.06% |
Images #
Explore every single image in the dataset with respect to the number of annotations of each class it has. Click a row to preview selected image. Sort by any column to find anomalies and edge cases. Use horizontal scroll if the table has many columns for a large number of classes in the dataset.
Class sizes #
The table below gives various size properties of objects for every class. Click a row to see the image with annotations of the selected class. Sort columns to find classes with the smallest or largest objects or understand the size differences between classes.
Class | Object count | Avg area | Max area | Min area | Min height | Min height | Max height | Max height | Avg height | Avg height | Min width | Min width | Max width | Max width |
|---|---|---|---|---|---|---|---|---|---|---|---|---|---|---|
pn rectangle | 3178 | 0.05% | 1.07% | 0% | 9px | 0.44% | 233px | 11.38% | 42px | 2.04% | 8px | 0.39% | 254px | 12.4% |
pne rectangle | 2384 | 0.04% | 2.34% | 0% | 7px | 0.34% | 344px | 16.8% | 40px | 1.95% | 7px | 0.34% | 285px | 13.92% |
i5 rectangle | 1734 | 0.05% | 0.85% | 0% | 10px | 0.49% | 233px | 11.38% | 41px | 2.01% | 8px | 0.39% | 168px | 8.2% |
p11 rectangle | 1582 | 0.06% | 1.34% | 0% | 12px | 0.59% | 299px | 14.6% | 44px | 2.14% | 9px | 0.44% | 308px | 15.04% |
pl40 rectangle | 1413 | 0.08% | 1.32% | 0% | 11px | 0.54% | 242px | 11.82% | 48px | 2.35% | 10px | 0.49% | 293px | 14.31% |
pl50 rectangle | 1073 | 0.07% | 1.12% | 0% | 9px | 0.44% | 221px | 10.79% | 45px | 2.18% | 9px | 0.44% | 241px | 11.77% |
pl80 rectangle | 906 | 0.08% | 1.13% | 0% | 13px | 0.63% | 215px | 10.5% | 50px | 2.45% | 11px | 0.54% | 273px | 13.33% |
p26 rectangle | 840 | 0.07% | 0.88% | 0% | 8px | 0.39% | 273px | 13.33% | 48px | 2.37% | 1px | 0.05% | 235px | 11.47% |
pl60 rectangle | 835 | 0.09% | 1.31% | 0% | 14px | 0.68% | 343px | 16.75% | 55px | 2.71% | 13px | 0.63% | 271px | 13.23% |
i4 rectangle | 814 | 0.06% | 0.97% | 0% | 12px | 0.59% | 211px | 10.3% | 44px | 2.16% | 8px | 0.39% | 233px | 11.38% |
Spatial Heatmap #
The heatmaps below give the spatial distributions of all objects for every class. These visualizations provide insights into the most probable and rare object locations on the image. It helps analyze objects' placements in a dataset.
Objects #
Table contains all 27359 objects. Click a row to preview an image with annotations, and use search or pagination to navigate. Sort columns to find outliers in the dataset.
Object ID ㅤ | Class ㅤ | Image name click row to open | Image size height x width | Height ㅤ | Height ㅤ | Width ㅤ | Width ㅤ | Area ㅤ |
|---|---|---|---|---|---|---|---|---|
1➔ | i5 rectangle | 64209.jpg | 2048 x 2048 | 81px | 3.96% | 72px | 3.52% | 0.14% |
2➔ | p11 rectangle | 64209.jpg | 2048 x 2048 | 63px | 3.08% | 51px | 2.49% | 0.08% |
3➔ | pl60 rectangle | 64209.jpg | 2048 x 2048 | 63px | 3.08% | 55px | 2.69% | 0.08% |
4➔ | pn rectangle | 64209.jpg | 2048 x 2048 | 59px | 2.88% | 50px | 2.44% | 0.07% |
5➔ | p11 rectangle | 44063.jpg | 2048 x 2048 | 29px | 1.42% | 29px | 1.42% | 0.02% |
6➔ | pl60 rectangle | 44063.jpg | 2048 x 2048 | 32px | 1.56% | 29px | 1.42% | 0.02% |
7➔ | pn rectangle | 44063.jpg | 2048 x 2048 | 30px | 1.46% | 26px | 1.27% | 0.02% |
8➔ | pl50 rectangle | 20084.jpg | 2048 x 2048 | 18px | 0.88% | 18px | 0.88% | 0.01% |
9➔ | pn rectangle | 20084.jpg | 2048 x 2048 | 20px | 0.98% | 19px | 0.93% | 0.01% |
10➔ | i4l rectangle | 20084.jpg | 2048 x 2048 | 17px | 0.83% | 18px | 0.88% | 0.01% |
License #
Tsinghua Tencent 100K 2021 Dataset is under CC BY-NC 2.0 license.
Citation #
If you make use of the Tsinghua Tencent 2021 data, please cite the following reference:
@InProceedings{Zhe_2016_CVPR,
  author = {Zhu, Zhe and Liang, Dun and Zhang, Songhai and Huang, Xiaolei and Li, Baoli and Hu, Shimin},
  title = {Traffic-Sign Detection and Classification in the Wild},
  booktitle = {The IEEE Conference on Computer Vision and Pattern Recognition (CVPR)},
  year = {2016}
}
If you are happy with Dataset Ninja and use provided visualizations and tools in your work, please cite us:
@misc{ visualization-tools-for-tt100k-dataset,
  title = { Visualization Tools for Tsinghua Tencent 2021 Dataset },
  type = { Computer Vision Tools },
  author = { Dataset Ninja },
  howpublished = { \url{ https://datasetninja.com/tt100k-2021 } },
  url = { https://datasetninja.com/tt100k-2021 },
  journal = { Dataset Ninja },
  publisher = { Dataset Ninja },
  year = { 2026 },
  month = { jul },
  note = { visited on 2026-07-15 },
}
Download #
Dataset Tsinghua Tencent 2021 can be downloaded in Supervisely format:
As an alternative, it can be downloaded with dataset-tools package:
pip install --upgrade dataset-tools
… using following python code:
import dataset_tools as dtools

dtools.download(dataset='Tsinghua Tencent 2021', dst_dir='~/dataset-ninja/')
Make sure not to overlook the python code example available on the Supervisely Developer Portal. It will give you a clear idea of how to effortlessly work with the downloaded dataset.
The data in original format can be downloaded here.
Disclaimer #
Our gal from the legal dep told us we need to post this:
Dataset Ninja provides visualizations and statistics for some datasets that can be found online and can be downloaded by general audience. Dataset Ninja is not a dataset hosting platform and can only be used for informational purposes. The platform does not claim any rights for the original content, including images, videos, annotations and descriptions. Joint publishing is prohibited.
You take full responsibility when you use datasets presented at Dataset Ninja, as well as other information, including visualizations and statistics we provide. You are in charge of compliance with any dataset license and all other permissions. You are required to navigate datasets homepage and make sure that you can use it. In case of any questions, get in touch with us at hello@datasetninja.com.