

Introduction #
The authors of the TTPLA dataset pursue the task of accurate detection and segmentation of transmission towers (TT) and power lines (PL) in Aerial images. This dataset addresses such challenges as their elongated and thin shapes, colour similarities to the background, and variations in object shape and scene characteristics. The TTPLA dataset comprises 1,100 aerial images, each with a resolution of 3,840 × 2,160 pixels. Additionally, the dataset offers manual annotations for 8,987 instances of TTs and PLs. Unlike other datasets, TTPLA supports not only detection and semantic segmentation but also instance segmentation, providing a comprehensive evaluation platform for computer vision models.
The dataset’s aerial images were extracted from UAV-taken videos and encompass various recording characteristics. To ensure comprehensive coverage, different view angles were captured, including front view, top view, and side view of TTs. This diverse approach aids in training deep learning models to recognize TTs from any perspective. The dataset also considers variations in zooming levels during image capture to accurately represent PLs, particularly in the presence of noisy backgrounds. Various time of day and weather conditions were considered when recording videos, contributing to the dataset’s realism. Backgrounds were given special attention to accurately capture PLs, as the UAV’s viewpoint often results in noisy backgrounds. The dataset reflects this reality by containing PL images with challenging backgrounds, resembling real-world conditions where PLs may exhibit “thin and long” features and blend into the surroundings.
For accurate instance-level labeling of TTs and PLs, the authors employed LabelME. Expert annotators meticulously outlined each instance with polygons. The annotations were consistent across annotators due to the dataset’s top-view orientation, minimal occlusions, clear labeling policies, and the high scrutiny applied by the three expert annotators. The authors provided annotated samples within the TTPLA dataset to showcase the quality of annotations and the dataset’s utility.
Overall, the authors’ TT/PL Aerial-image (TTPLA) dataset presents a valuable resource for advancing the field of object detection and segmentation, especially in the context of transmission towers and power lines within aerial images.
 Homepage
 Research Paper
Summary #
TTPLA: An Aerial-Image Dataset for Detection and Segmentation of Transmission Towers and Power Lines is a dataset for instance segmentation, semantic segmentation, and object detection tasks. It is used in the energy industry.
The dataset consists of 1234 images with 11447 labeled objects belonging to 5 different classes including cable, tower_lattice, tower_wooden, and other: tower_tucohy and void.
Images in the TTPLA dataset have pixel-level instance segmentation annotations. Due to the nature of the instance segmentation task, it can be automatically transformed into a semantic segmentation (only one mask for every class) or object detection (bounding boxes for every object) tasks. All images are labeled (i.e. with annotations). There are 3 splits in the dataset: train (905 images), test (220 images), and val (109 images). The dataset was released in 2020 by the University of South Carolina.
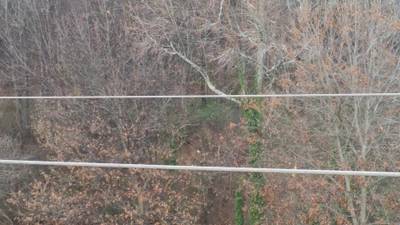
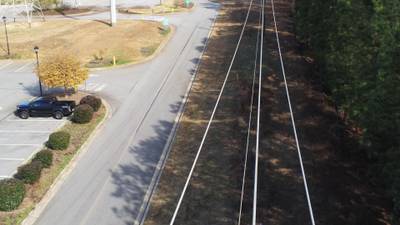
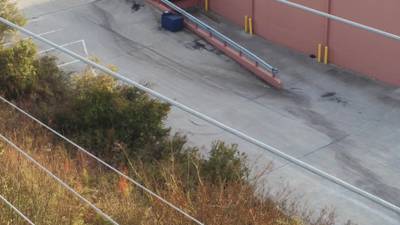
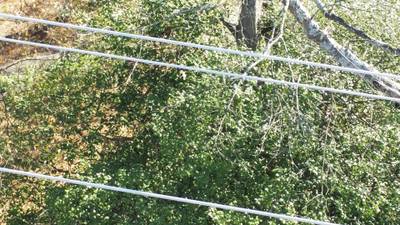
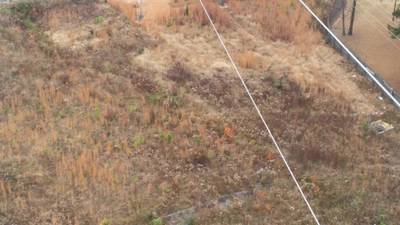
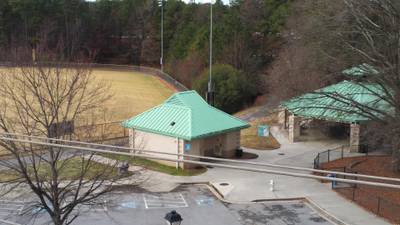
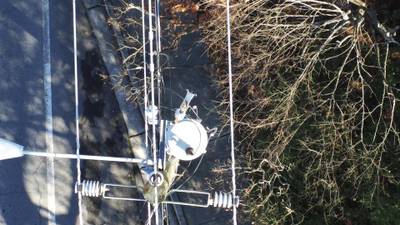
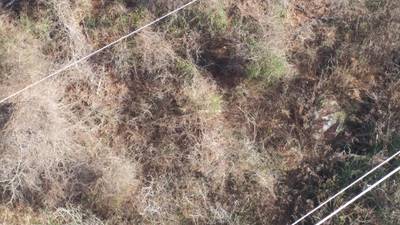
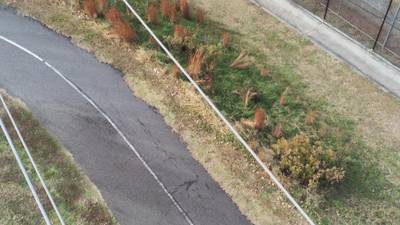
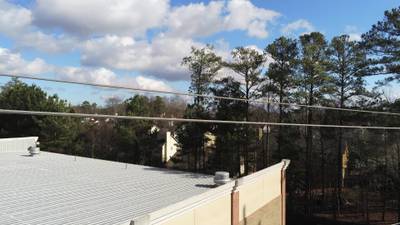
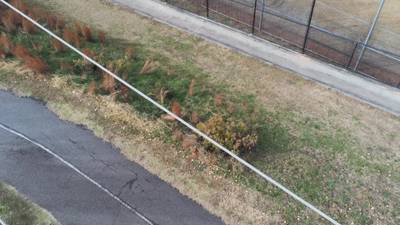
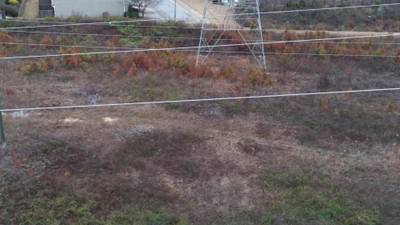
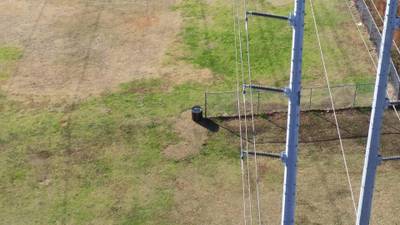
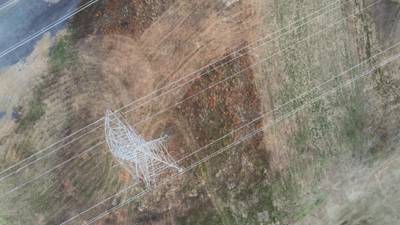
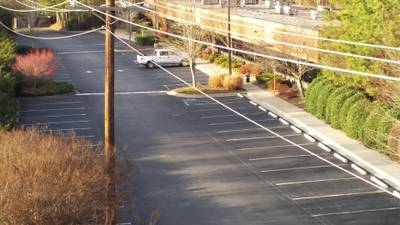
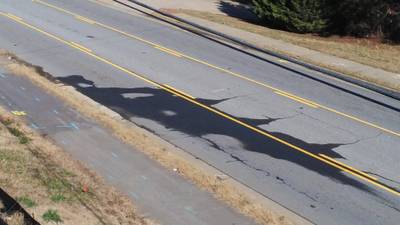
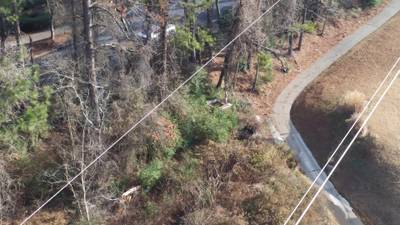
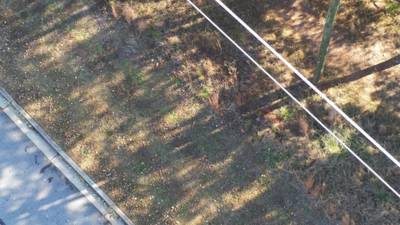
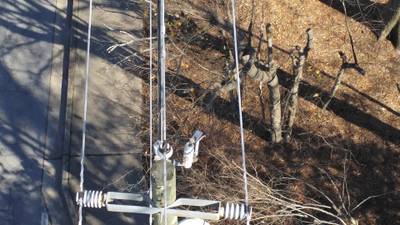
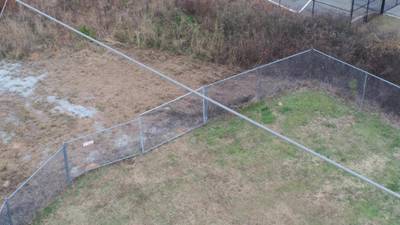
Here is the visualized example grid with animated annotations:
Explore #
TTPLA dataset has 1234 images. Click on one of the examples below or open "Explore" tool anytime you need to view dataset images with annotations. This tool has extended visualization capabilities like zoom, translation, objects table, custom filters and more. Hover the mouse over the images to hide or show annotations.


Class balance #
There are 5 annotation classes in the dataset. Find the general statistics and balances for every class in the table below. Click any row to preview images that have labels of the selected class. Sort by column to find the most rare or prevalent classes.

Class ㅤ | Images ㅤ | Objects ㅤ | Count on image average | Area on image average |
|---|---|---|---|---|
cable➔ polygon | 1223 | 10082 | 8.24 | 2.27% |
tower_lattice➔ polygon | 288 | 404 | 1.4 | 10.18% |
tower_wooden➔ polygon | 271 | 333 | 1.23 | 3.05% |
tower_tucohy➔ polygon | 161 | 232 | 1.44 | 4.75% |
void➔ polygon | 113 | 396 | 3.5 | 0.32% |
Co-occurrence matrix #
Co-occurrence matrix is an extremely valuable tool that shows you the images for every pair of classes: how many images have objects of both classes at the same time. If you click any cell, you will see those images. We added the tooltip with an explanation for every cell for your convenience, just hover the mouse over a cell to preview the description.
Images #
Explore every single image in the dataset with respect to the number of annotations of each class it has. Click a row to preview selected image. Sort by any column to find anomalies and edge cases. Use horizontal scroll if the table has many columns for a large number of classes in the dataset.
Object distribution #
Interactive heatmap chart for every class with object distribution shows how many images are in the dataset with a certain number of objects of a specific class. Users can click cell and see the list of all corresponding images.
Class sizes #
The table below gives various size properties of objects for every class. Click a row to see the image with annotations of the selected class. Sort columns to find classes with the smallest or largest objects or understand the size differences between classes.
Class | Object count | Avg area | Max area | Min area | Min height | Min height | Max height | Max height | Avg height | Avg height | Min width | Min width | Max width | Max width |
|---|---|---|---|---|---|---|---|---|---|---|---|---|---|---|
cable polygon | 10082 | 0.26% | 9.88% | 0% | 4px | 0.19% | 2160px | 100% | 766px | 35.45% | 4px | 0.1% | 3840px | 100% |
tower_lattice polygon | 404 | 7.22% | 58.28% | 0.04% | 59px | 2.73% | 2160px | 100% | 1226px | 56.77% | 34px | 0.89% | 3840px | 100% |
void polygon | 396 | 0.08% | 0.92% | 0% | 6px | 0.28% | 2160px | 100% | 453px | 20.98% | 5px | 0.13% | 3839px | 99.97% |
tower_wooden polygon | 333 | 2.46% | 43.61% | 0.01% | 112px | 5.19% | 2160px | 100% | 1061px | 49.12% | 25px | 0.65% | 3684px | 95.94% |
tower_tucohy polygon | 232 | 3.25% | 23.68% | 0.02% | 137px | 6.34% | 2160px | 100% | 1322px | 61.22% | 29px | 0.76% | 3385px | 88.15% |
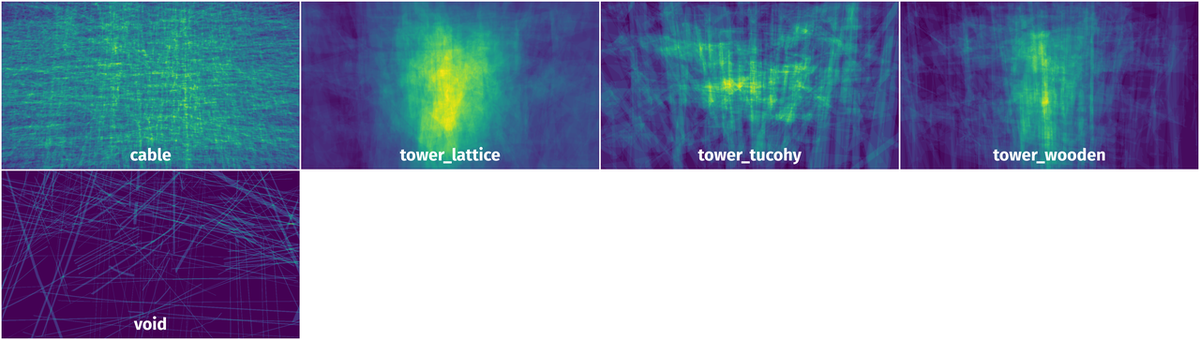
Spatial Heatmap #
The heatmaps below give the spatial distributions of all objects for every class. These visualizations provide insights into the most probable and rare object locations on the image. It helps analyze objects' placements in a dataset.
Objects #
Table contains all 11447 objects. Click a row to preview an image with annotations, and use search or pagination to navigate. Sort columns to find outliers in the dataset.
Object ID ㅤ | Class ㅤ | Image name click row to open | Image size height x width | Height ㅤ | Height ㅤ | Width ㅤ | Width ㅤ | Area ㅤ |
|---|---|---|---|---|---|---|---|---|
1➔ | cable polygon | 45_01811.jpg | 2160 x 3840 | 2160px | 100% | 1905px | 49.61% | 0.82% |
2➔ | cable polygon | 45_01811.jpg | 2160 x 3840 | 2160px | 100% | 1956px | 50.94% | 1.77% |
3➔ | cable polygon | 45_01811.jpg | 2160 x 3840 | 2159px | 99.95% | 1927px | 50.18% | 0.55% |
4➔ | cable polygon | 45_01811.jpg | 2160 x 3840 | 2160px | 100% | 1942px | 50.57% | 0.61% |
5➔ | cable polygon | 45_01811.jpg | 2160 x 3840 | 1993px | 92.27% | 1871px | 48.72% | 0.8% |
6➔ | cable polygon | 45_01811.jpg | 2160 x 3840 | 997px | 46.16% | 980px | 25.52% | 0.37% |
7➔ | cable polygon | 63_00296.jpg | 2160 x 3840 | 2160px | 100% | 18px | 0.47% | 0.26% |
8➔ | cable polygon | 63_00296.jpg | 2160 x 3840 | 2160px | 100% | 32px | 0.83% | 0.3% |
9➔ | cable polygon | 63_00296.jpg | 2160 x 3840 | 2160px | 100% | 46px | 1.2% | 0.28% |
10➔ | cable polygon | 63_00296.jpg | 2160 x 3840 | 956px | 44.26% | 310px | 8.07% | 0.23% |
License #
TTPLA: An Aerial-Image Dataset for Detection and Segmentation of Transmission Towers and Power Lines is under Apache 2.0 license.
Citation #
If you make use of the TTPLA data, please cite the following reference:
@inproceedings{abdelfattah2020ttpla,
    title={TTPLA: An Aerial-Image Dataset for Detection and Segmentation of Transmission Towers and Power Lines},
    author={Abdelfattah, Rabab and Wang, Xiaofeng and Wang, Song},
    booktitle={Proceedings of the Asian Conference on Computer Vision},
    year={2020}
}
If you are happy with Dataset Ninja and use provided visualizations and tools in your work, please cite us:
@misc{ visualization-tools-for-ttpla-dataset,
  title = { Visualization Tools for TTPLA Dataset },
  type = { Computer Vision Tools },
  author = { Dataset Ninja },
  howpublished = { \url{ https://datasetninja.com/ttpla } },
  url = { https://datasetninja.com/ttpla },
  journal = { Dataset Ninja },
  publisher = { Dataset Ninja },
  year = { 2026 },
  month = { aug },
  note = { visited on 2026-08-02 },
}
Download #
Dataset TTPLA can be downloaded in Supervisely format:
As an alternative, it can be downloaded with dataset-tools package:
pip install --upgrade dataset-tools
… using following python code:
import dataset_tools as dtools

dtools.download(dataset='TTPLA', dst_dir='~/dataset-ninja/')
Make sure not to overlook the python code example available on the Supervisely Developer Portal. It will give you a clear idea of how to effortlessly work with the downloaded dataset.
The data in original format can be downloaded here.
Disclaimer #
Our gal from the legal dep told us we need to post this:
Dataset Ninja provides visualizations and statistics for some datasets that can be found online and can be downloaded by general audience. Dataset Ninja is not a dataset hosting platform and can only be used for informational purposes. The platform does not claim any rights for the original content, including images, videos, annotations and descriptions. Joint publishing is prohibited.
You take full responsibility when you use datasets presented at Dataset Ninja, as well as other information, including visualizations and statistics we provide. You are in charge of compliance with any dataset license and all other permissions. You are required to navigate datasets homepage and make sure that you can use it. In case of any questions, get in touch with us at hello@datasetninja.com.