Introduction #
The authors of the UAVOD-10: 10 category UAV Small Weak Object Detection Dataset address the growing potential of imaging sensors utilized in remote sensing to capture high-resolution images that reveal intricate details of the Earth’s surface. This advancement allows for the detection of small-scale and weak-feature-response geospatial targets, a task of considerable importance in various applications. While existing efforts in small weak object detection predominantly center around processing satellite images, the authors recognized the significance of unmanned aerial vehicle (UAV) remote sensing images, which possess exceptionally high resolutions and shorter revisit intervals. Despite their potential, UAV images present unique challenges such as high intra-class variations, complex contexts, and noise, which have received relatively less attention.
To facilitate the remote sensing detection of small weak objects in UAV images, the authors introduced a new 10-category UAV object detection dataset termed UAVOD-10. This dataset encompasses diverse objects influenced by imaging conditions and contexts, with some objects exhibiting small scales and weak feature responses, making them particularly challenging to discern. To address these complexities, the authors proposed a context-scale-aware detector named CSADet. This detector incorporates a context-aware module for joint exploration of local and global contexts, along with a multi-scale feature refinement module for comprehensive feature extraction and sharing.
The authors emphasized the significance of small weak object detection in real-world scenarios, where geospatial objects often appear only partially within UAV images due to the distance between sensors and objects. This introduces challenges related to scale variations, complex backgrounds, and imaging conditions. Existing general-purpose detectors were deemed inadequate for such specific applications, necessitating the creation of a specialized dataset like UAVOD-10. This dataset is designed to address the limitations of existing datasets by encompassing a wider range of object categories, appearance variations, shadows, occlusions, and noise.
To address these challenges, CSADet was developed to effectively detect small weak objects in UAV images by leveraging context information and multiscale feature extraction. The proposed method demonstrated improved accuracy, as indicated by experimental results on the UAVOD-10 dataset. The authors’ contributions encompass the creation of a comprehensive UAVOD-10 dataset, the development of the CSADet detector, and the systematic evaluation of their combined effectiveness, showcasing improvements in detection accuracy.
The UAVOD-10 dataset comprises 844 images and a total of 18,234 instances, each annotated with horizontal bounding boxes (HBBs). The images exhibited widths ranging from 1000 to 4800 pixels, with an approximate resolution of 0.15 meters. Analysis of the dataset revealed class imbalance, where certain classes such as buildings and prefabricated houses were well-represented, while others like quarries, pools, and landslides had fewer instances. Objects within the same or different categories exhibited distinct scale differences. The smallest building instance had a width of 9 pixels, while the largest measured 312 pixels, with an average width of 74.85 pixels. Other classes like quarry, pool, and landslide displayed larger average widths and standard deviations, aligning with real-world scenarios.
| Category | Number | Object width (pixels) | |||
|---|---|---|---|---|---|
| Max | Min | Mean | Std | ||
| Building | 12,990 | 312 | 9 | 74.85 | 28.1 |
| Prefabricated house | 2060 | 876 | 12 | 47.77 | 35.11 |
| Ship | 1019 | 105 | 8 | 34.18 | 14.48 |
| Well | 648 | 115 | 9 | 33.51 | 11.78 |
| Cable tower | 587 | 245 | 5 | 53.23 | 44.64 |
| Vehicle | 506 | 133 | 10 | 24.71 | 12.1 |
| Cultivation mesh cage | 258 | 498 | 22 | 176.61 | 95.11 |
| Quarry | 83 | 1204 | 73 | 406.72 | 259.89 |
| Pool | 43 | 1946 | 20 | 211.76 | 269.89 |
| Landslide | 40 | 2044 | 57 | 526.24 | 461.7 |
| All instances | 18,234 | 2044 | 5 | 70.26 | 57.66 |
The authors of the dataset meticulously selected geospatial target categories to curate UAVOD-10. Utilizing a mountainous region in Liuzhi Special Economic Zone, Guizhou Province, China, as the study area, the authors identified ten classes of targets: building, prefabricated house, ship, well, cable tower, vehicle, cultivation mesh cage, quarry, pool, and landslide. This selection encompassed common targets present in high-resolution remote sensing (HRRS) datasets, alongside novel categories like well and cable tower, which aligned with the authors’ definition of small weak objects susceptible to occlusion and lighting conditions. Additionally, the authors included landslide, mesh cultivation cage, and quarry as research targets, addressing objects rarely explored in existing works despite not being small weak objects.
Summary #
UAVOD-10: 10 category UAV Small Weak Object Detection Dataset is a dataset for an object detection task. It is used in the small weak objects detection and drone inspection domains, and in the geospatial research.
The dataset consists of 844 images with 18334 labeled objects belonging to 10 different classes including building, prefabricated-house, well, and other: cable-tower, vehicle, ship, quarry, cultivation-mesh-cage, pool, and landslide.
Images in the UAVOD-10 dataset have bounding box annotations. All images are labeled (i.e. with annotations). There are no pre-defined train/val/test splits in the dataset. The dataset was released in 2022 by the China University of Geosciences.

Explore #
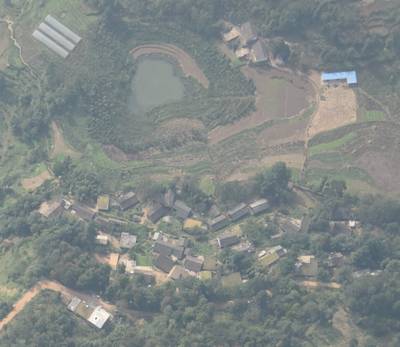
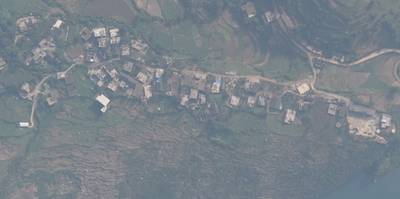
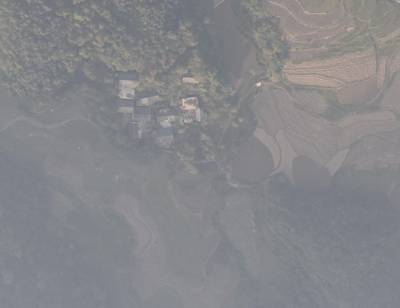
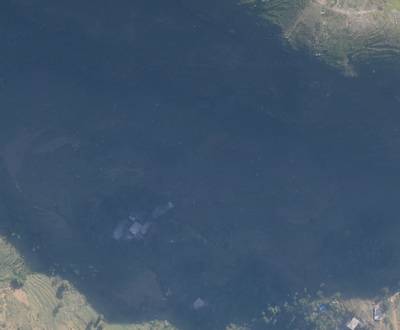
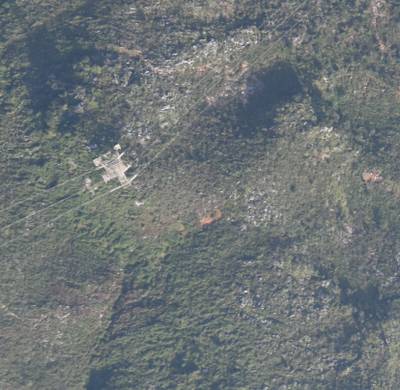
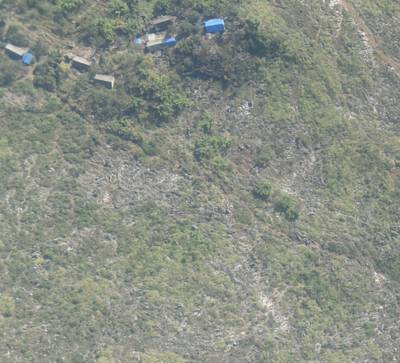
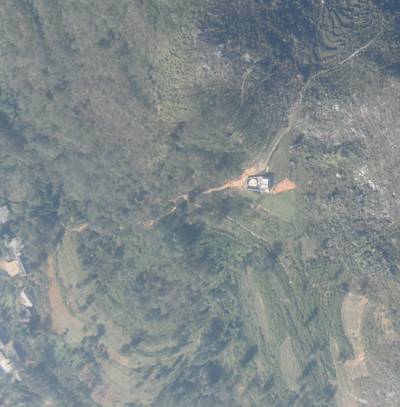
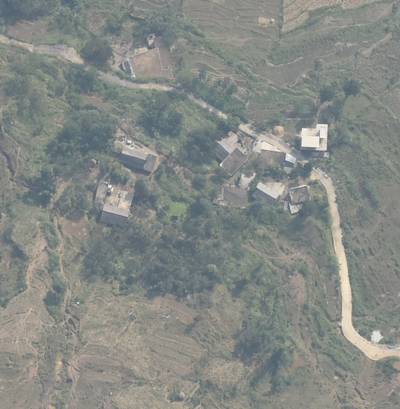
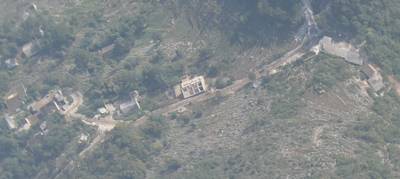
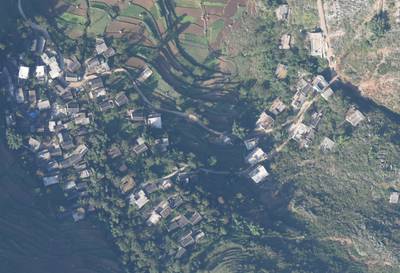
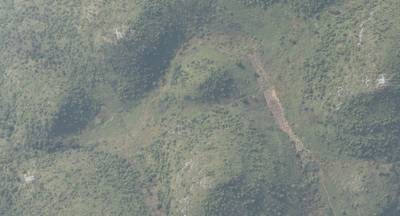
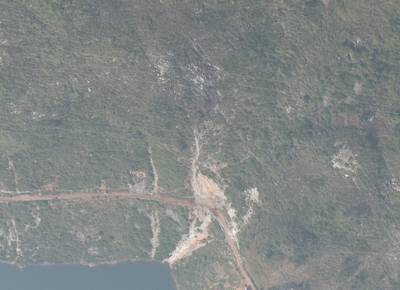
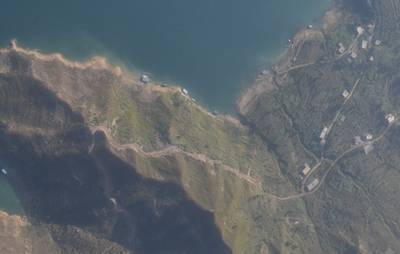
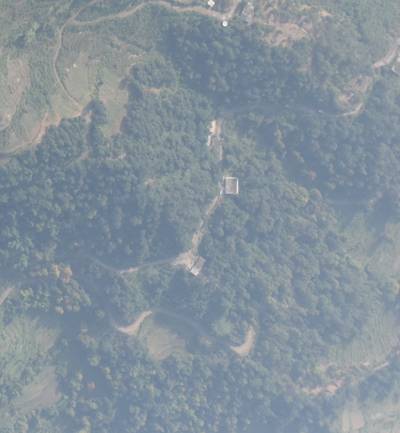
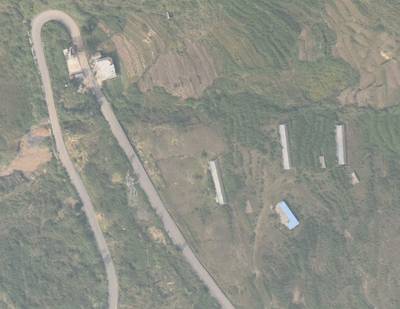
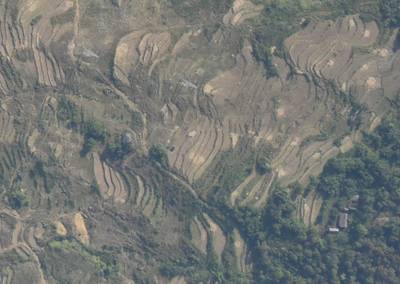
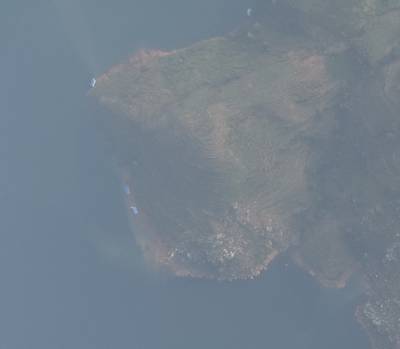
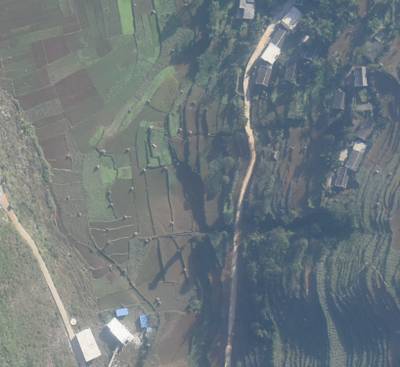
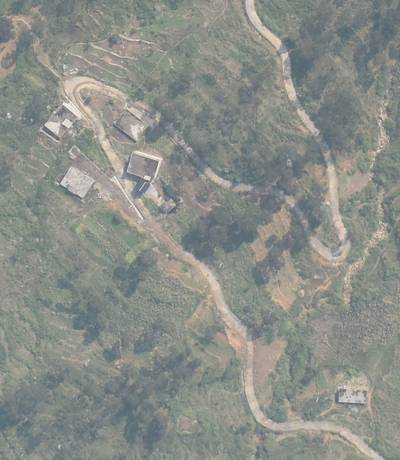
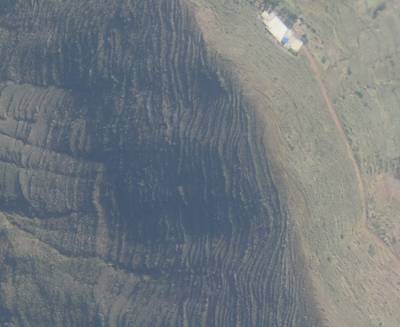
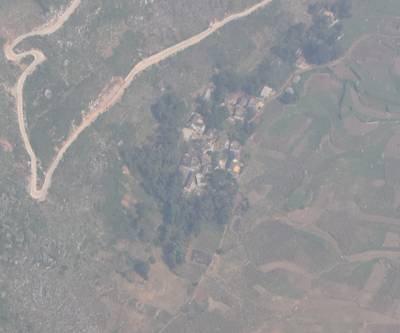
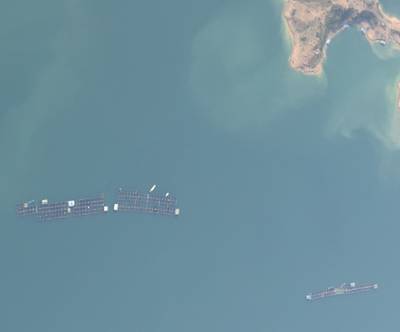
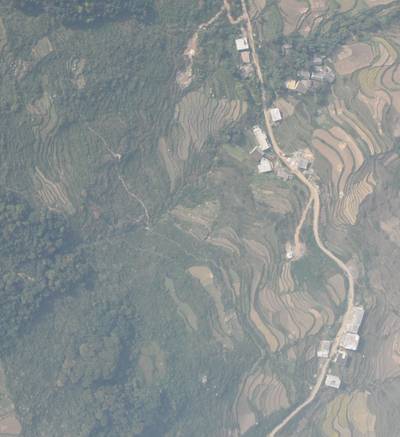
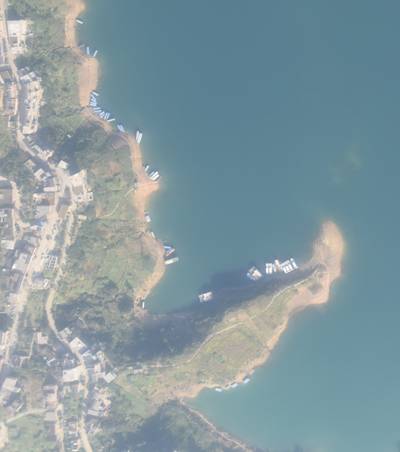
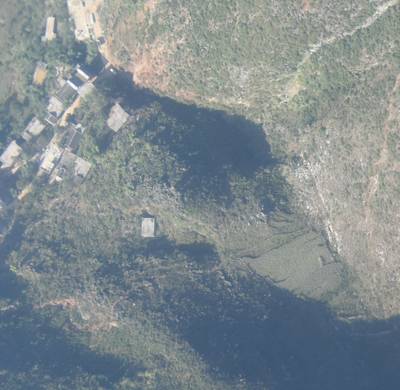
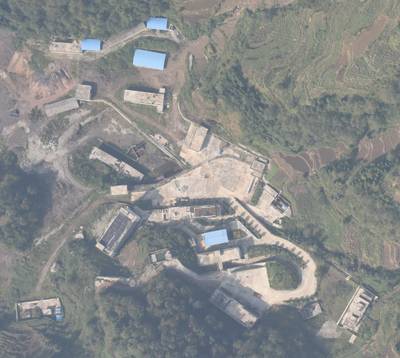
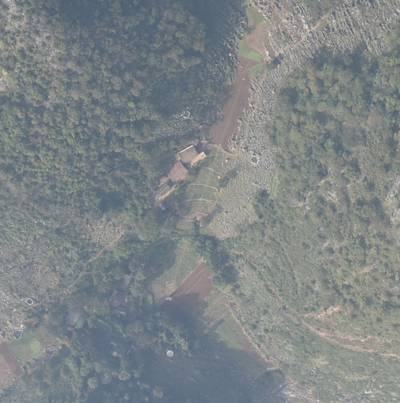
UAVOD-10 dataset has 844 images. Click on one of the examples below or open "Explore" tool anytime you need to view dataset images with annotations. This tool has extended visualization capabilities like zoom, translation, objects table, custom filters and more. Hover the mouse over the images to hide or show annotations.






























Class balance #
There are 10 annotation classes in the dataset. Find the general statistics and balances for every class in the table below. Click any row to preview images that have labels of the selected class. Sort by column to find the most rare or prevalent classes.
Class ㅤ | Images ㅤ | Objects ㅤ | Count on image average | Area on image average |
|---|---|---|---|---|
building➔ rectangle | 631 | 13034 | 20.66 | 3.84% |
prefabricated-house➔ rectangle | 413 | 2059 | 4.99 | 0.46% |
well➔ rectangle | 239 | 678 | 2.84 | 0.1% |
cable-tower➔ rectangle | 192 | 607 | 3.16 | 0.33% |
vehicle➔ rectangle | 162 | 493 | 3.04 | 0.06% |
ship➔ rectangle | 135 | 1027 | 7.61 | 0.26% |
quarry➔ rectangle | 69 | 83 | 1.2 | 6.15% |
cultivation-mesh-cage➔ rectangle | 64 | 264 | 4.12 | 3.8% |
pool➔ rectangle | 34 | 49 | 1.44 | 3.1% |
landslide➔ rectangle | 24 | 40 | 1.67 | 13.22% |
Co-occurrence matrix #
Co-occurrence matrix is an extremely valuable tool that shows you the images for every pair of classes: how many images have objects of both classes at the same time. If you click any cell, you will see those images. We added the tooltip with an explanation for every cell for your convenience, just hover the mouse over a cell to preview the description.
Images #
Explore every single image in the dataset with respect to the number of annotations of each class it has. Click a row to preview selected image. Sort by any column to find anomalies and edge cases. Use horizontal scroll if the table has many columns for a large number of classes in the dataset.
Class sizes #
The table below gives various size properties of objects for every class. Click a row to see the image with annotations of the selected class. Sort columns to find classes with the smallest or largest objects or understand the size differences between classes.
Class | Object count | Avg area | Max area | Min area | Min height | Min height | Max height | Max height | Avg height | Avg height | Min width | Min width | Max width | Max width |
|---|---|---|---|---|---|---|---|---|---|---|---|---|---|---|
building rectangle | 13034 | 0.2% | 3.46% | 0% | 9px | 0.44% | 367px | 22.67% | 76px | 4.32% | 9px | 0.33% | 382px | 20.31% |
prefabricated-house rectangle | 2059 | 0.1% | 14.79% | 0% | 12px | 0.64% | 593px | 37.04% | 48px | 2.63% | 8px | 0.33% | 1161px | 39.94% |
ship rectangle | 1027 | 0.04% | 0.4% | 0% | 8px | 0.31% | 145px | 11% | 37px | 2.05% | 6px | 0.26% | 99px | 7.25% |
well rectangle | 678 | 0.04% | 0.5% | 0% | 11px | 0.53% | 115px | 9.98% | 34px | 1.87% | 9px | 0.41% | 139px | 5.68% |
cable-tower rectangle | 607 | 0.1% | 1.45% | 0% | 6px | 0.34% | 251px | 18.56% | 57px | 2.88% | 4px | 0.2% | 243px | 11.26% |
vehicle rectangle | 493 | 0.02% | 0.53% | 0% | 10px | 0.4% | 127px | 7.33% | 26px | 1.38% | 6px | 0.2% | 155px | 8.14% |
cultivation-mesh-cage rectangle | 264 | 0.93% | 9.38% | 0.01% | 24px | 1.09% | 581px | 27.65% | 182px | 9.41% | 22px | 0.88% | 541px | 40.85% |
quarry rectangle | 83 | 5.12% | 62.37% | 0.15% | 54px | 3.22% | 1335px | 87.31% | 423px | 20.48% | 94px | 3.88% | 1075px | 71.43% |
pool rectangle | 49 | 2.17% | 61.99% | 0.01% | 23px | 0.73% | 1607px | 72.88% | 204px | 9.97% | 20px | 0.83% | 2288px | 85.06% |
landslide rectangle | 40 | 7.95% | 70.32% | 0.1% | 81px | 4.42% | 2412px | 99.31% | 571px | 24.8% | 36px | 2.13% | 1679px | 70.81% |
Spatial Heatmap #
The heatmaps below give the spatial distributions of all objects for every class. These visualizations provide insights into the most probable and rare object locations on the image. It helps analyze objects' placements in a dataset.

Objects #
Table contains all 18334 objects. Click a row to preview an image with annotations, and use search or pagination to navigate. Sort columns to find outliers in the dataset.
Object ID ㅤ | Class ㅤ | Image name click row to open | Image size height x width | Height ㅤ | Height ㅤ | Width ㅤ | Width ㅤ | Area ㅤ |
|---|---|---|---|---|---|---|---|---|
1➔ | well rectangle | 195.jpg | 2089 x 2545 | 33px | 1.58% | 34px | 1.34% | 0.02% |
2➔ | well rectangle | 195.jpg | 2089 x 2545 | 46px | 2.2% | 45px | 1.77% | 0.04% |
3➔ | well rectangle | 195.jpg | 2089 x 2545 | 53px | 2.54% | 52px | 2.04% | 0.05% |
4➔ | well rectangle | 195.jpg | 2089 x 2545 | 38px | 1.82% | 35px | 1.38% | 0.03% |
5➔ | well rectangle | 195.jpg | 2089 x 2545 | 34px | 1.63% | 35px | 1.38% | 0.02% |
6➔ | well rectangle | 195.jpg | 2089 x 2545 | 31px | 1.48% | 32px | 1.26% | 0.02% |
7➔ | building rectangle | 195.jpg | 2089 x 2545 | 17px | 0.81% | 17px | 0.67% | 0.01% |
8➔ | building rectangle | 195.jpg | 2089 x 2545 | 77px | 3.69% | 65px | 2.55% | 0.09% |
9➔ | building rectangle | 195.jpg | 2089 x 2545 | 103px | 4.93% | 76px | 2.99% | 0.15% |
10➔ | building rectangle | 195.jpg | 2089 x 2545 | 90px | 4.31% | 63px | 2.48% | 0.11% |
License #
UAVOD-10: 10 category UAV Small Weak Object Detection Dataset is under CC BY-NC-ND 4.0 license.
Citation #
If you make use of the UAV Small Object Detection (UAVOD-10) data, please cite the following reference:
@article{HAN2022102966,
  title = {A context-scale-aware detector and a new benchmark for remote sensing small weak object detection in unmanned aerial vehicle images},
  journal = {Int. J. Appl. Earth Obs. Geoinformation},
  volume = {112},
  pages = {102966},
  year = {2022},
  issn = {1569-8432},
  doi = {https://doi.org/10.1016/j.jag.2022.102966},
  author = {Wei Han and Jun Li and Sheng Wang and Yi Wang and Jining Yan and Runyu Fan and Xiaohan Zhang and Lizhe Wang},
}

@article{small-weak-object-detection-survey,
  author    = {Wei Han and Jia chen and Lizhe Wang and Ruyi Feng and Fengpeng Li and Lin Wu and Tian Tian and Jining Yan},
  title     = {A survey on methods of small weak object detection in optical high-resolution remote sensing images},
  journal   = {{IEEE} Geosci. Remote. Sens. Mag.},
  pages     = {8--34},
  year      = {2021},
  volume = {9},
  issue = {4}
}

@article{hard_example_mining,
  author    = {Wei Han and Runyu Fan and Lizhe Wang and Ruyi Feng and Fengpeng Li and Ze Deng and Xiaodao Chen},
  title     = {Improving Training Instance Quality in Aerial Image Object Detection with A Sampling-balance based Multi-stage Network},
  journal   = {{IEEE} Trans. Geosci. Remote. Sens.},
  pages     = {1--15},
  year      = {2020}
}
If you are happy with Dataset Ninja and use provided visualizations and tools in your work, please cite us:
@misc{ visualization-tools-for-uav-small-object-detection-dataset,
  title = { Visualization Tools for UAVOD-10 Dataset },
  type = { Computer Vision Tools },
  author = { Dataset Ninja },
  howpublished = { \url{ https://datasetninja.com/uav-small-object-detection } },
  url = { https://datasetninja.com/uav-small-object-detection },
  journal = { Dataset Ninja },
  publisher = { Dataset Ninja },
  year = { 2026 },
  month = { feb },
  note = { visited on 2026-02-04 },
}
Download #
Dataset UAVOD-10 can be downloaded in Supervisely format:
As an alternative, it can be downloaded with dataset-tools package:
pip install --upgrade dataset-tools
… using following python code:
import dataset_tools as dtools

dtools.download(dataset='UAVOD-10', dst_dir='~/dataset-ninja/')
Make sure not to overlook the python code example available on the Supervisely Developer Portal. It will give you a clear idea of how to effortlessly work with the downloaded dataset.
The data in original format can be downloaded here.
Disclaimer #
Our gal from the legal dep told us we need to post this:
Dataset Ninja provides visualizations and statistics for some datasets that can be found online and can be downloaded by general audience. Dataset Ninja is not a dataset hosting platform and can only be used for informational purposes. The platform does not claim any rights for the original content, including images, videos, annotations and descriptions. Joint publishing is prohibited.
You take full responsibility when you use datasets presented at Dataset Ninja, as well as other information, including visualizations and statistics we provide. You are in charge of compliance with any dataset license and all other permissions. You are required to navigate datasets homepage and make sure that you can use it. In case of any questions, get in touch with us at hello@datasetninja.com.


