

Introduction #
The authors constructed a new UAVDT Dataset focused on complex scenarios with new level challenges. Selected from 10 hours raw videos, about 80, 000 representative frames are fully annotated with bounding boxes as well as up to 14 kinds of attributes (e.g., weather condition, flying altitude, camera view, vehicle category, and occlusion) for three fundamental computer vision tasks: object detection, single object tracking, and multiple object tracking.
Motivation
The rapid advancement of artificial intelligence has led to a growing demand for more efficient and effective intelligent vision systems. Addressing increasingly complex tasks in computer vision, such as object recognition, behavior analysis, and motion tracking, has prompted researchers to develop numerous foundational detection and tracking algorithms over the past decades. To ensure fair evaluation of these algorithms, the computer vision community has curated a wealth of datasets specifically designed for detection and tracking tasks. However, a common limitation of these datasets is their reliance on videos captured by fixed or car-mounted cameras, restricting viewing angles in surveillance scenarios. With the thriving global drone industry, Unmanned Aerial Vehicles (UAVs) have found applications in various domains including security, surveillance, search and rescue operations, and sports analysis. Unlike traditional surveillance cameras, UAVs equipped with moving cameras offer several inherent advantages, such as easy deployment, high mobility, expansive field of view, and consistent scale. Thus it brings new challenges to existing detection and tracking technologies, such as:
- High density. Since UAV cameras are flexible to capture videos at wider view angle than fixed cameras, leading to large object number.
- Small object. Objects are usually small or tiny due to high altitude of UAV views, resulting in difficulties to detect and track them.
- Camera motion. Objects move very fast or rotate drastically due to the high-speed flying or camera rotation of UAVs.
- Realtime issues. The algorithms should consider realtime issues and maintain comparable accuracy on embedded UAV platforms for practical application.
Dataset description
The authors construct a large scale challenging UAV Detection and Tracking (UAVDT) benchmark (about 80, 000 representative frames from 10 hours raw videos) for 3 important fundamental tasks, i.e., object DETection (DET), Single Object Tracking (SOT) and Multiple Object Tracking (MOT). The dataset is captured by UAVs in various complex scenarios. Since the current majority of datasets focus on pedestrians, as a supplement, the objects of interest in benchmark are vehicles. Moreover, these frames are manually annotated with bounding boxes and some useful attributes, e.g., vehicle category and occlusion. The videos
are recorded at 30 frames per seconds (fps), with the JPEG image resolution of 1080 × 540 pixels.
In the annotation process, the authors engaged over 10 domain experts who diligently labeled dataset utilizing the Vatic tool over a span of two months. Through multiple rounds of meticulous double-checking, annotation errors were minimized to the greatest extent possible. To elaborate, approximately 80,000 frames within the UAVDT benchmark dataset were annotated, encompassing around 2,700 vehicles and totaling approximately 0.84 million bounding boxes. It’s worth noting that regions containing vehicles deemed too small were omitted from annotation in each frame due to their low resolution. Based on different shooting conditions of UAVs, the authors first define 3 attributes for MOT task:
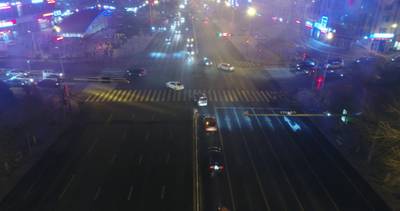
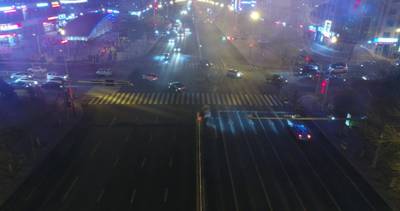
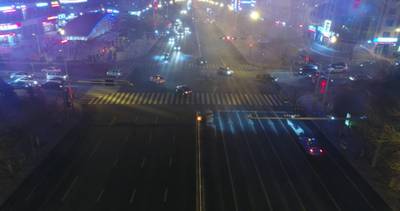
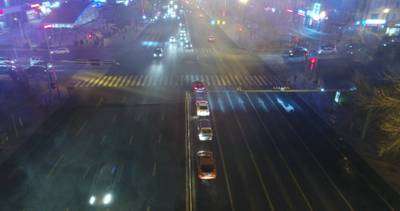
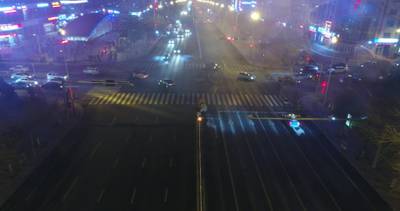
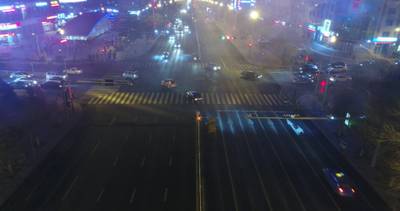
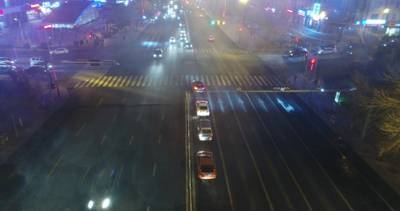
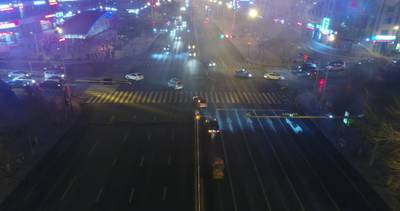
- Weather condition indicates illumination when capturing videos, which affects appearance representation of objects. It includes daylight, night and fog. Specifically, videos shot in daylight introduce interference of shadows. night scene, bearing dim street lamp light, offers scarcely any texture information. In the meantime, frames captured at fog lack sharp details so that contours of objects vanish in the background.
- Flying altitude is the flying height of UAVs, affecting the scale variation of objects. Three levels are annotated, i.e., low alt, medium alt and high alt. When shooting in low altitude (10m ∼ 30m), more details of objects are captured. Mean while the object may occupy larger area, e.g., 22.6% pixels of a frame in an extreme situation. When videos are collected in mediumaltitude (30m ∼ 70m), more view angles are presented. While in much higher altitude (> 70m), plentiful vehicles are of less clarity. For example, most tiny objects just contain 0.005% pixels of a frame, yet object numbers can be more than a hundred.
- Camera view consists of 3 object views. Specifically, front view, side view and bird view mean the camera shooting along with the road, on the side, on the top of objects, respectively. Note that the first two views may coexist in one sequence.
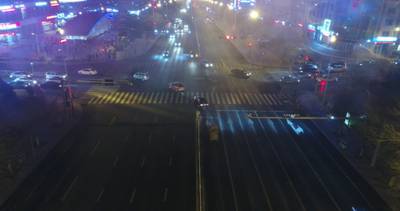
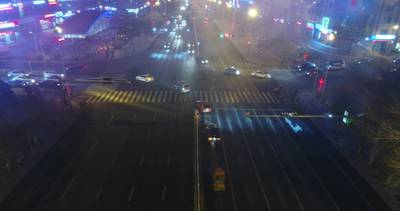
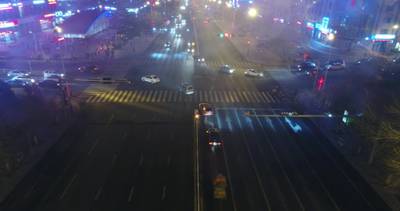
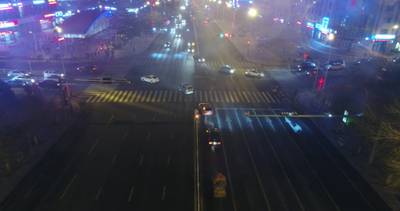
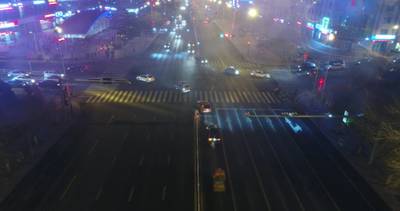
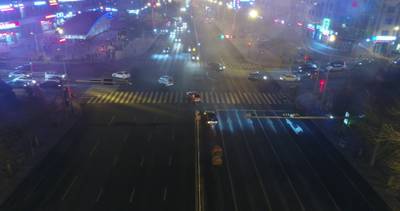
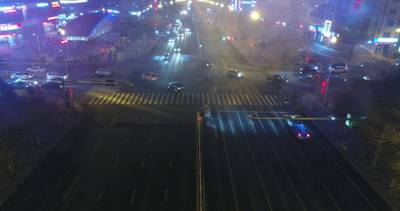
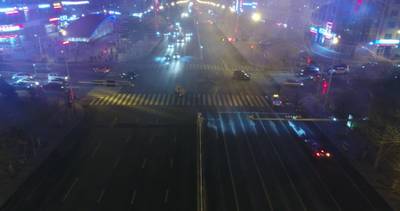
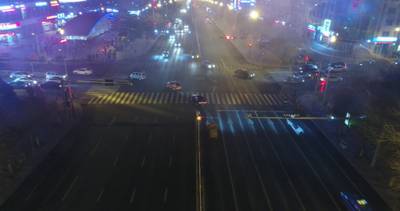
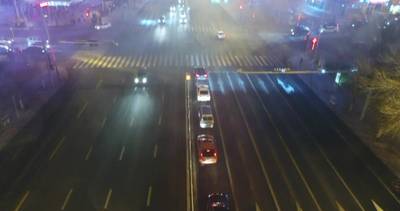
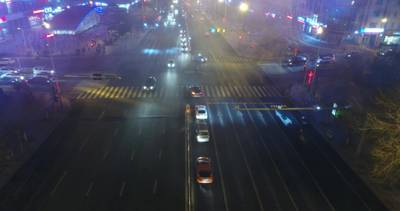
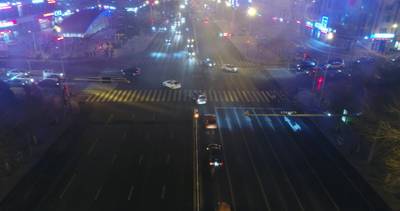
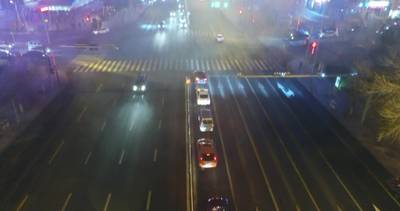
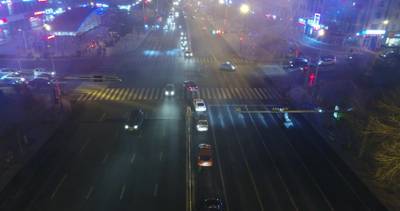
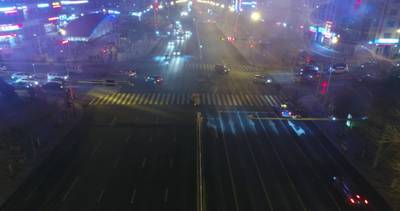
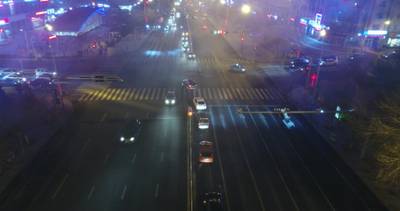
Examples of annotated frames in the UAVDT benchmark. The three rows indicate the DET, MOT and SOT task, respectively. The shooting conditions of UAVs are presented in the lower right corner. The pink areas are ignored regions in the dataset. Different bounding box colors denote different classes of vehicles.
In order to comprehensively evaluate Detection (DET) algorithms, the authors extended their labeling efforts to encompass three additional attributes: vehicle category, vehicle occlusion, and out-of-view status. Vehicle category classification includes three main types: car, truck, and bus. Vehicle occlusion is categorized based on the fraction of bounding box occlusion, ranging from no occlusion (0%), small occlusion (1% to 30%), medium occlusion (30% to 70%), to large occlusion (70% to 100%). Out-of-view status indicates the extent to which vehicle parts lie outside the frame, divided into no out (0%), small out (1% to 30%), and medium out (30% to 50%). Objects exceeding a 50% out-of-view ratio are excluded from consideration. Within an image, objects are classified as “occluded” when obstructed by other objects or environmental obstacles (e.g., under a bridge). Conversely, objects are labeled as “out-of-view” when they extend beyond the image boundaries or into ignored regions.
The distribution of attributes of both DET and MOT tasks in UAVDT.
The authors benchmark is divided into training and testing sets, with 30 and 70 sequences, respectively. The testing set consists of 20 sequences for both DET and MOT tasks, and 50 for SOT task. Besides, training videos are taken at different locations from the testing videos, but share similar scenes and attributes. This setting reduces the overfitting probability to particular scenario.
Note: unfortunately, the authors’ link to download the UAVDT-S dataset (SOT) attributes does not work. Therefore, the images in this dataset do not contain attribute information.
 Homepage
 Research Paper
Summary #
UAVDT Dataset is a dataset for an object detection task. It is used in the drone inspection domain.
The dataset consists of 77819 images with 835879 labeled objects belonging to 4 different classes including car, vehicle, truck, and other: bus.
Images in the UAVDT dataset have bounding box annotations. There are 326 (0% of the total) unlabeled images (i.e. without annotations). There are 2 splits in the dataset: test (53676 images) and train (24143 images). Alternatively, the dataset could be split into 3 camera views: front view (23601 images), side view (17672 images), and bird view (10737 images), or into 3 out of views: no out (725059 objects), medium out (37089 objects), and small out (36647 objects), or into 3 flying altitudes: medium alt (24059 images), low alt (14644 images), and high alt (2032 images), or into 3 occlusions types: no occlusion (715470 objects), small occlusion (64004 objects), and medium occlusion (10025 objects), or into 3 weather conditions: daylight (24055 images), night (11501 images), and fog (5179 images). Additionally, every image marked with its sequence tag, labels marked with target id and long term tags. Explore its in Supervisely labelling tool. The dataset was released in 2018 by the University of Chinese Academy of Sciences, China, Harbin Institute of Technology, China, and The University of Texas at San Antonio, USA.

Explore #
UAVDT dataset has 77819 images. Click on one of the examples below or open "Explore" tool anytime you need to view dataset images with annotations. This tool has extended visualization capabilities like zoom, translation, objects table, custom filters and more. Hover the mouse over the images to hide or show annotations.


Class balance #
There are 4 annotation classes in the dataset. Find the general statistics and balances for every class in the table below. Click any row to preview images that have labels of the selected class. Sort by column to find the most rare or prevalent classes.

Class ㅤ | Images ㅤ | Objects ㅤ | Count on image average | Area on image average |
|---|---|---|---|---|
car➔ rectangle | 40140 | 755688 | 18.83 | 4.63% |
vehicle➔ rectangle | 37084 | 37084 | 1 | 0.43% |
truck➔ rectangle | 14595 | 25086 | 1.72 | 0.86% |
bus➔ rectangle | 10327 | 18021 | 1.75 | 1.34% |
Co-occurrence matrix #
Co-occurrence matrix is an extremely valuable tool that shows you the images for every pair of classes: how many images have objects of both classes at the same time. If you click any cell, you will see those images. We added the tooltip with an explanation for every cell for your convenience, just hover the mouse over a cell to preview the description.
Images #
Explore every single image in the dataset with respect to the number of annotations of each class it has. Click a row to preview selected image. Sort by any column to find anomalies and edge cases. Use horizontal scroll if the table has many columns for a large number of classes in the dataset.
Class sizes #
The table below gives various size properties of objects for every class. Click a row to see the image with annotations of the selected class. Sort columns to find classes with the smallest or largest objects or understand the size differences between classes.
Class | Object count | Avg area | Max area | Min area | Min height | Min height | Max height | Max height | Avg height | Avg height | Min width | Min width | Max width | Max width |
|---|---|---|---|---|---|---|---|---|---|---|---|---|---|---|
car rectangle | 755688 | 0.25% | 30.39% | 0.01% | 6px | 1.11% | 287px | 53.15% | 31px | 5.72% | 7px | 0.68% | 977px | 95.41% |
vehicle rectangle | 37084 | 0.43% | 22.55% | 0.01% | 6px | 1.11% | 308px | 57.04% | 39px | 7.28% | 6px | 0.59% | 489px | 47.75% |
truck rectangle | 25086 | 0.5% | 8.63% | 0.03% | 11px | 2.04% | 305px | 56.48% | 47px | 8.69% | 10px | 0.98% | 225px | 21.97% |
bus rectangle | 18021 | 0.78% | 14.11% | 0.02% | 9px | 1.67% | 271px | 50.19% | 58px | 10.83% | 10px | 0.98% | 296px | 28.91% |
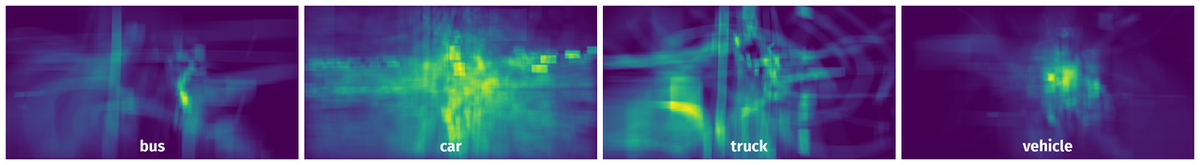
Spatial Heatmap #
The heatmaps below give the spatial distributions of all objects for every class. These visualizations provide insights into the most probable and rare object locations on the image. It helps analyze objects' placements in a dataset.
Objects #
Table contains all 98979 objects. Click a row to preview an image with annotations, and use search or pagination to navigate. Sort columns to find outliers in the dataset.
Object ID ㅤ | Class ㅤ | Image name click row to open | Image size height x width | Height ㅤ | Height ㅤ | Width ㅤ | Width ㅤ | Area ㅤ |
|---|---|---|---|---|---|---|---|---|
1➔ | car rectangle | M0605_img000573.jpg | 540 x 1024 | 19px | 3.52% | 23px | 2.25% | 0.08% |
2➔ | car rectangle | M0605_img000573.jpg | 540 x 1024 | 94px | 17.41% | 62px | 6.05% | 1.05% |
3➔ | car rectangle | M0605_img000573.jpg | 540 x 1024 | 104px | 19.26% | 49px | 4.79% | 0.92% |
4➔ | car rectangle | M0605_img000573.jpg | 540 x 1024 | 63px | 11.67% | 152px | 14.84% | 1.73% |
5➔ | car rectangle | M0605_img000573.jpg | 540 x 1024 | 81px | 15% | 66px | 6.45% | 0.97% |
6➔ | car rectangle | M0605_img000573.jpg | 540 x 1024 | 54px | 10% | 38px | 3.71% | 0.37% |
7➔ | car rectangle | M0605_img000573.jpg | 540 x 1024 | 46px | 8.52% | 38px | 3.71% | 0.32% |
8➔ | car rectangle | M0605_img000573.jpg | 540 x 1024 | 29px | 5.37% | 30px | 2.93% | 0.16% |
9➔ | car rectangle | M0605_img000573.jpg | 540 x 1024 | 30px | 5.56% | 22px | 2.15% | 0.12% |
10➔ | car rectangle | M0605_img000573.jpg | 540 x 1024 | 26px | 4.81% | 24px | 2.34% | 0.11% |
License #
This dataset is for research purposes only.
Citation #
If you make use of the Uavdt data, please cite the following reference:
@dataset{Uavdt,
  author={Dawei Du and Yuankai Qi and Hongyang Yu and Yifan Yang and Kaiwen Duan and Guorong Li and Weigang Zhang and Qingming Huang and Qi Tian},
  title={UAVDT Dataset},
  year={2018},
  url={https://sites.google.com/view/grli-uavdt/%E9%A6%96%E9%A1%B5}
}
If you are happy with Dataset Ninja and use provided visualizations and tools in your work, please cite us:
@misc{ visualization-tools-for-uavdt-dataset,
  title = { Visualization Tools for UAVDT Dataset },
  type = { Computer Vision Tools },
  author = { Dataset Ninja },
  howpublished = { \url{ https://datasetninja.com/uavdt } },
  url = { https://datasetninja.com/uavdt },
  journal = { Dataset Ninja },
  publisher = { Dataset Ninja },
  year = { 2026 },
  month = { jul },
  note = { visited on 2026-07-23 },
}
Download #
Dataset UAVDT can be downloaded in Supervisely format:
As an alternative, it can be downloaded with dataset-tools package:
pip install --upgrade dataset-tools
… using following python code:
import dataset_tools as dtools

dtools.download(dataset='UAVDT', dst_dir='~/dataset-ninja/')
Make sure not to overlook the python code example available on the Supervisely Developer Portal. It will give you a clear idea of how to effortlessly work with the downloaded dataset.
The data in original format can be downloaded here:
Disclaimer #
Our gal from the legal dep told us we need to post this:
Dataset Ninja provides visualizations and statistics for some datasets that can be found online and can be downloaded by general audience. Dataset Ninja is not a dataset hosting platform and can only be used for informational purposes. The platform does not claim any rights for the original content, including images, videos, annotations and descriptions. Joint publishing is prohibited.
You take full responsibility when you use datasets presented at Dataset Ninja, as well as other information, including visualizations and statistics we provide. You are in charge of compliance with any dataset license and all other permissions. You are required to navigate datasets homepage and make sure that you can use it. In case of any questions, get in touch with us at hello@datasetninja.com.