

Introduction #
The Semantic Segmentation Vineyard Rows dataset is the result of work in which the authors presented a new low-cost and accessible edge motion control system for autonomous navigation in vineyard rows. It uses the properties of semantic segmentation provides a proportional controller that controls the robot area along the entire row without touching the vine plants. Precision agriculture is a fast-growing field that aims at introducing affordable and effective automation into agricultural processes. The dataset includes 500 RGB - images with the relative single-channel binary masks.
Dataset creation methodology
The authors research group aims at developing an affordable self-driving system for vineyard parcels. Given a global path made of georeferenced waypoints, they exploit a dual local planner to overcome the lack of accuracy of the GPS based localization filter inside the vine rows. Eventually, all the algorithms have been developed ROScompatible, in order to make easier the communication among them and to be easily deployed on developing platform; the Jackal Unmanned Ground Vehicle (UGV) by Clearpath Robotics3, that is fully supported by the Robot Operating System (ROS).
The Jackal Unmanned Ground Vehicle in Grugliasco, Turin, North of Italy.
The authors propose a control algorithm to perform real-time autonomous navigation along the vineyard rows that leverages the latest advancement on edge AI to obtain a continuous and reliable control with a low-range hardware setup. The devised system exploits the joint information of RGB and depth inputs, cutting costs of expensive sensors and overcoming issues experienced by solutions based on GPS devices.
Dataset description
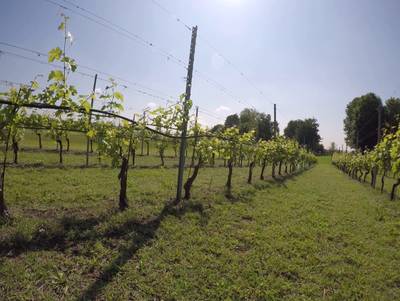
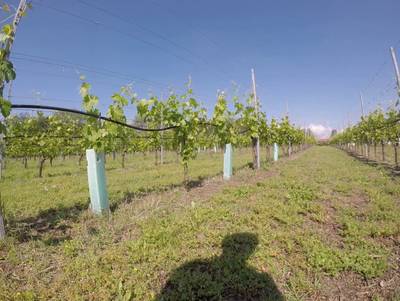
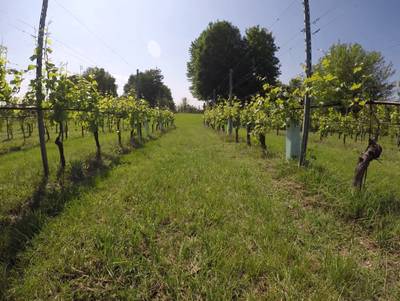
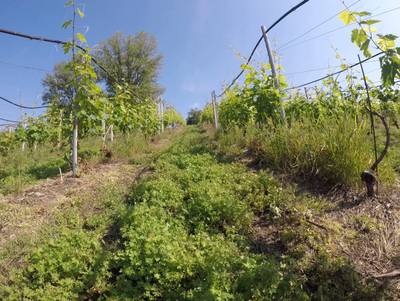
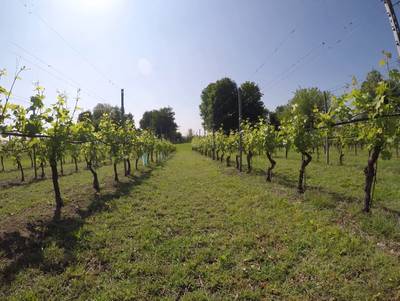
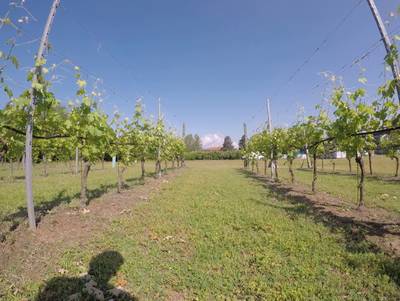
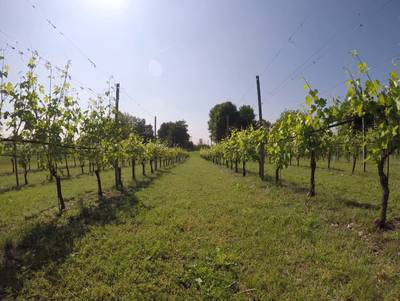
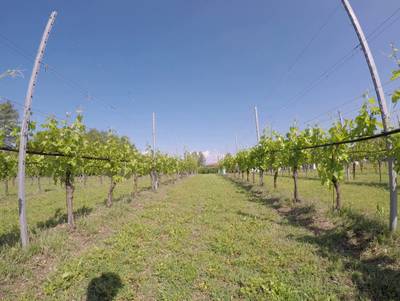
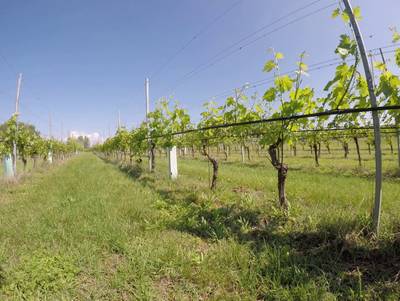
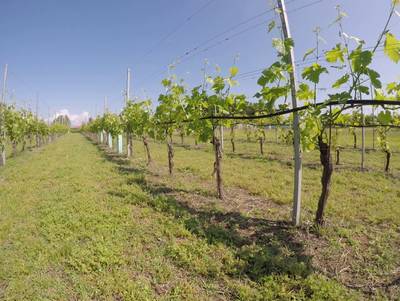
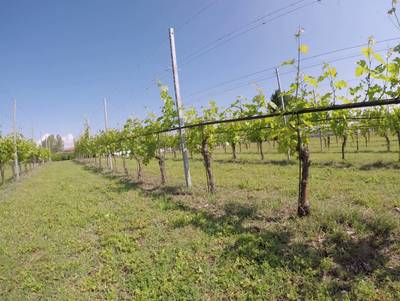
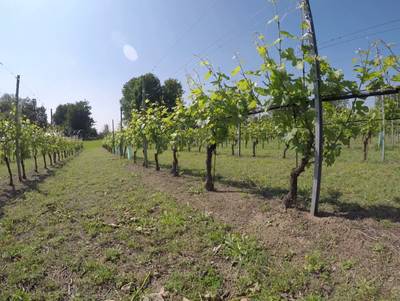
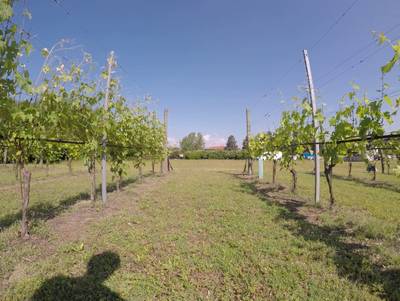
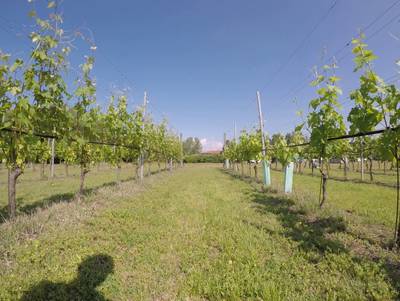
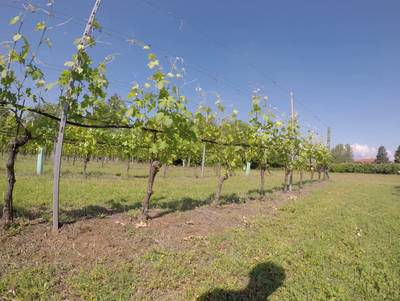
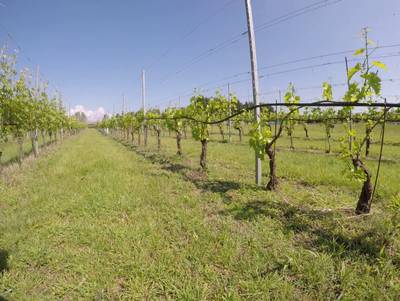
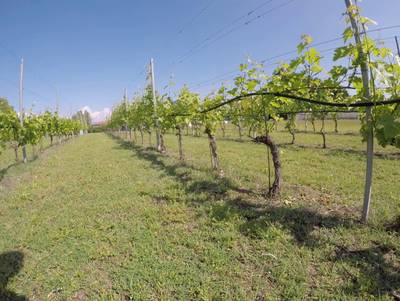
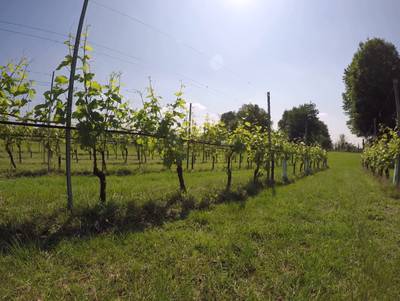
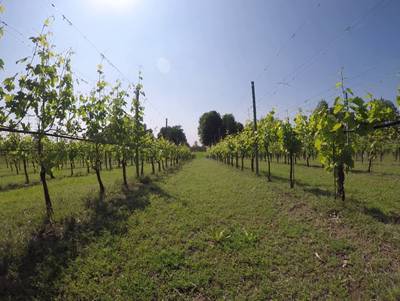
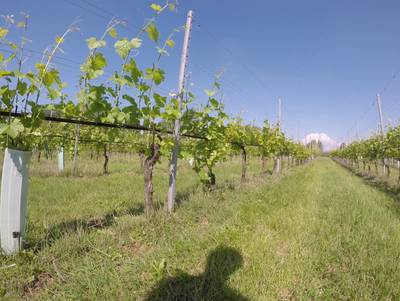
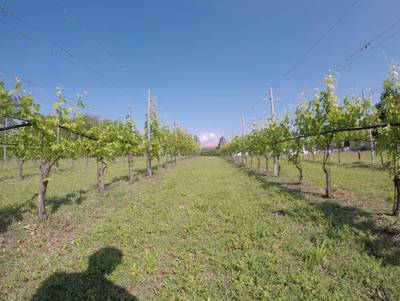
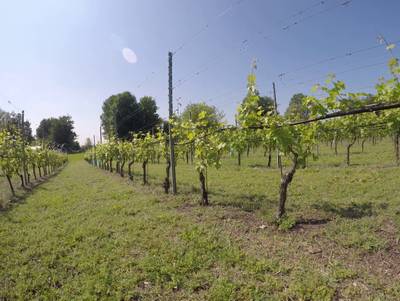
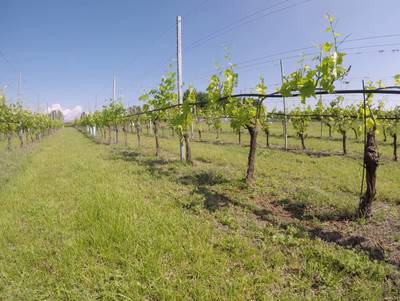
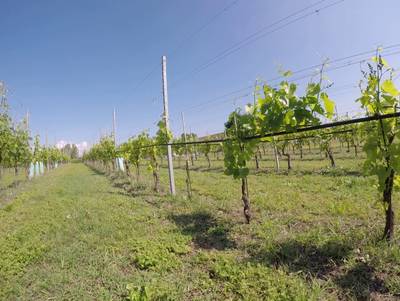
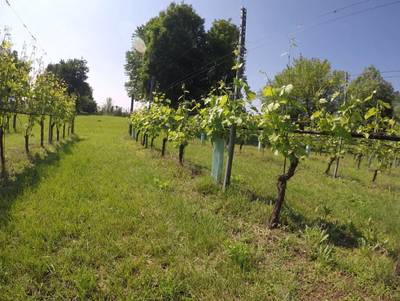
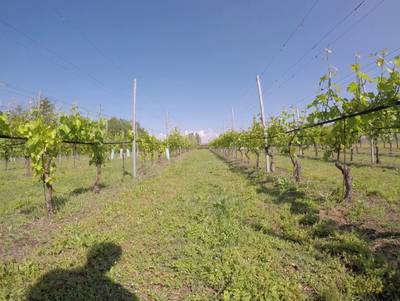
In order to create a dataset for training and testing the deep neural network, the authors carry out field surveys in two distinct agricultural areas in the North of Italy: Grugliasco near Turin in Piedmont region and Valle San Giorgio di Baone in the Province of Padua in the Veneto region. The data is collected at different times of the day, with diverse weather conditions, and they present a variety of terrain types and wine qualities. To have different perspectives inside the vineyard rows, the authors acquire several videos with only three fixed orientations: one pointing the camera at the center of the vineyard row and the other two pointing to the left and right sides, respectively. For training and testing, the authors select one frame every 25 in order to work with quite different scenarios. Finally, to generate the masks for the supervised training, they exploit the collected images by first manually annotating them, and successively refining the obtained binary masks using a Gaussian mixture model in order to train and evaluate the network with more accurate masks.
In a, b and c are shown three instances of the dataset, one for each video orientation. a is an example left samples, b center, and c right. d, e and f are the corresponding binary masks for the supervised training. Dataset samples have been collected with different weather conditions and at different times of the day.
 Homepage
 Research Paper
 GitHub
Summary #
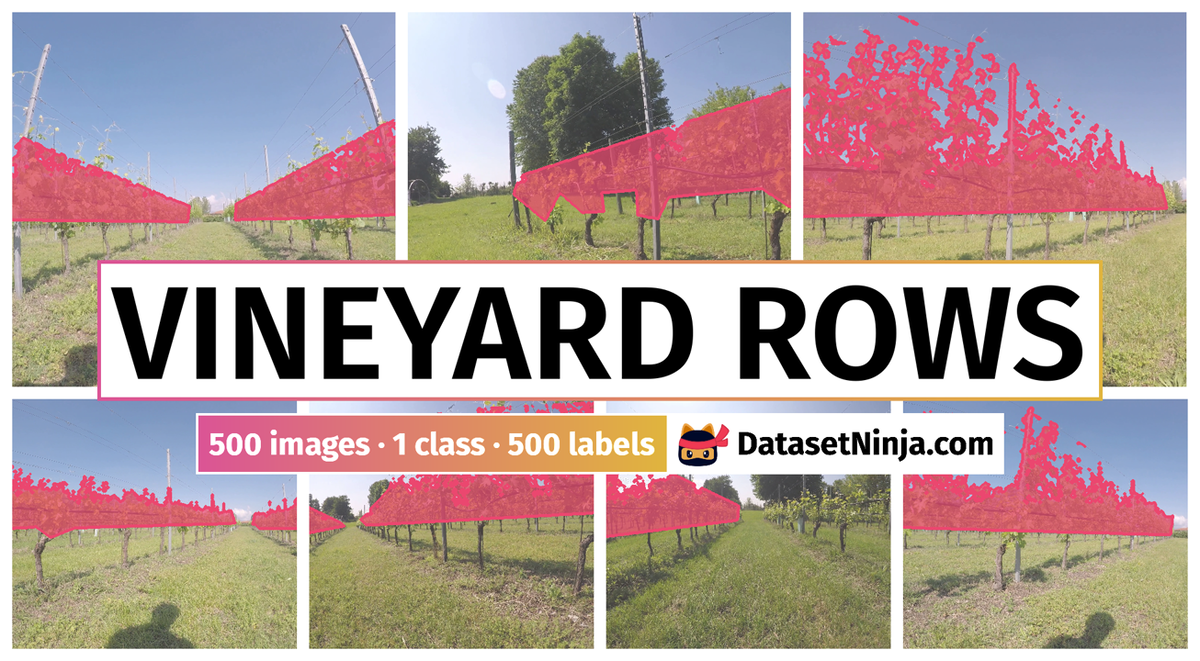
Semantic Segmentation Vineyard Rows is a dataset for a semantic segmentation task. It is used in the agricultural and robotics industries.
The dataset consists of 500 images with 500 labeled objects belonging to 1 single class (vineyard rows).
Images in the Vineyard Rows dataset have pixel-level semantic segmentation annotations. All images are labeled (i.e. with annotations). There are no pre-defined train/val/test splits in the dataset. The dataset was released in 2021 by the Politecnico di Torino, Italy.
Explore #
Vineyard Rows dataset has 500 images. Click on one of the examples below or open "Explore" tool anytime you need to view dataset images with annotations. This tool has extended visualization capabilities like zoom, translation, objects table, custom filters and more. Hover the mouse over the images to hide or show annotations.


Class balance #
There are 1 annotation classes in the dataset. Find the general statistics and balances for every class in the table below. Click any row to preview images that have labels of the selected class. Sort by column to find the most rare or prevalent classes.

Class ㅤ | Images ㅤ | Objects ㅤ | Count on image average | Area on image average |
|---|---|---|---|---|
vineyard rows➔ mask | 500 | 500 | 1 | 15.13% |
Images #
Explore every single image in the dataset with respect to the number of annotations of each class it has. Click a row to preview selected image. Sort by any column to find anomalies and edge cases. Use horizontal scroll if the table has many columns for a large number of classes in the dataset.
Object distribution #
Interactive heatmap chart for every class with object distribution shows how many images are in the dataset with a certain number of objects of a specific class. Users can click cell and see the list of all corresponding images.
Class sizes #
The table below gives various size properties of objects for every class. Click a row to see the image with annotations of the selected class. Sort columns to find classes with the smallest or largest objects or understand the size differences between classes.
Class | Object count | Avg area | Max area | Min area | Min height | Min height | Max height | Max height | Avg height | Avg height | Min width | Min width | Max width | Max width |
|---|---|---|---|---|---|---|---|---|---|---|---|---|---|---|
vineyard rows mask | 500 | 15.13% | 25.52% | 4.81% | 459px | 22.59% | 1639px | 80.66% | 979px | 48.16% | 1206px | 44.6% | 2701px | 99.89% |
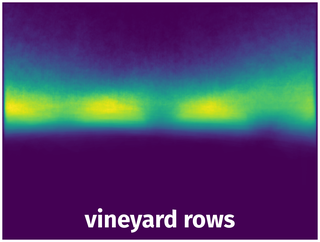
Spatial Heatmap #
The heatmaps below give the spatial distributions of all objects for every class. These visualizations provide insights into the most probable and rare object locations on the image. It helps analyze objects' placements in a dataset.
Objects #
Table contains all 500 objects. Click a row to preview an image with annotations, and use search or pagination to navigate. Sort columns to find outliers in the dataset.
Object ID ㅤ | Class ㅤ | Image name click row to open | Image size height x width | Height ㅤ | Height ㅤ | Width ㅤ | Width ㅤ | Area ㅤ |
|---|---|---|---|---|---|---|---|---|
1➔ | vineyard rows mask | img_268.jpg | 2032 x 2704 | 1054px | 51.87% | 2686px | 99.33% | 15.01% |
2➔ | vineyard rows mask | img_215.jpg | 2032 x 2704 | 1216px | 59.84% | 2689px | 99.45% | 8.99% |
3➔ | vineyard rows mask | img_603.jpg | 2032 x 2704 | 1195px | 58.81% | 2695px | 99.67% | 18.32% |
4➔ | vineyard rows mask | img_583.jpg | 2032 x 2704 | 1018px | 50.1% | 2692px | 99.56% | 9.99% |
5➔ | vineyard rows mask | img_713.jpg | 2032 x 2704 | 933px | 45.92% | 2680px | 99.11% | 15.02% |
6➔ | vineyard rows mask | img_201.jpg | 2032 x 2704 | 819px | 40.31% | 2581px | 95.45% | 12% |
7➔ | vineyard rows mask | img_621.jpg | 2032 x 2704 | 1150px | 56.59% | 2692px | 99.56% | 19.26% |
8➔ | vineyard rows mask | img_108.jpg | 2032 x 2704 | 1018px | 50.1% | 2692px | 99.56% | 16.31% |
9➔ | vineyard rows mask | img_44.jpg | 2032 x 2704 | 843px | 41.49% | 2686px | 99.33% | 11.13% |
10➔ | vineyard rows mask | img_216.jpg | 2032 x 2704 | 1005px | 49.46% | 2680px | 99.11% | 7.02% |
License #
Citation #
If you make use of the Vineyard Rows data, please cite the following reference:
@dataset{aghi_diego_2021_4601472,
  author       = {Aghi Diego and
                  Cerrato Simone and
                  Mazzia Vittorio and
                  Chiaberge Marcello},
  title        = {Semantic Segmentation Vineyard Rows},
  month        = jul,
  year         = 2021,
  publisher    = {Zenodo},
  version      = {1.0},
  doi          = {10.5281/zenodo.4601472},
  url          = {https://doi.org/10.5281/zenodo.4601472}
}
If you are happy with Dataset Ninja and use provided visualizations and tools in your work, please cite us:
@misc{ visualization-tools-for-vineyard-rows-dataset,
  title = { Visualization Tools for Vineyard Rows Dataset },
  type = { Computer Vision Tools },
  author = { Dataset Ninja },
  howpublished = { \url{ https://datasetninja.com/vineyard-rows } },
  url = { https://datasetninja.com/vineyard-rows },
  journal = { Dataset Ninja },
  publisher = { Dataset Ninja },
  year = { 2026 },
  month = { jul },
  note = { visited on 2026-07-20 },
}
Download #
Dataset Vineyard Rows can be downloaded in Supervisely format:
As an alternative, it can be downloaded with dataset-tools package:
pip install --upgrade dataset-tools
… using following python code:
import dataset_tools as dtools

dtools.download(dataset='Vineyard Rows', dst_dir='~/dataset-ninja/')
Make sure not to overlook the python code example available on the Supervisely Developer Portal. It will give you a clear idea of how to effortlessly work with the downloaded dataset.
The data in original format can be downloaded here.
Disclaimer #
Our gal from the legal dep told us we need to post this:
Dataset Ninja provides visualizations and statistics for some datasets that can be found online and can be downloaded by general audience. Dataset Ninja is not a dataset hosting platform and can only be used for informational purposes. The platform does not claim any rights for the original content, including images, videos, annotations and descriptions. Joint publishing is prohibited.
You take full responsibility when you use datasets presented at Dataset Ninja, as well as other information, including visualizations and statistics we provide. You are in charge of compliance with any dataset license and all other permissions. You are required to navigate datasets homepage and make sure that you can use it. In case of any questions, get in touch with us at hello@datasetninja.com.