

Introduction #
Virtual KITTI is a photo-realistic synthetic video dataset designed to learn and evaluate computer vision models for several video understanding tasks: object detection and multi-object tracking, scene-level and instance-level semantic segmentation, optical flow, and depth estimation. Virtual KITTI contains 21,260 images generated from five different virtual worlds in urban settings under different imaging and weather conditions. These photo-realistic synthetic images are automatically, exactly, and fully annotated for 2D and 3D multi-object tracking and at the pixel level with category, instance, flow, and depth labels.
Motivation
While it’s possible to employ inexpensive or even absent annotations during training through weakly-supervised learning, assessing the overall performance and resilience of a visual recognition model necessitates precise labeling of extensive and representative datasets during experimentation. This proves to be particularly challenging in practical scenarios, such as in video understanding tasks like multi-object tracking. The considerable costs associated with data acquisition and labeling impose limitations on both the quantity and diversity of available benchmarks. As an example, the KITTI multi-object tracking benchmark is limited to only 29 test sequences recorded in consistently favorable conditions and from a single source. To our knowledge, none of the current benchmarks in computer vision offer the necessary diversity to thoroughly evaluate the effectiveness of video analysis algorithms. This includes variations in environmental conditions such as day and night, different weather conditions (sun, rain, etc.), comprehensive object class annotations (persons, cars, license plates, etc.), and diverse camera settings, among numerous other factors.
In theory, the utilization of synthetic data allows for complete control over the data generation pipeline, thereby guaranteeing reduced expenses, heightened flexibility, and an unrestricted range and volume of data. In this study, the authors capitalize on recent advancements in computer graphics, particularly leveraging readily available tools like game engines, and common hardware components, particularly Graphics Processing Units (GPUs). These resources are employed to create photorealistic virtual environments, serving as proxies to evaluate the effectiveness of video analysis algorithms. The authors present a novel approach for generating extensive, photorealistic, and diverse datasets of synthetic images with automatic and dense labeling for various images understanding tasks. The key innovation lies in the creation of virtual worlds, not from scratch, but by replicating a select set of real-world sequences. Using this method, the primary contribution is the development of the groundbreaking Virtual KITTI dataset.
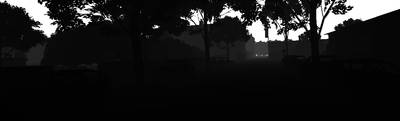
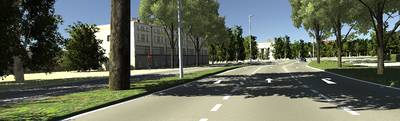
Top: a image from the KITTI multi-object tracking benchmark. Middle: the corresponding rendered image of the synthetic clone from our Virtual KITTI dataset with automatic tracking ground truth bounding boxes. Bottom: automatically generated ground truth for optical flow (left), scene- and instance-level segmentation (middle), and depth (right).
Dataset creation
-
Acquiring real-world (sensor) data. The initial phase of the authors’ approach involved acquiring a limited set of seed data from the real world for calibration purposes. This necessitated the collection of two types of data: videos depicting real-world scenes and precise measurements of crucial objects within those scenes, including the camera itself. By employing a small, fixed set of core real-world video sequences, they initiated their virtual worlds, enabling the generation of diverse synthetic images. Importantly, this seed real-world data not only enhances the quality of the virtual worlds, bringing them closer to real-world conditions, but also facilitates a quantitative assessment of their effectiveness in drawing conclusions that are likely to generalize to real-world settings. In their experiments, the authors employed the KITTI dataset to initialize their virtual worlds. This widely recognized public benchmark was compiled from data captured by a car navigating the streets of the German city of Karlsruhe, predominantly in sunny conditions. The sensory apparatus used for data acquisition encompassed grayscale and color cameras, a 3D laser scanner, and an inertial and GPS navigation system. Human annotators, utilizing point clouds obtained from the 3D laser scanner, meticulously labeled 3D and 2D bounding boxes for various objects, including cars and pedestrians. Notably, in their experiments, the authors focused solely on cars as objects of interest, both for the sake of simplicity and because they constitute the primary category within the KITTI dataset. The annotation data encompassed precise details such as the positions and sizes of cars, along with their rotation angles about the vertical axis (yaw rotation). The camera’s movement was recorded through GPS data indicating latitude, longitude, and altitude, while its orientation (roll, pitch, yaw) was tracked using a GPS/IMU sensor with a fixed spatial relationship to the cameras.
-
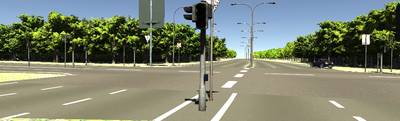
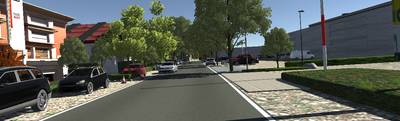
Generating synthetic clones. The subsequent phase of the authors’ methodology involved semi-automatically generating photo-realistic dynamic 3D virtual environments. In these virtual worlds, the paths of virtual cameras were aligned with those observed in the real-world seed sequences, producing outputs closely mirroring the characteristics of the actual data. For the construction of the Virtual KITTI dataset, the authors specifically chose five training videos extracted from the original KITTI MOT benchmark, designating them as “real-world seeds” to initiate the creation of their virtual worlds.
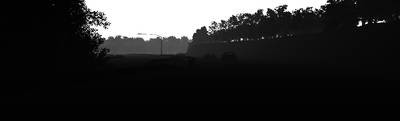
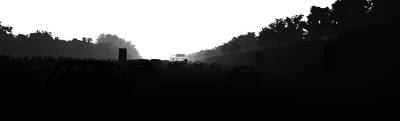
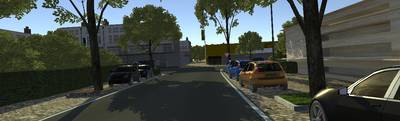
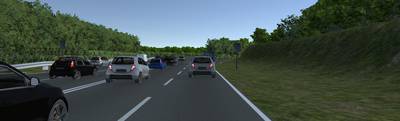
Frames from 5 real KITTI videos (left, sequences 1, 2, 6, 18, 20 from top to bottom) and rendered virtual clones (right).
The authors decomposed a scene into different visual components, with which off-the-shelf computer graphics engines and graphic assets (e.g., geometric and
material models) can be scripted to reconstruct the scene. They used the commercial computer graphics engine Unity2 to create virtual worlds that closely resemble the original ones in KITTI. The positions and orientations of the objects of interest in the 3D virtual world are calculated based on their positions and orientations relative to the camera and the position and orientation of the camera itself, both available from acquired real-world data in the case of KITTI. The main roads are also placed according to the camera position, with minor manual adjustment in special cases (e.g., the road changing width). To build the Virtual KITTI dataset, the authors manually placed secondary roads and other background objects such as trees and buildings in the virtual world, both for simplicity and because of the lack of position data for them.
A directional light source together with ambient light simulates the sun. Its direction and intensity are set manually by comparing the brightness and the shadows in the virtual and real-world scenes, a simple process that only takes a few minutes per world in our experiments.
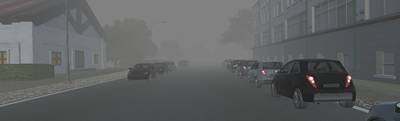
- Changing conditions in synthetic data. Once the 3D virtual environment is established, authors gain the ability to effortlessly produce not only replicated synthetic videos but also videos featuring altered components. This facilitates a quantitative examination of the influence of individual factors, encompassing rare occurrences or challenging-to-observe conditions that may manifest in real-world scenarios. The adjustable parameters for generating novel synthetic videos encompass the quantity, paths, or velocities of vehicles, their dimensions, hues, or models, as well as the camera’s position, orientation, and trajectory. Additionally, variations in lighting and weather conditions can be implemented.
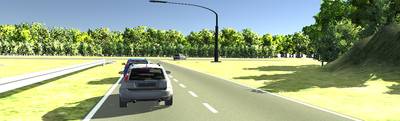
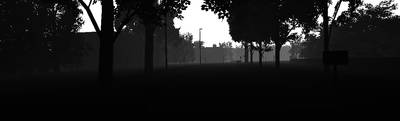
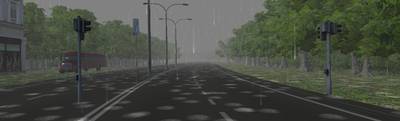
Simulated conditions. From top left to bottom right: clone, camera rotated to the right by 15◦, to the left by 15◦, “morning” and “sunset” times of day, overcast weather, fog, and rain.
- Generating ground-truth annotations. In the KITTI dataset, the 2D bounding boxes used for evaluation were obtained from human annotators by drawing rectangular boxes on the video frames and manually labeling the truncation and occlusion states of objects. This common practice is however costly, does not scale to large volumes of videos and pixellevel ground-truth, and incorporates varying degrees of subjectiveness and inconsistency. For example, the bounding
boxes are usually slightly larger than the cars and the margins differ from one car to another and from one annotator to another. The occluded state (“fully visible”, “partly occluded”, or “largely occluded”) is also subjective and the underlying criterion may differ from case to case. The authors approach can automatically generate accurate and consistent ground-truth annotations accompanying synthetic video outputs, and the algorithm-based approach allows richer (e.g., pixel-level) and more consistent results than those from human annotators. They render each moment of the scene four times. First, they do the photo-realistic rendering of the clone scene by leveraging the modern rendering engine of Unity. Second, the depth map is rendered by using the information stored in the depth buffer. Third, the per-pixel category and instance-level ground-truth is efficiently and directly generated by using unlit shaders on the materials of the objects. These modified shaders output a color which is not affected by the lighting and shading conditions.
Rendered frame (left) and automatically generated scene and instance-level segmentation ground-truth (right) for two modified conditions: camera horizontally rotated to the left (top), rain (bottom).
Fourthly, the authors undertake the computation of dense optical flow between the preceding and current frames. This process involves conveying all Model, View, and Projection matrices for each object to a vertex shader, followed by the interpolation of pixel flow using a fragment shader. It is noteworthy that employing multiple renderings constitutes an effective strategy for generating pixel-level ground truth. This approach optimally utilizes shaders to offload parallel computations to GPUs, with the bulk of computation time dedicated to material swapping. For Virtual KITTI, boasting a resolution of approximately 1242 × 375, the entire rendering and ground truth generation pipeline for segmentation, depth, and optical flow achieves a frame rate of 5-8 FPS on a single desktop equipped with standard hardware.
 Homepage
 Research Paper
Summary #
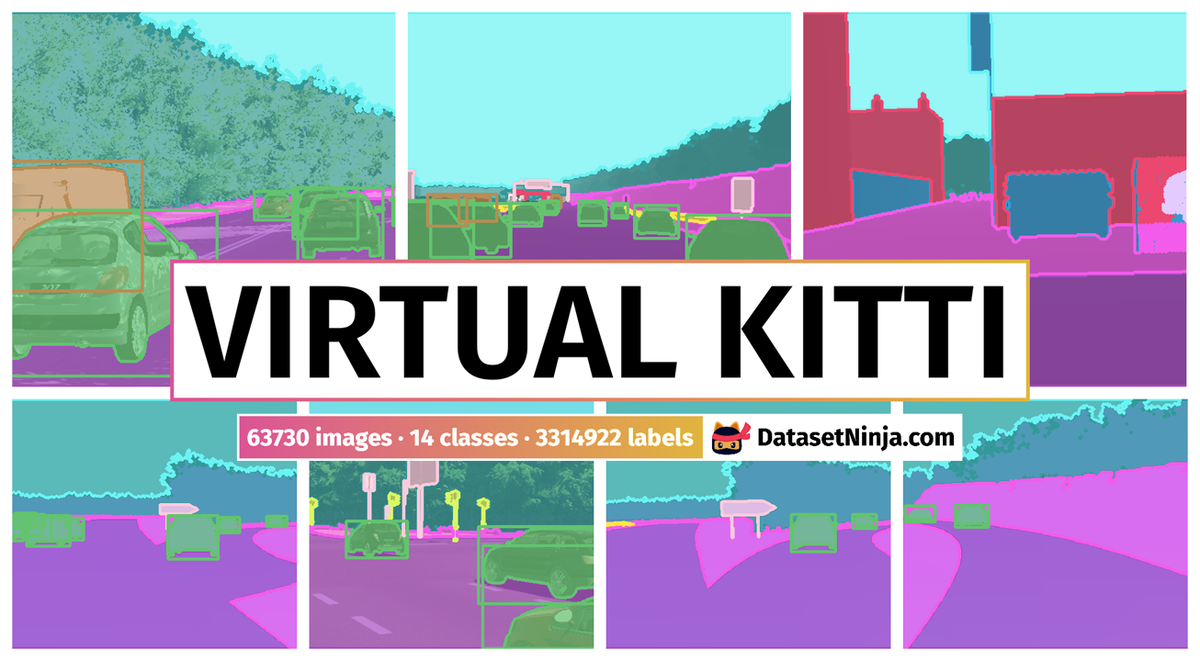
Virtual KITTI Dataset is a dataset for instance segmentation, semantic segmentation, and object detection tasks. It is used in the automotive industry.
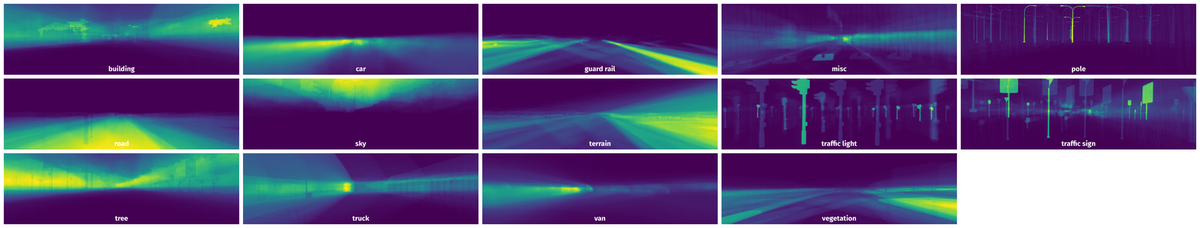
The dataset consists of 63730 images with 3314922 labeled objects belonging to 14 different classes including road, sky, terrain, and other: tree, car, traffic sign, building, pole, van, guard rail, vegetation, traffic light, misc, and truck.
Images in the Virtual KITTI dataset have pixel-level instance segmentation annotations. All images are labeled (i.e. with annotations). There are no pre-defined train/val/test splits in the dataset. Additionally, images are grouped by im id. Also every image contains information about its sequence, rotation. Images labels have color, model, occluded and occupancy ratio. Explore it in supervisely labeling tool. The dataset was released in 2016 by the FR-US joint research group.
Explore #
Virtual KITTI dataset has 63730 images. Click on one of the examples below or open "Explore" tool anytime you need to view dataset images with annotations. This tool has extended visualization capabilities like zoom, translation, objects table, custom filters and more. Hover the mouse over the images to hide or show annotations.


Class balance #
There are 14 annotation classes in the dataset. Find the general statistics and balances for every class in the table below. Click any row to preview images that have labels of the selected class. Sort by column to find the most rare or prevalent classes.

Class ㅤ | Images ㅤ | Objects ㅤ | Count on image average | Area on image average |
|---|---|---|---|---|
tree➔ any | 63730 | 300957 | 4.72 | 26.95% |
terrain➔ any | 63730 | 546534 | 8.58 | 16.03% |
sky➔ any | 63730 | 411125 | 6.45 | 15.06% |
road➔ any | 63730 | 162713 | 2.55 | 24.15% |
car➔ any | 59829 | 952277 | 15.92 | 9.65% |
traffic sign➔ any | 51649 | 157042 | 3.04 | 1.2% |
building➔ any | 35514 | 198712 | 5.6 | 6.89% |
pole➔ any | 32092 | 84851 | 2.64 | 0.47% |
van➔ any | 28752 | 89907 | 3.13 | 2.67% |
guard rail➔ any | 24308 | 68420 | 2.81 | 3.17% |
Co-occurrence matrix #
Co-occurrence matrix is an extremely valuable tool that shows you the images for every pair of classes: how many images have objects of both classes at the same time. If you click any cell, you will see those images. We added the tooltip with an explanation for every cell for your convenience, just hover the mouse over a cell to preview the description.
Images #
Explore every single image in the dataset with respect to the number of annotations of each class it has. Click a row to preview selected image. Sort by any column to find anomalies and edge cases. Use horizontal scroll if the table has many columns for a large number of classes in the dataset.
Object distribution #
Interactive heatmap chart for every class with object distribution shows how many images are in the dataset with a certain number of objects of a specific class. Users can click cell and see the list of all corresponding images.
Class sizes #
The table below gives various size properties of objects for every class. Click a row to see the image with annotations of the selected class. Sort columns to find classes with the smallest or largest objects or understand the size differences between classes.
Class | Object count | Avg area | Max area | Min area | Min height | Min height | Max height | Max height | Avg height | Avg height | Min width | Min width | Max width | Max width |
|---|---|---|---|---|---|---|---|---|---|---|---|---|---|---|
car any | 952277 | 1.13% | 33.59% | 0.01% | 2px | 0.53% | 258px | 68.8% | 45px | 11.99% | 2px | 0.16% | 765px | 61.59% |
terrain any | 546534 | 1.87% | 62.66% | 0.01% | 1px | 0.27% | 375px | 100% | 43px | 11.36% | 2px | 0.16% | 1242px | 100% |
sky any | 411125 | 2.33% | 35.07% | 0.01% | 1px | 0.27% | 226px | 60.27% | 53px | 14.03% | 1px | 0.08% | 1242px | 100% |
tree any | 300957 | 5.71% | 66.08% | 0.01% | 1px | 0.27% | 375px | 100% | 108px | 28.82% | 1px | 0.08% | 1242px | 100% |
building any | 198712 | 1.23% | 49.43% | 0.01% | 1px | 0.27% | 375px | 100% | 55px | 14.55% | 1px | 0.08% | 1242px | 100% |
road any | 162713 | 9.46% | 45.98% | 0.01% | 1px | 0.27% | 224px | 59.73% | 87px | 23.14% | 3px | 0.24% | 1242px | 100% |
traffic sign any | 157042 | 0.4% | 17.12% | 0.01% | 4px | 1.07% | 375px | 100% | 86px | 22.81% | 2px | 0.16% | 656px | 52.82% |
vegetation any | 133072 | 1.1% | 23.17% | 0.01% | 2px | 0.53% | 305px | 81.33% | 41px | 10.9% | 2px | 0.16% | 1079px | 86.88% |
misc any | 90580 | 0.47% | 45.65% | 0.01% | 1px | 0.27% | 375px | 100% | 52px | 13.79% | 3px | 0.24% | 797px | 64.17% |
van any | 89907 | 1.34% | 57.25% | 0.01% | 4px | 1.07% | 375px | 100% | 52px | 13.78% | 2px | 0.16% | 717px | 57.73% |
Spatial Heatmap #
The heatmaps below give the spatial distributions of all objects for every class. These visualizations provide insights into the most probable and rare object locations on the image. It helps analyze objects' placements in a dataset.
Objects #
Table contains all 102133 objects. Click a row to preview an image with annotations, and use search or pagination to navigate. Sort columns to find outliers in the dataset.
Object ID ㅤ | Class ㅤ | Image name click row to open | Image size height x width | Height ㅤ | Height ㅤ | Width ㅤ | Width ㅤ | Area ㅤ |
|---|---|---|---|---|---|---|---|---|
1➔ | tree any | flowgt_0020_rain_00103.png | 375 x 1242 | 184px | 49.07% | 660px | 53.14% | 10.03% |
2➔ | tree any | flowgt_0020_rain_00103.png | 375 x 1242 | 125px | 33.33% | 532px | 42.83% | 7.46% |
3➔ | tree any | flowgt_0020_rain_00103.png | 375 x 1242 | 12px | 3.2% | 56px | 4.51% | 0.08% |
4➔ | tree any | flowgt_0020_rain_00103.png | 375 x 1242 | 7px | 1.87% | 12px | 0.97% | 0.01% |
5➔ | tree any | flowgt_0020_rain_00103.png | 375 x 1242 | 6px | 1.6% | 16px | 1.29% | 0.02% |
6➔ | sky any | flowgt_0020_rain_00103.png | 375 x 1242 | 176px | 46.93% | 1064px | 85.67% | 24.61% |
7➔ | sky any | flowgt_0020_rain_00103.png | 375 x 1242 | 42px | 11.2% | 55px | 4.43% | 0.2% |
8➔ | sky any | flowgt_0020_rain_00103.png | 375 x 1242 | 23px | 6.13% | 26px | 2.09% | 0.06% |
9➔ | sky any | flowgt_0020_rain_00103.png | 375 x 1242 | 7px | 1.87% | 25px | 2.01% | 0.02% |
10➔ | sky any | flowgt_0020_rain_00103.png | 375 x 1242 | 12px | 3.2% | 16px | 1.29% | 0.01% |
License #
Virtual KITTI Dataset is under CC BY-NC-SA 3.0 US license.
Citation #
If you make use of the Virtual KITTI data, please cite the following reference:
@inproceedings{Gaidon:Virtual:CVPR2016,
  author = {Gaidon, A and Wang, Q and Cabon, Y and Vig, E},
  title = {Virtual Worlds as Proxy for Multi-Object Tracking Analysis},
  booktitle = {CVPR},
  year = {2016}
}
If you are happy with Dataset Ninja and use provided visualizations and tools in your work, please cite us:
@misc{ visualization-tools-for-virtual-kitti-dataset,
  title = { Visualization Tools for Virtual KITTI Dataset },
  type = { Computer Vision Tools },
  author = { Dataset Ninja },
  howpublished = { \url{ https://datasetninja.com/virtual-kitti } },
  url = { https://datasetninja.com/virtual-kitti },
  journal = { Dataset Ninja },
  publisher = { Dataset Ninja },
  year = { 2026 },
  month = { jul },
  note = { visited on 2026-07-22 },
}
Download #
Dataset Virtual KITTI can be downloaded in Supervisely format:
As an alternative, it can be downloaded with dataset-tools package:
pip install --upgrade dataset-tools
… using following python code:
import dataset_tools as dtools

dtools.download(dataset='Virtual KITTI', dst_dir='~/dataset-ninja/')
Make sure not to overlook the python code example available on the Supervisely Developer Portal. It will give you a clear idea of how to effortlessly work with the downloaded dataset.
The data in original format can be downloaded here:
Disclaimer #
Our gal from the legal dep told us we need to post this:
Dataset Ninja provides visualizations and statistics for some datasets that can be found online and can be downloaded by general audience. Dataset Ninja is not a dataset hosting platform and can only be used for informational purposes. The platform does not claim any rights for the original content, including images, videos, annotations and descriptions. Joint publishing is prohibited.
You take full responsibility when you use datasets presented at Dataset Ninja, as well as other information, including visualizations and statistics we provide. You are in charge of compliance with any dataset license and all other permissions. You are required to navigate datasets homepage and make sure that you can use it. In case of any questions, get in touch with us at hello@datasetninja.com.