

Introduction #
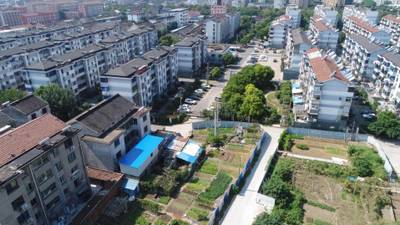
The authors have made available the VisDrone2019-DET Dataset, a comprehensive collection of drone-captured images tailored for object detection tasks. Spanning various urban and suburban locales across 14 different cities in China, from north to south, the VisDrone dataset stands as the most extensive of its kind ever published. This dataset facilitates thorough evaluation and exploration of visual analysis algorithms specifically designed for drone platforms.
Motivation
In recent years, drones (or UAVs) equipped with cameras have garnered significant attention. It is projected that the global commercial drone market size will reach $501.4 billion by 2028, with a compound annual growth rate of 57.5% from 2021 to 2028. Utilizing embedded devices, drones have the capability to analyze captured data and give rise to a multitude of new application scenarios:
- Agriculture. Drones can provide valuable insights to help farmers or ranchers optimize agriculture operations, monitor crop growth and keep herds safe, etc.
- Aerial photography. Drones are used to extract aerial photography images instead of expensive cranes and helicopters.
- Shipping and delivery. Drones can efficiently send packages such as medical supplies, food, or other goods to the designated places.
- Security and surveillance. Drones can provide realtime visibility into security threats and emergency situations by monitoring large regions.
- Search and rescue. Drones are useful to help search missing persons, fugitives, or rescue survivors and drop supplies in difficult terrains and harsh conditions.
As a result, there is a growing demand for the automatic interpretation of visual data gathered from drones, drawing computer vision technology closer to these aerial platforms. Object detection and object tracking, being two fundamental challenges in computer vision, are currently undergoing extensive research and development. However, despite significant advancements in various application domains such as internet and security surveillance, existing methods are often suboptimal when applied to sequences or images captured by drones. Notably, drone-captured video sequences present several unique challenges not typically encountered in traditional computer vision datasets:
- Viewpoint variations: comparing to surveillance cameras with fixed viewpoints, drone-equipped cameras monitor the objects in arbitrary viewpoints.
- Scale variations: drone-equipped cameras monitor the objects at different altitudes, resulting in large variations of scales of objects.
- Motion blur: videos are generally recorded by the droneequipped cameras in the moving process, bringing in considerable motion blurs of the recorded videos.
Hence, there is a critical need to advance the development and assessment of vision algorithms tailored for visual data captured by drones. However, progress toward this objective is significantly hindered by the absence of publicly available large-scale benchmarks or datasets. While some recent endeavors have been dedicated to constructing datasets captured by drones, with a particular focus on object detection or tracking, these datasets remain constrained in size and scope due to the challenges associated with data collection and annotation. Consequently, thorough evaluations of existing or newly developed algorithms remain an ongoing challenge. There is a pressing need for a more inclusive and comprehensive benchmark to further advance research in this field.
Dataset description
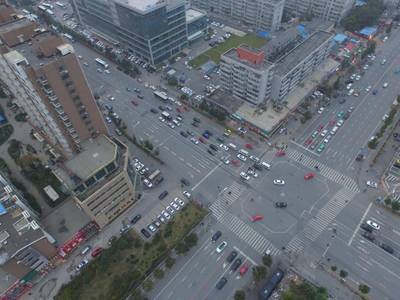
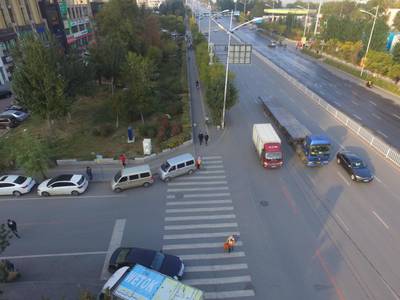
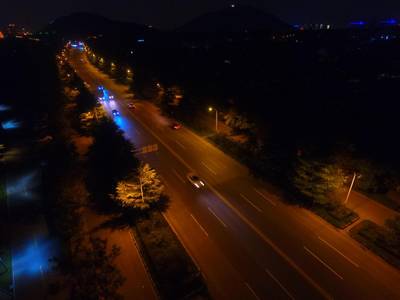
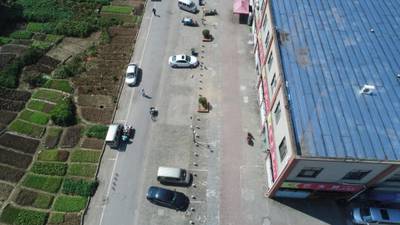
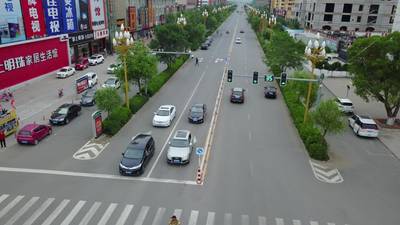
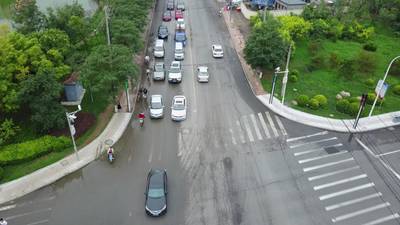
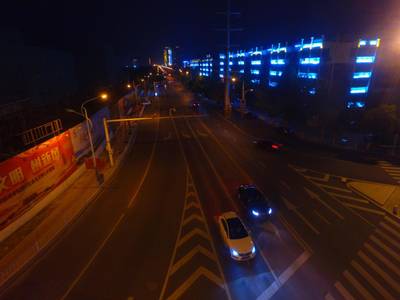
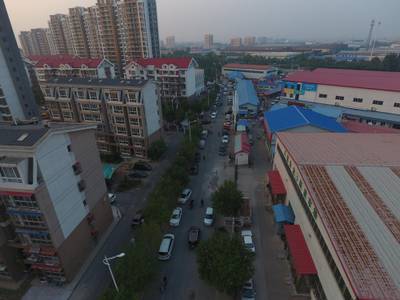
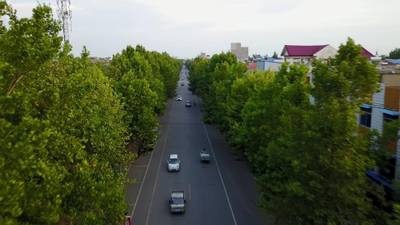
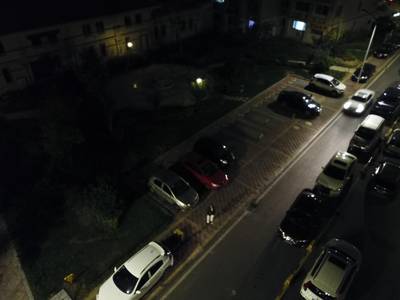
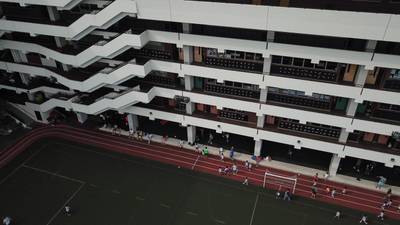
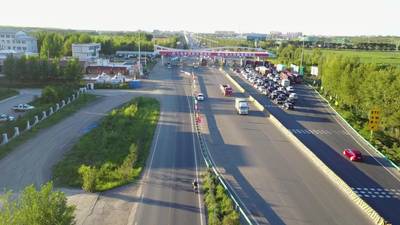
A foundational element crucial for the effective evaluation of algorithms is the availability of a comprehensive dataset. In this regard, the authors of VisDrone have meticulously curated the most extensive dataset to date, aiming to propel research in object detection and tracking on drones forward. This dataset comprises 263 video clips encompassing 179,264 frames, along with an additional 10,209 static images. These videos and images were captured using various drone platforms, including the DJI Mavic and Phantom series (3, 3A, 3SE, 3P, 4, 4A, 4P), across a diverse range of scenarios spanning 14 different cities in China. These cities include Tianjin, Hongkong, Daqing, Ganzhou, Guangzhou, Jincang, Liuzhou, Nanjing, Shaoxing, Shenyang, Nanyang, Zhangjiakou, Suzhou, and Xuzhou. The dataset encompasses a wide array of weather and lighting conditions, thus representing a myriad of scenarios encountered in daily life. The video clips boast a maximal resolution of 3840 × 2160, while the static images reach a resolution of 2000 × 1500, ensuring high-quality data for research purposes. The VisDrone benchmark focuses on the following four tasks: Object Detection in Images (DET), Object Detection in Videos (VID), Single-Object Tracking (SOT) and Multi-Object Tracking (MOT).
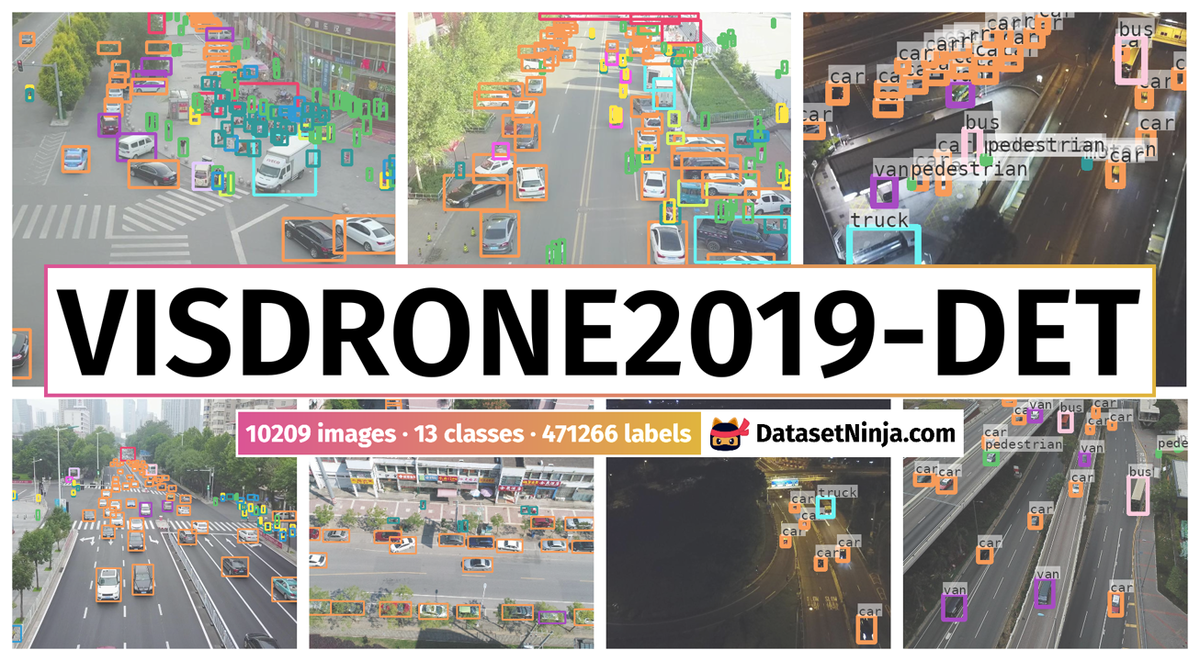
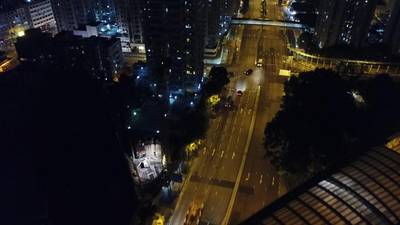
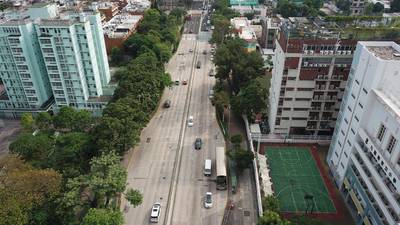
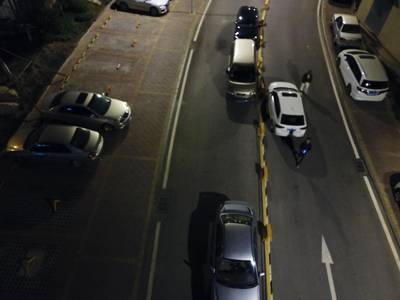
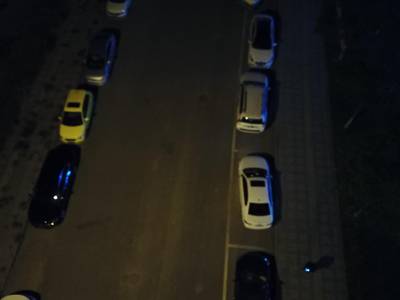
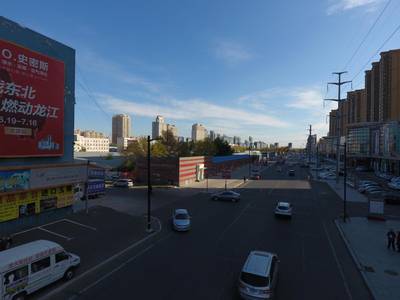
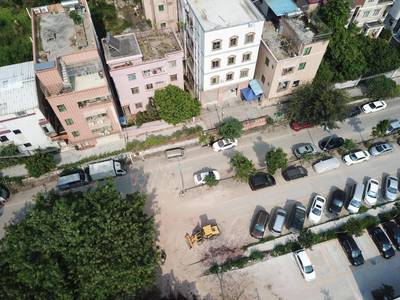
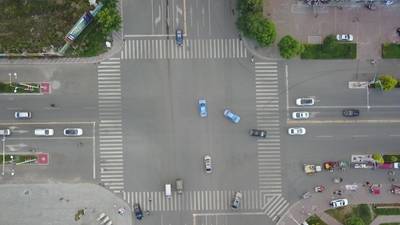
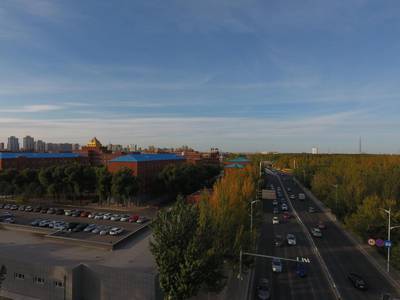
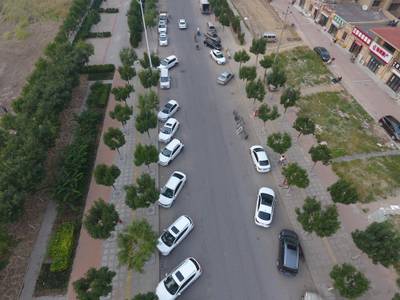
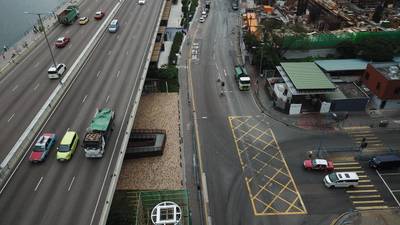
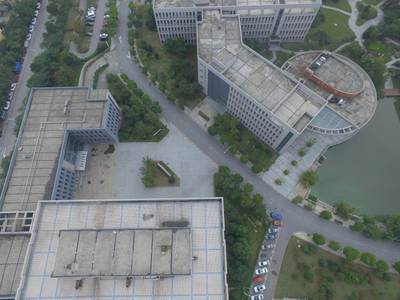
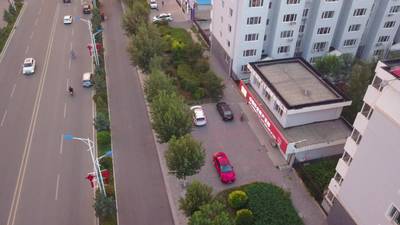
Annotated example images in the proposed datasets. The dashed bounding box indicates the object is occluded. Different colors indicate different classes of objects. For better visualization, only a few attributes are displayed.
The VisDrone-DET dataset tackles the problem of localizing multiple object categories in the image. For each image, algorithms are required to predict the bounding boxes of all the object instances of predefined object categories, with a real valued confidence. The dataset consists of 10, 209 images in unconstrained challenging scenes, including 6, 471 images in the training subset, 548 in the validation subset, 1, 580 in the test-challenge subset, and 1, 610 in the test-dev subset. Notably, the class imbalance issue significantly affect the detection performance. For example, the number of the awning-tricycle instances is more than 40× less than the car instances.
The authors mainly focus on people and vehicles in daily life and define ten object categories, including pedestrian, person(if a human maintains standing pose or walking, they classify it as pedestrian; otherwise, it is classified as a person), car, van, bus, truck, motor, bicycle, awning tricycle, and tricycle. Some rarely occurring vehicles are ignored, e.g., machineshop truck, forklift truck, and tanker. The authors also provide two attributes of each annotated bounding box to analyze the algorithms thoroughly, i.e., the occlusion* and truncation ratios. Specifically, occlusion ratio α denotes the fraction of objects being occluded by other objects or background, including no occlusion (δ = 0%), partial occlusion (δ ∈ (0%, 50%]), and heavy occlusion (δ ∈ (50%, 100%]). The truncation ratio denotes the degree of object parts appearing outside a frame when the object is captured near the frame boundary. It is estimated based on the region outside the frame by the human.
The number of objects with different occlusion degrees of different object categories in the subsets of the dataset.
 Homepage
 Research Paper
Summary #
VisDrone2019-DET Dataset is a dataset for an object detection task. It is used in the surveillance domain.
The dataset consists of 10209 images with 471266 labeled objects belonging to 13 different classes including car, pedestrian, van, and other: motor, person, truck, ignored region, bicycle, bus, tricycle, awning tricycle, other, and people.
Images in the VisDrone2019-DET dataset have bounding box annotations. There are 1580 (15% of the total) unlabeled images (i.e. without annotations). There are 4 splits in the dataset: train (6471 images), test dev (1610 images), test challenge (1580 images), and val (548 images). Alternatively, the dataset could be split into 3 occlusions: no occlusion (239630 instances), partial occlusion (187728 instances), and heavy occlusion (43908 instances), or into 2 truncations: no truncation (453044 instances) and partial truncation (18222 instances). The dataset was released in 2019 by the Tianjin University, China, Finance America Corporation, USA, University at Albany, USA, GE Global Research, USA, University of North Texas, USA, and Stony Brook University, USA.
Explore #
VisDrone2019-DET dataset has 10209 images. Click on one of the examples below or open "Explore" tool anytime you need to view dataset images with annotations. This tool has extended visualization capabilities like zoom, translation, objects table, custom filters and more. Hover the mouse over the images to hide or show annotations.


Class balance #
There are 13 annotation classes in the dataset. Find the general statistics and balances for every class in the table below. Click any row to preview images that have labels of the selected class. Sort by column to find the most rare or prevalent classes.

Class ㅤ | Images ㅤ | Objects ㅤ | Count on image average | Area on image average |
|---|---|---|---|---|
car➔ rectangle | 8178 | 187005 | 22.87 | 4.46% |
pedestrian➔ rectangle | 7083 | 109187 | 15.42 | 0.7% |
van➔ rectangle | 6537 | 32702 | 5 | 1.13% |
motor➔ rectangle | 5516 | 40378 | 7.32 | 0.45% |
truck➔ rectangle | 4567 | 16284 | 3.57 | 1.53% |
person➔ rectangle | 4429 | 32184 | 7.27 | 0.29% |
ignored region➔ rectangle | 3521 | 12371 | 3.51 | 0.95% |
bicycle➔ rectangle | 3496 | 13069 | 3.74 | 0.25% |
bus➔ rectangle | 2992 | 9117 | 3.05 | 1.52% |
tricycle➔ rectangle | 2270 | 6387 | 2.81 | 0.47% |
Co-occurrence matrix #
Co-occurrence matrix is an extremely valuable tool that shows you the images for every pair of classes: how many images have objects of both classes at the same time. If you click any cell, you will see those images. We added the tooltip with an explanation for every cell for your convenience, just hover the mouse over a cell to preview the description.
Images #
Explore every single image in the dataset with respect to the number of annotations of each class it has. Click a row to preview selected image. Sort by any column to find anomalies and edge cases. Use horizontal scroll if the table has many columns for a large number of classes in the dataset.
Class sizes #
The table below gives various size properties of objects for every class. Click a row to see the image with annotations of the selected class. Sort columns to find classes with the smallest or largest objects or understand the size differences between classes.
Class | Object count | Avg area | Max area | Min area | Min height | Min height | Max height | Max height | Avg height | Avg height | Min width | Min width | Max width | Max width |
|---|---|---|---|---|---|---|---|---|---|---|---|---|---|---|
car rectangle | 187005 | 0.21% | 34.22% | 0% | 1px | 0.1% | 791px | 80.52% | 41px | 4.2% | 3px | 0.2% | 718px | 42.5% |
pedestrian rectangle | 109187 | 0.05% | 5.62% | 0% | 3px | 0.29% | 385px | 50.33% | 31px | 3.33% | 3px | 0.15% | 274px | 16.36% |
motor rectangle | 40378 | 0.06% | 5.69% | 0% | 2px | 0.33% | 281px | 30.98% | 28px | 2.91% | 3px | 0.15% | 260px | 18.38% |
van rectangle | 32702 | 0.23% | 13.34% | 0% | 4px | 0.38% | 545px | 48.63% | 46px | 4.77% | 4px | 0.25% | 636px | 31.8% |
person rectangle | 32184 | 0.04% | 4.98% | 0% | 2px | 0.19% | 339px | 32.29% | 26px | 2.78% | 3px | 0.15% | 216px | 15.62% |
truck rectangle | 16284 | 0.47% | 30.55% | 0% | 4px | 0.38% | 705px | 71.5% | 61px | 6.58% | 4px | 0.29% | 984px | 61.1% |
bicycle rectangle | 13069 | 0.07% | 2.52% | 0% | 2px | 0.19% | 272px | 31.76% | 31px | 3.02% | 4px | 0.2% | 333px | 16.65% |
ignored region rectangle | 12371 | 0.27% | 14.1% | 0% | 1px | 0.07% | 554px | 71.67% | 40px | 4.39% | 3px | 0.2% | 1425px | 71.25% |
bus rectangle | 9117 | 0.52% | 22.14% | 0% | 4px | 0.38% | 664px | 54.86% | 67px | 7.85% | 4px | 0.29% | 691px | 49.36% |
tricycle rectangle | 6387 | 0.17% | 4.88% | 0% | 4px | 0.33% | 348px | 29.59% | 40px | 4.41% | 3px | 0.2% | 412px | 20.6% |
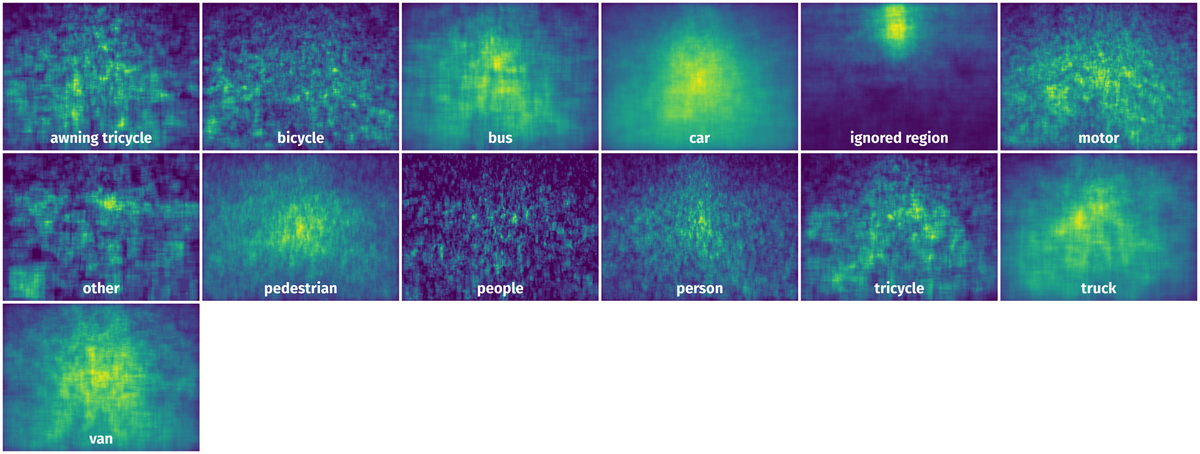
Spatial Heatmap #
The heatmaps below give the spatial distributions of all objects for every class. These visualizations provide insights into the most probable and rare object locations on the image. It helps analyze objects' placements in a dataset.
Objects #
Table contains all 96974 objects. Click a row to preview an image with annotations, and use search or pagination to navigate. Sort columns to find outliers in the dataset.
Object ID ㅤ | Class ㅤ | Image name click row to open | Image size height x width | Height ㅤ | Height ㅤ | Width ㅤ | Width ㅤ | Area ㅤ |
|---|---|---|---|---|---|---|---|---|
1➔ | pedestrian rectangle | 9999987_00000_d_0000005.jpg | 1050 x 1400 | 26px | 2.48% | 26px | 1.86% | 0.05% |
2➔ | pedestrian rectangle | 9999987_00000_d_0000005.jpg | 1050 x 1400 | 25px | 2.38% | 24px | 1.71% | 0.04% |
3➔ | pedestrian rectangle | 9999987_00000_d_0000005.jpg | 1050 x 1400 | 24px | 2.29% | 25px | 1.79% | 0.04% |
4➔ | pedestrian rectangle | 9999987_00000_d_0000005.jpg | 1050 x 1400 | 24px | 2.29% | 18px | 1.29% | 0.03% |
5➔ | pedestrian rectangle | 9999987_00000_d_0000005.jpg | 1050 x 1400 | 29px | 2.76% | 22px | 1.57% | 0.04% |
6➔ | pedestrian rectangle | 9999987_00000_d_0000005.jpg | 1050 x 1400 | 29px | 2.76% | 17px | 1.21% | 0.03% |
7➔ | pedestrian rectangle | 9999987_00000_d_0000005.jpg | 1050 x 1400 | 26px | 2.48% | 16px | 1.14% | 0.03% |
8➔ | pedestrian rectangle | 9999987_00000_d_0000005.jpg | 1050 x 1400 | 21px | 2% | 19px | 1.36% | 0.03% |
9➔ | pedestrian rectangle | 9999987_00000_d_0000005.jpg | 1050 x 1400 | 25px | 2.38% | 20px | 1.43% | 0.03% |
10➔ | pedestrian rectangle | 9999987_00000_d_0000005.jpg | 1050 x 1400 | 25px | 2.38% | 21px | 1.5% | 0.04% |
License #
The VisDrone2019-DET Dataset is publicly available.
Citation #
If you make use of the VisDrone-DET data, please cite the following reference:
@article{zhu2021detection,
  title={Detection and tracking meet drones challenge},
  author={Zhu, Pengfei and Wen, Longyin and Du, Dawei and Bian, Xiao and Fan, Heng and Hu, Qinghua and Ling, Haibin},
  journal={IEEE Transactions on Pattern Analysis and Machine Intelligence},
  volume={44},
  number={11},
  pages={7380--7399},
  year={2021},
  publisher={IEEE}
}
If you are happy with Dataset Ninja and use provided visualizations and tools in your work, please cite us:
@misc{ visualization-tools-for-vis-drone-2019-det-dataset,
  title = { Visualization Tools for VisDrone2019-DET Dataset },
  type = { Computer Vision Tools },
  author = { Dataset Ninja },
  howpublished = { \url{ https://datasetninja.com/vis-drone-2019-det } },
  url = { https://datasetninja.com/vis-drone-2019-det },
  journal = { Dataset Ninja },
  publisher = { Dataset Ninja },
  year = { 2026 },
  month = { jul },
  note = { visited on 2026-07-25 },
}
Download #
Dataset VisDrone2019-DET can be downloaded in Supervisely format:
As an alternative, it can be downloaded with dataset-tools package:
pip install --upgrade dataset-tools
… using following python code:
import dataset_tools as dtools

dtools.download(dataset='VisDrone2019-DET', dst_dir='~/dataset-ninja/')
Make sure not to overlook the python code example available on the Supervisely Developer Portal. It will give you a clear idea of how to effortlessly work with the downloaded dataset.
The data in original format can be downloaded here:
Disclaimer #
Our gal from the legal dep told us we need to post this:
Dataset Ninja provides visualizations and statistics for some datasets that can be found online and can be downloaded by general audience. Dataset Ninja is not a dataset hosting platform and can only be used for informational purposes. The platform does not claim any rights for the original content, including images, videos, annotations and descriptions. Joint publishing is prohibited.
You take full responsibility when you use datasets presented at Dataset Ninja, as well as other information, including visualizations and statistics we provide. You are in charge of compliance with any dataset license and all other permissions. You are required to navigate datasets homepage and make sure that you can use it. In case of any questions, get in touch with us at hello@datasetninja.com.