

Introduction #
The authors provide a VISEM-Tracking: Human Spermatozoa Tracking Dataset with 29,196 frames of wet sperm preparations with manually annotated bounding-box coordinates and additional clinical information about the sperm providers. They present baseline sperm detection performances using the YOLOv5 deep learning (DL) model trained on the VISEM-Tracking dataset. As a result, the authors approve that the dataset can be used to train complex DL models to analyze spermatozoa.
Motivation
Assessing sperm motility manually involves microscopy observation, presenting challenges due to the rapid movement of spermatozoa within the field of view. Accurate manual evaluation demands extensive training, leading to the increased adoption of computer-assisted sperm analysis (CASA) in clinical settings. However, to enhance accuracy and reliability in assessing sperm motility and kinematics, there is a growing need for more data to train supervised machine learning approaches.
Machine learning (ML) is gaining prominence in the analysis of spermatozoa videos under a microscope, contributing to the development of CASA systems. Recent studies have explored the application of deep neural networks (DNNs) to automatically identify specific attributes of semen samples, such as predicting the proportion of progressive, non-progressive, and immotile spermatozoa. Nevertheless, a significant challenge in employing ML for semen analysis lies in the limited availability of data for training and validation. The existing open labeled datasets are sparse, mostly focusing on still-frames of fixed and stained spermatozoa or very brief sequences, primarily geared towards analyzing sperm morphology.
Dataset description
The dataset was initially collected for investigating the impact of overweight and obesity on male reproductive function. Male participants, aged 18 years or older, were recruited from the general population between 2008 and 2013. The study received approval from the Regional Committee for Medical and Health Research Ethics, South East, Norway. All participants provided written informed consent, agreeing to the data’s publication. The original project concluded in December 2017, and all data underwent complete anonymization.
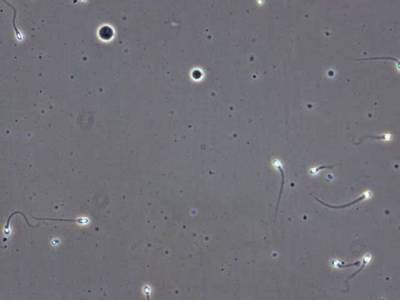
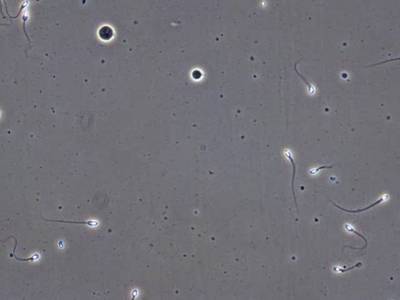
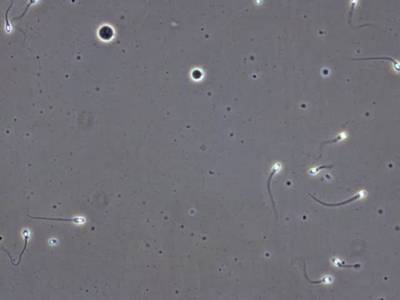
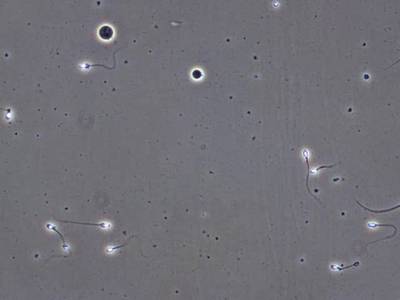
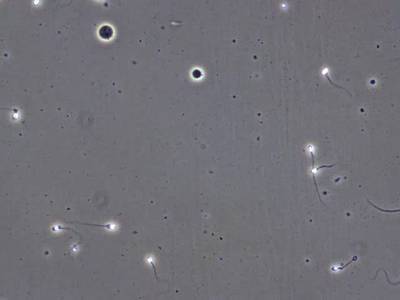
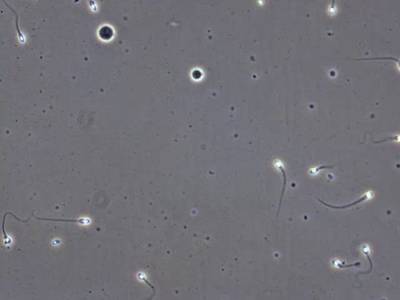
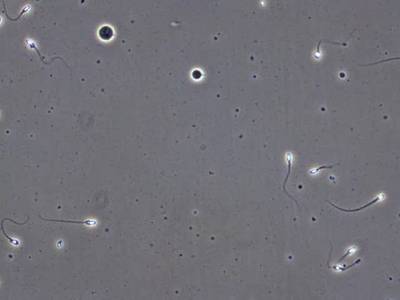
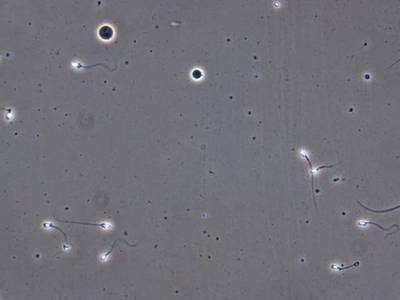
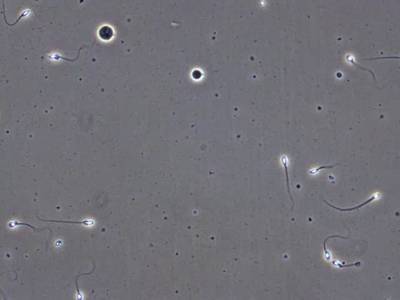
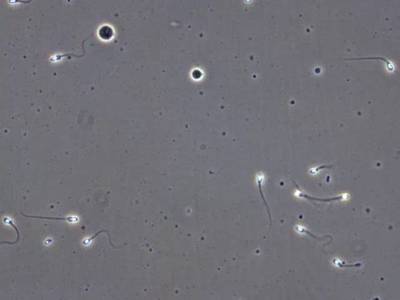
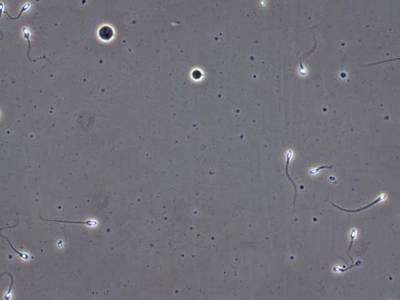
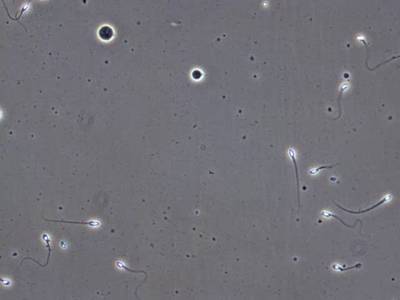
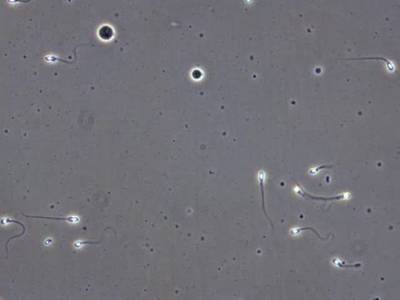
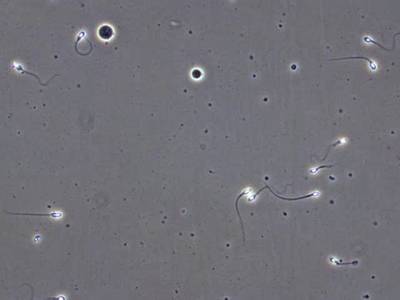
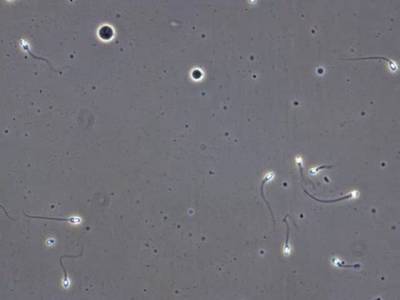
To capture the samples, a heated microscope stage (37°C) was used, and examinations were conducted at 400× magnification with an Olympus CX31 microscope. Recordings were performed using a microscope-mounted UEye UI-2210C camera from IDS Imaging Development Systems in Germany. Following World Health Organization(WHO) recommendations, a light microscope equipped with phase-contrast optics was deemed necessary for examining unstained preparations of fresh semen. The bounding box annotation was performed by data scientists in close collaboration with researchers in the field of male reproduction. The data scientists labeled each image using the tool LabelBox, which was then verified by the three biologists to ensure that the annotations were correct.
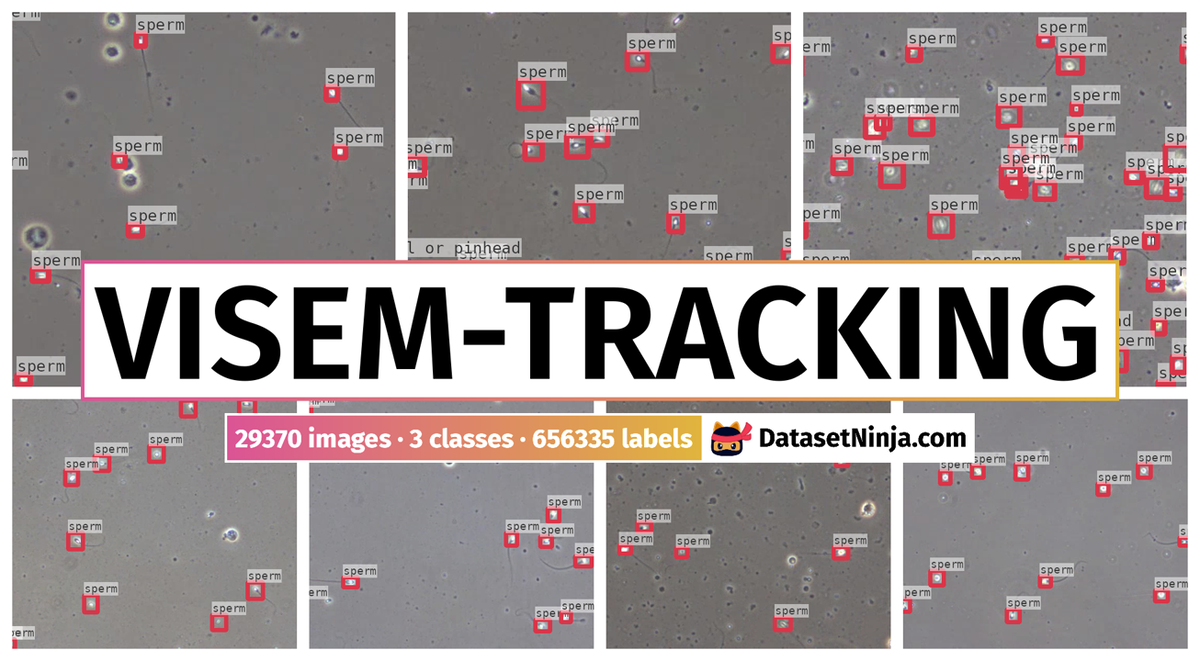
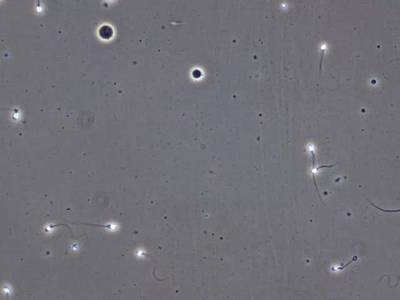
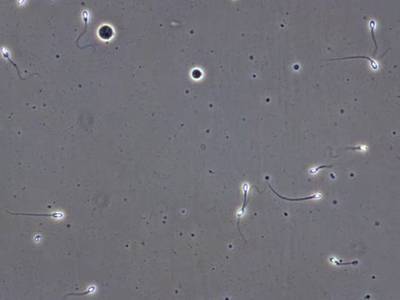
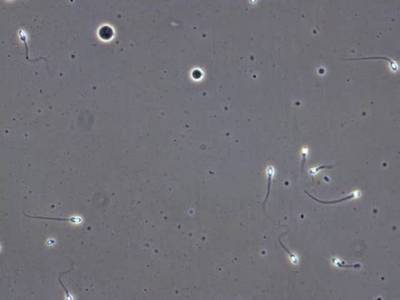
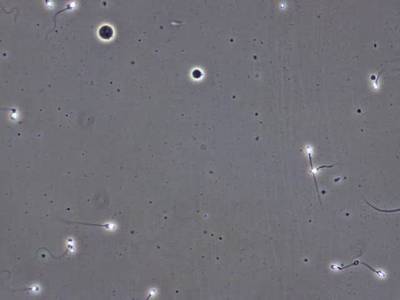
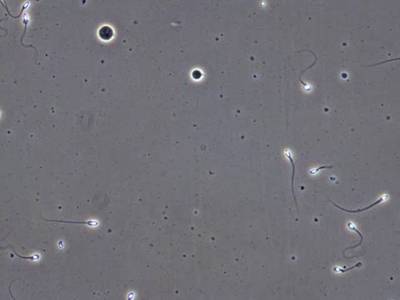
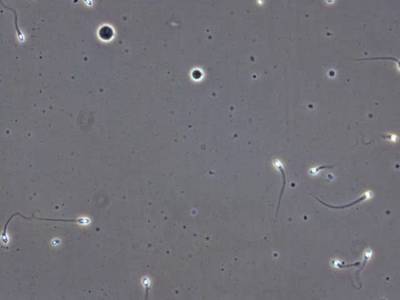
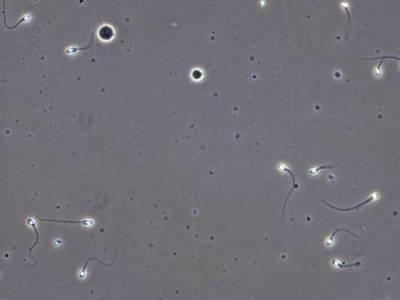
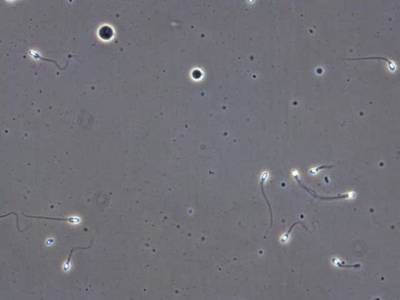
Video frames of wet semen preparations with corresponding bounding boxes. Top: large images showing different classes of bounding boxes, red - sperm, green - sperm cluster, and blue - small or pinhead sperm. Bottom: presenting different sperm concentration levels from high to low (from left to right, respectively).
This dataset contains mainly 20 videos (collected from 20 different patients), each with a fixed duration of 30 seconds with the corresponding annotated bounding boxes. The 20 were chosen based on how different they are to all the videos in the dataset in order to obtain as many diverse tracking samples as
possible. A length of 30 seconds was chosen to make it easier to annotate and process the video files. These videos can also be used for a possible extension of the tracking data in the future.
| Description | Count |
|---|---|
| #annotated 30s video clips | 20 |
| Frames per second (FPS) per video | 45−50 |
| # of annotated frames | 29,196 |
| # Frames with at least one sperm | 28,974 |
| # Frames with at least one cluster | 10,199 |
| # Frames with at least one small or pinhead sperm | 13,532 |
| # bounding boxes | 656,334 |
| # classes | 3 (sperm-0, cluster-1, small or pinhead-2) |
| # unique sperms (with tracking IDs) | 1,121 |
| # unique clusters (with tracking IDs) | 20 |
| # unique small or pinheads (with tracking IDs) | 35 |
| # unlabeled 30s video clips | 336 |
| # remaining 30s video clips from the 20 annotated videos | 166 |
Summary of quantitative information about the VISEM-Tracking dataset.
The folder containing annotated videos has 20 sub-folders with annotations of each video. Each folder of videos has a folder containing extracted frames of the video, a folder containing bounding box labels of each frame, and a folder containing bounding box labels and the corresponding tracking identifiers. In addition to these, a complete video file (.mp4) is provided in the same folder. All bounding box coordinates are given using the YOLO format. The folder containing bounding box details with tracking identifiers has ‘.txt‘ files with unique tracking ids to identify individual spermatozoa throughout the video. It is worth noting that the area of the bounding boxes of the same sperm changes over time depending on its position and movement in the videos.
Changing bounding box area over time for the same sperm head.
Note: dataset contains several .csv files with additional important information. These files include general information about participants (participant_related_data_Train.csv), the standard semen analysis results (semen_analysis_data_Train.csv), serum levels of sex hormones (sex_hormones_Train.csv: measured from blood samples), serum levels of the fatty acids in the phospholipids (fatty_acids_serum_Train.csv: measured from blood samples), fatty acid levels of spermatozoa (fatty_acids_spermatoza_Train.csv). You can download them from the link.
| File name | File headers |
|---|---|
| participant_related_data_Train.csv | ID, Abstinence time(days), Body mass index (kg/m²), Age (years) |
| semen_analysis_data_Train.csv | ID, Sperm concentration (x10^6/mL), Total sperm count (x10^6), Ejaculate volume (mL), Sperm vitality (%), Normal spermatozoa (%), Head defects (%), Midpiece and neck defects (%), Tail defects (%), Cytoplasmic droplet (%), Teratozoospermia index, Progressive motility (%), Non-progressive sperm motility (%), Immotile sperm (%), High DNA stainability, HDS (%), DNA fragmentation index, DFI (%) |
| sex_hormones_Train.csv | ID, Seminal plasma anti-Müllerian hormone (AMH) (pmol/L), Serum total testosterone (nmol/L), Serum oestradiol (nmol/L), Serum sex hormone-binding globulin, SHBG (nmol/L), Serum follicle-stimulating hormone, FSH (IU/L), Serum Luteinizing hormone, LH (IU/L), Serum inhibin B (ng/L), Serum anti-Müllerian hormone, AMH (pmol/L) |
| fatty_acids_serum_Train.csv | ID, Serum C14:0 (myristic acid), Serum C16:0 (palmitic acid), Serum C16:1 (palmitoleic acid), Serum C18:0 (stearic acid), Serum C18:1 n-9 (oleic acid), Serum total C18:1, Serum C18:2 n-6 (linoleic acid, LA), Serum C18:3 n-6 (gamma-linoleic acid, GLA), Serum C20:1 n-9, Serum C20:2 n-6, Serum C20:3 n-6, Serum C20:4 n-6, Serum C20:5 n-3 (eicosapentaenoic acid, EPA), Serum C22:5 n-3 (docosapentaenoic acid, DPA), Serum C22:6 n-3 (docosahexaenoic acid, DHA) |
| fatty_acids_spermatoza_Train.csv | ID, Sperm C14:0 (myristic acid), Sperm C15:0 (pentadecanoic acid), Sperm C16:0 (palmitic acid), Sperm C16:1 n-7 (palmitoleic acid), Sperm C17:0, Sperm C18:0 (stearic acid), Sperm C18:1 trans n-6 to n-11, Sperm C18:1 n-9 (oleic acid), Sperm C18:1 n-7 to n-11, Sperm C18:2 n-6 (Linoleic acid, LA), Sperm C20:0, Sperm C18:3 n-6 (gamma-linoleic acid, GLA), Sperm C18:3 n-3 (a-linoleic acid, ALA), Sperm C20:1 n-9, Sperm C20:2 n-6, Sperm C22:0, Sperm C20:3 n-6, Sperm C20:4 n-6 and C22:1 n-9 combined, Sperm C20:5 n-3 (eicosapentaenoic acid, EPA), Sperm C24:0, Sperm C24:1 n-9, Sperm C22:5 n-3 (docosapentaenoic acid, DPA), Sperm C22:6,n3 (docosahexaenoic acid, DHA) |
Summary of content of CSV files included in the VISEM-Tracking dataset.
 Homepage
 Research Paper
 GitHub
Summary #
VISEM-Tracking: Human Spermatozoa Tracking Dataset is a dataset for an object detection task. It is used in the medical industry.
The dataset consists of 29370 images with 656335 labeled objects belonging to 3 different classes including sperm, small or pinhead, and cluster.
Images in the VISEM-Tracking dataset have bounding box annotations. There are 174 (1% of the total) unlabeled images (i.e. without annotations). There is 1 split in the dataset: train (29370 images). Additionally, every image contains information about patients abstinence time, age, and body mass index. Moreover, every image is tagged with sequence. The dataset was released in 2022 by the SimulaMet, Norway and the OsloMet, Norway.
Explore #
VISEM-Tracking dataset has 29370 images. Click on one of the examples below or open "Explore" tool anytime you need to view dataset images with annotations. This tool has extended visualization capabilities like zoom, translation, objects table, custom filters and more. Hover the mouse over the images to hide or show annotations.


Class balance #
There are 3 annotation classes in the dataset. Find the general statistics and balances for every class in the table below. Click any row to preview images that have labels of the selected class. Sort by column to find the most rare or prevalent classes.

Class ㅤ | Images ㅤ | Objects ㅤ | Count on image average | Area on image average |
|---|---|---|---|---|
sperm➔ rectangle | 28974 | 612377 | 21.14 | 3.78% |
small or pinhead➔ rectangle | 13532 | 22112 | 1.63 | 0.25% |
cluster➔ rectangle | 10199 | 21846 | 2.14 | 2.27% |
Co-occurrence matrix #
Co-occurrence matrix is an extremely valuable tool that shows you the images for every pair of classes: how many images have objects of both classes at the same time. If you click any cell, you will see those images. We added the tooltip with an explanation for every cell for your convenience, just hover the mouse over a cell to preview the description.
Images #
Explore every single image in the dataset with respect to the number of annotations of each class it has. Click a row to preview selected image. Sort by any column to find anomalies and edge cases. Use horizontal scroll if the table has many columns for a large number of classes in the dataset.
Object distribution #
Interactive heatmap chart for every class with object distribution shows how many images are in the dataset with a certain number of objects of a specific class. Users can click cell and see the list of all corresponding images.
Class sizes #
The table below gives various size properties of objects for every class. Click a row to see the image with annotations of the selected class. Sort columns to find classes with the smallest or largest objects or understand the size differences between classes.
Class | Object count | Avg area | Max area | Min area | Min height | Min height | Max height | Max height | Avg height | Avg height | Min width | Min width | Max width | Max width |
|---|---|---|---|---|---|---|---|---|---|---|---|---|---|---|
sperm rectangle | 612377 | 0.18% | 0.8% | 0.01% | 2px | 0.42% | 51px | 10.62% | 23px | 4.78% | 2px | 0.31% | 52px | 8.12% |
small or pinhead rectangle | 22112 | 0.15% | 0.41% | 0.03% | 6px | 1.25% | 37px | 7.71% | 21px | 4.31% | 7px | 1.09% | 35px | 5.47% |
cluster rectangle | 21846 | 1.06% | 3.09% | 0.42% | 33px | 6.88% | 97px | 20.21% | 52px | 10.92% | 24px | 3.75% | 98px | 15.31% |
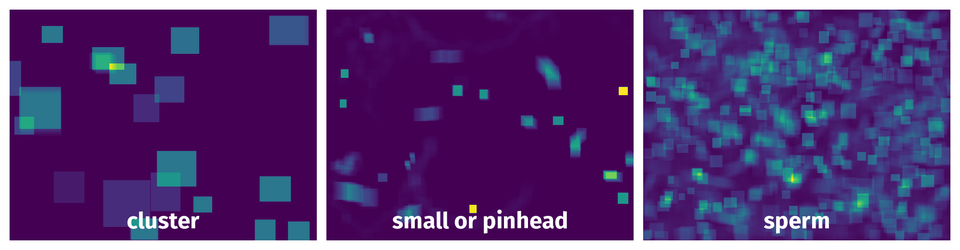
Spatial Heatmap #
The heatmaps below give the spatial distributions of all objects for every class. These visualizations provide insights into the most probable and rare object locations on the image. It helps analyze objects' placements in a dataset.
Objects #
Table contains all 102928 objects. Click a row to preview an image with annotations, and use search or pagination to navigate. Sort columns to find outliers in the dataset.
Object ID ㅤ | Class ㅤ | Image name click row to open | Image size height x width | Height ㅤ | Height ㅤ | Width ㅤ | Width ㅤ | Area ㅤ |
|---|---|---|---|---|---|---|---|---|
1➔ | sperm rectangle | 15_frame_530.jpg | 480 x 640 | 17px | 3.54% | 20px | 3.12% | 0.11% |
2➔ | sperm rectangle | 15_frame_530.jpg | 480 x 640 | 21px | 4.38% | 21px | 3.28% | 0.14% |
3➔ | sperm rectangle | 15_frame_530.jpg | 480 x 640 | 19px | 3.96% | 19px | 2.97% | 0.12% |
4➔ | sperm rectangle | 15_frame_530.jpg | 480 x 640 | 23px | 4.79% | 16px | 2.5% | 0.12% |
5➔ | sperm rectangle | 15_frame_530.jpg | 480 x 640 | 21px | 4.38% | 23px | 3.59% | 0.16% |
6➔ | sperm rectangle | 15_frame_530.jpg | 480 x 640 | 12px | 2.5% | 20px | 3.12% | 0.08% |
7➔ | sperm rectangle | 15_frame_530.jpg | 480 x 640 | 16px | 3.33% | 19px | 2.97% | 0.1% |
8➔ | sperm rectangle | 15_frame_530.jpg | 480 x 640 | 15px | 3.12% | 17px | 2.66% | 0.08% |
9➔ | sperm rectangle | 15_frame_530.jpg | 480 x 640 | 16px | 3.33% | 12px | 1.88% | 0.06% |
10➔ | sperm rectangle | 15_frame_530.jpg | 480 x 640 | 14px | 2.92% | 15px | 2.34% | 0.07% |
License #
Citation #
If you make use of the VISEM-Tracking data, please cite the following reference:
@article{thambawita2023visem,
  title={VISEM-Tracking, a human spermatozoa tracking dataset},
  author={Thambawita, Vajira and Hicks, Steven A and Stor{\aa}s, Andrea M and Nguyen, Thu and Andersen, Jorunn M and Witczak, Oliwia and Haugen, Trine B and Hammer, Hugo L and Halvorsen, P{\aa}l and Riegler, Michael A},
  journal={Scientific Data},
  volume={10},
  number={1},
  pages={1--8},
  year={2023},
  publisher={Nature Publishing Group}
}
If you are happy with Dataset Ninja and use provided visualizations and tools in your work, please cite us:
@misc{ visualization-tools-for-visem-tracking-dataset,
  title = { Visualization Tools for VISEM-Tracking Dataset },
  type = { Computer Vision Tools },
  author = { Dataset Ninja },
  howpublished = { \url{ https://datasetninja.com/visem-tracking } },
  url = { https://datasetninja.com/visem-tracking },
  journal = { Dataset Ninja },
  publisher = { Dataset Ninja },
  year = { 2026 },
  month = { jul },
  note = { visited on 2026-07-29 },
}
Download #
Dataset VISEM-Tracking can be downloaded in Supervisely format:
As an alternative, it can be downloaded with dataset-tools package:
pip install --upgrade dataset-tools
… using following python code:
import dataset_tools as dtools

dtools.download(dataset='VISEM-Tracking', dst_dir='~/dataset-ninja/')
Make sure not to overlook the python code example available on the Supervisely Developer Portal. It will give you a clear idea of how to effortlessly work with the downloaded dataset.
The data in original format can be downloaded here.
Disclaimer #
Our gal from the legal dep told us we need to post this:
Dataset Ninja provides visualizations and statistics for some datasets that can be found online and can be downloaded by general audience. Dataset Ninja is not a dataset hosting platform and can only be used for informational purposes. The platform does not claim any rights for the original content, including images, videos, annotations and descriptions. Joint publishing is prohibited.
You take full responsibility when you use datasets presented at Dataset Ninja, as well as other information, including visualizations and statistics we provide. You are in charge of compliance with any dataset license and all other permissions. You are required to navigate datasets homepage and make sure that you can use it. In case of any questions, get in touch with us at hello@datasetninja.com.