

Introduction #
The authors of the VSAI - a multi-view dataset for vehicle detection in complex scenarios using aerial images - emphasize the importance of arbitrary-oriented vehicle detection in aerial imagery for applications like traffic management, disaster monitoring, and smart cities. Progress in object detection in natural imagery has been substantial, but it’s been slower for aerial imagery due to challenges like variations and limited quality datasets. The created dataset includes various aerial views of real-world scenes from different drone platforms.
The VSAI dataset comprises 49,712 annotated vehicle instances, including oriented bounding boxes and arbitrary quadrilateral bounding boxes. This encompasses 47,519 small vehicles and 2,193 large vehicles. In addition to the object annotations, the occlusion rate of objects was annotated to improve the generalization capabilities of object detection networks.
The authors compare conventional datasets with those collected by camera-equipped drones, highlighting the broad applications of the latter in fields like agriculture, disaster monitoring, traffic management, and military reconnaissance. Unlike natural datasets where objects are usually oriented upward due to gravity, aerial images under oblique views exhibit instances with arbitrary directions, influenced by the drone’s view and scale transformation.
They outline the unique challenges of object detection in aerial imagery, including large size variations of instances, degraded images due to flight limitations and weather variations, presence of many small instances, unbalanced object density, and arbitrary orientations. The authors also acknowledge dataset bias and the need for a dataset that reflects real-world complexity to enhance the generalization ability of object detection networks.
Furthermore, the authors emphasize the significance of identifying objects using multi-view (off-nadir) imagery from drones, particularly in applications like disaster monitoring, emergency rescue, and environmental reconnaissance.
| Version | CMOS | Field Angle | Resolution |
|---|---|---|---|
| Mavic air | 1/2.3 inch | 85° | 4056 × 3040 |
| Mavic 2 pro | 1 inch | 77° | 5472 × 3648 |
| Phantom 3 Pro | 1/2.3 inch | 94° | 4000 × 3000 |
| Phantom 4 | 1/2.3 inch | 94° | 4000 × 3000 |
| Phantom 4 RTK | 1 inch | 84° | 5472 × 3648 |
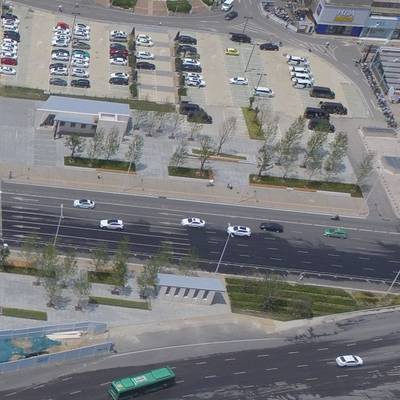
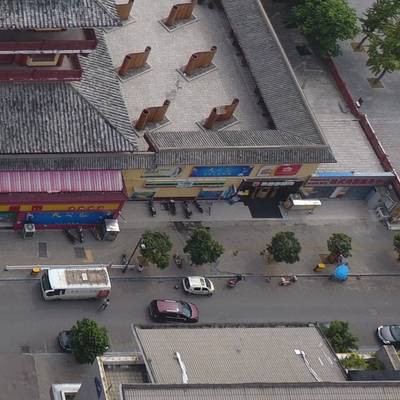
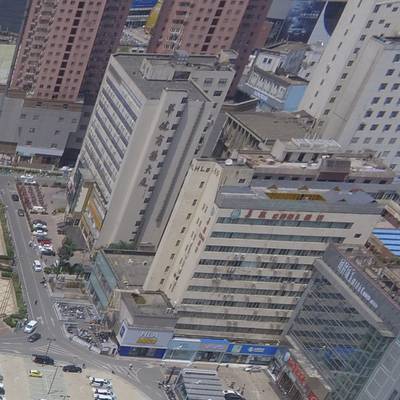
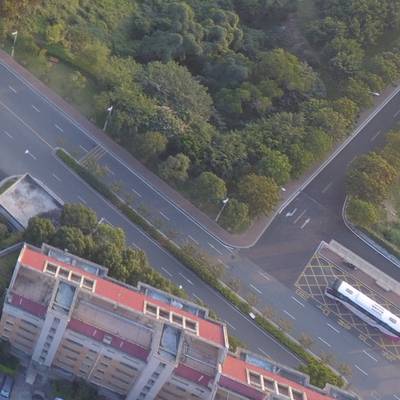
The VSAI dataset comprises 444 static images collected from various drone platforms, including DJI Mavic Air, DJI Mavic 2 Pro, Phantom 3 Pro, Phantom 4, and 4 RTK. The dataset covers a wide range of technical parameters and was collected from various Chinese cities to ensure geographic diversity. Images were captured throughout the year, under various weather and lighting conditions, focusing on small vehicles (e.g., cars, minibuses, pickups) and large vehicles (e.g., buses, large trucks). The dataset aims to address the uneven distribution of vehicles in real-world scenarios.
In the VSAI dataset, the instances with a line of sight (LOS) angles of (−30°, −25°) were the largest. Overall, the LOS angle distribution of the number of instances was not balanced, mainly concentrating on small observation angles in the range of (−45°, −15°).
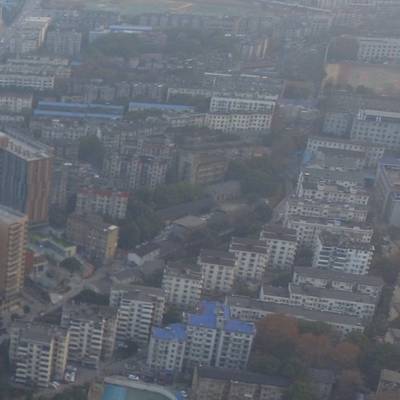
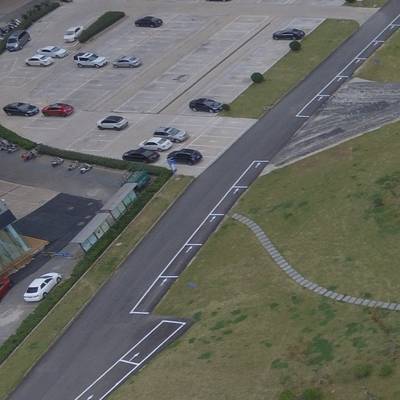
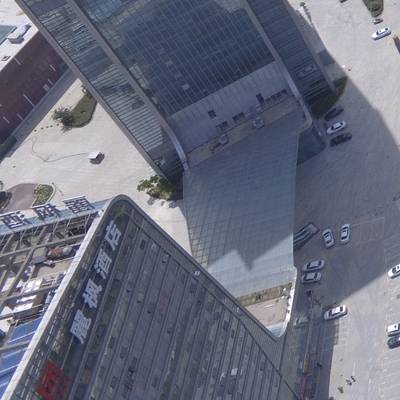
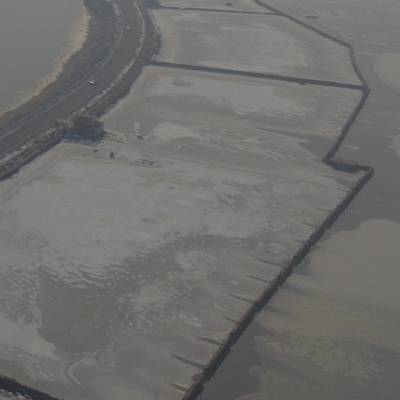
VSAI covers six complicated scenes throughout China, including the desert, city, mountain, suburb, riverside, and seaside. The six scenarios also contain many subsets, such as cities, including the overhead bridge, crossroad, stadium, riverside embracing dam, bridge, etc.
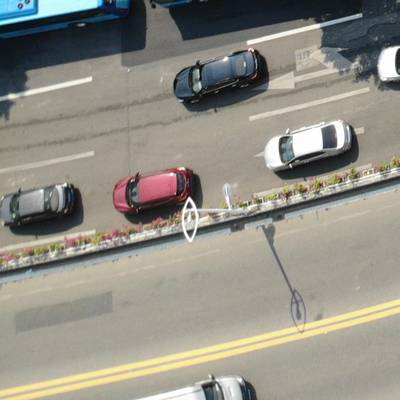
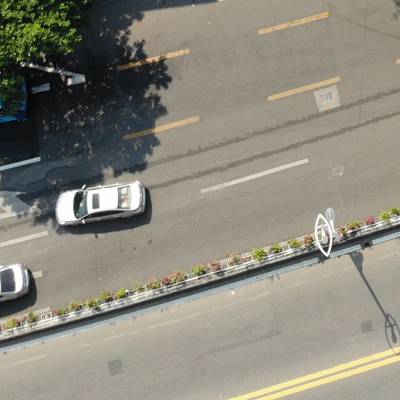
The authors also collected statistical information about the vehicles, including the vehicle’s orientation angles, instance length, and vehicle aspect ratio. Thus, the lengths of the vehicles were concentrated in the range of 0 to 75 pixels, signifying that there were numerous small instances in the VSAI dataset. At the same time, there was a considerable scale change in VSAI. In addition, distinct perspectives also resulted in a wider range of the vehicle aspect ratio rather than the aspect ratio of 2 or so in traditional down-view aerial images.
Additionally, VSAI provides useful annotations with respect to the occlusion ratio. In this case, the proportion of vehicles being blocked to represent the occlusion ratio and define four levels of occlusions: no occlusion N (occlusion ratio 0%), small occlusion S (occlusion ratio < 30%), moderate occlusion M (occlusion ratio 30~70%), and large occlusion L (occlusion ratio > 70%), mainly for better reflecting the instance density of the instance location.
 Homepage
 Research Paper
Summary #
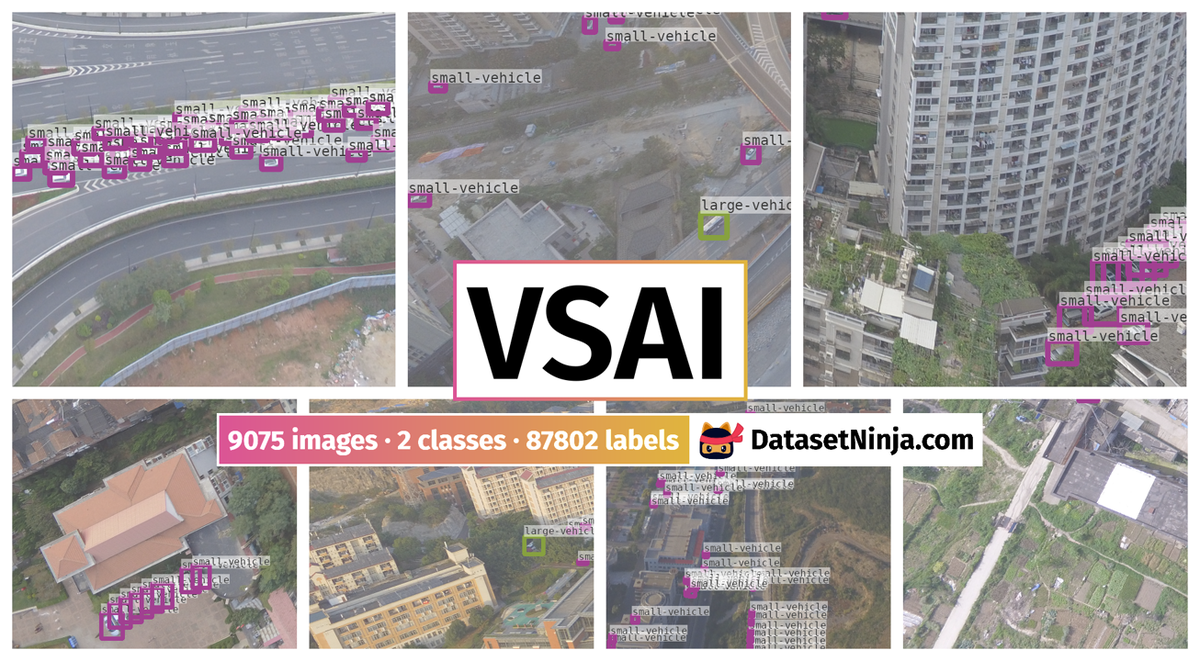
VSAI: A Multi-View Dataset for Vehicle Detection in Complex Scenarios Using Aerial Images is a dataset for an object detection task. It is used in the vehicle detection domain, and in the utilities industry.
The dataset consists of 9075 images with 87802 labeled objects belonging to 2 different classes including small-vehicle and large-vehicle.
Images in the VSAI dataset have bounding box annotations. There are 3703 (41% of the total) unlabeled images (i.e. without annotations). There are 3 splits in the dataset: train (5240 images), test (2315 images), and val (1520 images). The dataset was released in 2022 by the National University of Defense Technology, China.
Explore #
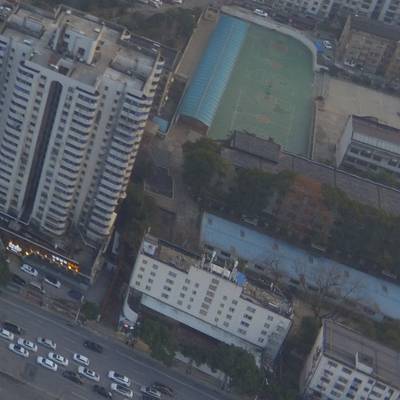
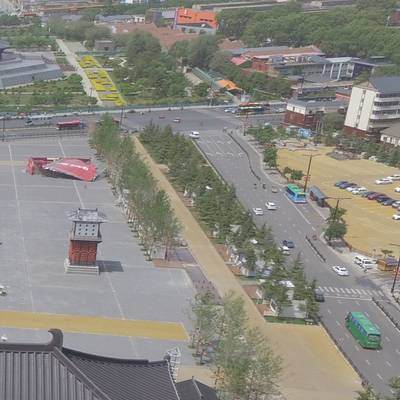
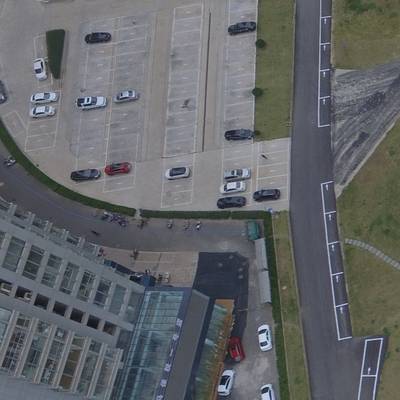
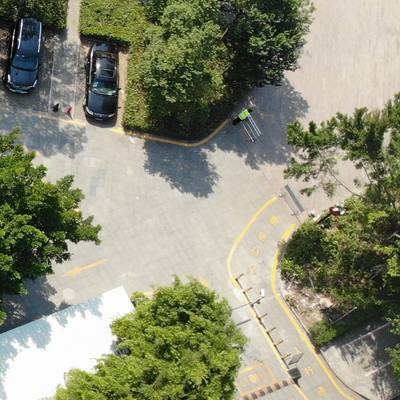
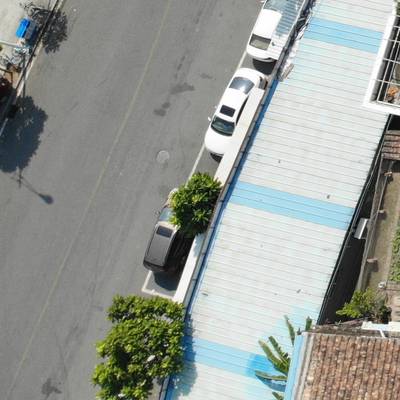
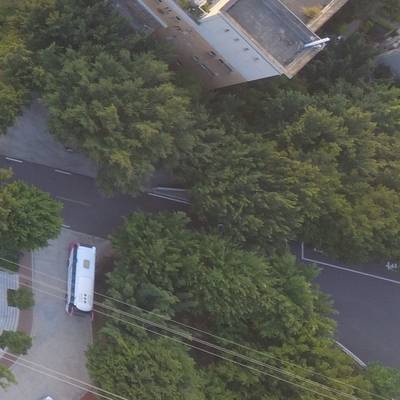
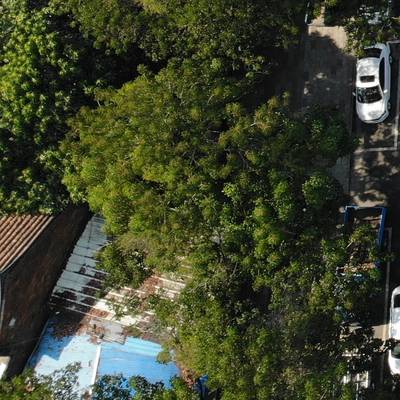
VSAI dataset has 9075 images. Click on one of the examples below or open "Explore" tool anytime you need to view dataset images with annotations. This tool has extended visualization capabilities like zoom, translation, objects table, custom filters and more. Hover the mouse over the images to hide or show annotations.


Class balance #
There are 2 annotation classes in the dataset. Find the general statistics and balances for every class in the table below. Click any row to preview images that have labels of the selected class. Sort by column to find the most rare or prevalent classes.

Class ㅤ | Images ㅤ | Objects ㅤ | Count on image average | Area on image average |
|---|---|---|---|---|
small-vehicle➔ polygon | 5250 | 84293 | 16.06 | 2.87% |
large-vehicle➔ polygon | 1236 | 3509 | 2.84 | 1.92% |
Co-occurrence matrix #
Co-occurrence matrix is an extremely valuable tool that shows you the images for every pair of classes: how many images have objects of both classes at the same time. If you click any cell, you will see those images. We added the tooltip with an explanation for every cell for your convenience, just hover the mouse over a cell to preview the description.
Images #
Explore every single image in the dataset with respect to the number of annotations of each class it has. Click a row to preview selected image. Sort by any column to find anomalies and edge cases. Use horizontal scroll if the table has many columns for a large number of classes in the dataset.
Class sizes #
The table below gives various size properties of objects for every class. Click a row to see the image with annotations of the selected class. Sort columns to find classes with the smallest or largest objects or understand the size differences between classes.
Class | Object count | Avg area | Max area | Min area | Min height | Min height | Max height | Max height | Avg height | Avg height | Min width | Min width | Max width | Max width |
|---|---|---|---|---|---|---|---|---|---|---|---|---|---|---|
small-vehicle polygon | 84293 | 0.18% | 6.65% | 0% | 3px | 0.29% | 447px | 43.65% | 43px | 4.16% | 2px | 0.2% | 444px | 43.36% |
large-vehicle polygon | 3509 | 0.72% | 9.61% | 0% | 2px | 0.2% | 554px | 54.1% | 87px | 8.47% | 2px | 0.2% | 583px | 56.93% |
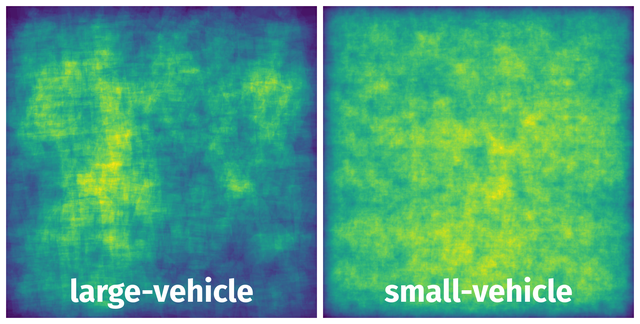
Spatial Heatmap #
The heatmaps below give the spatial distributions of all objects for every class. These visualizations provide insights into the most probable and rare object locations on the image. It helps analyze objects' placements in a dataset.
Objects #
Table contains all 87802 objects. Click a row to preview an image with annotations, and use search or pagination to navigate. Sort columns to find outliers in the dataset.
Object ID ㅤ | Class ㅤ | Image name click row to open | Image size height x width | Height ㅤ | Height ㅤ | Width ㅤ | Width ㅤ | Area ㅤ |
|---|---|---|---|---|---|---|---|---|
1➔ | small-vehicle polygon | q_DJI_0047__1024__0___0.png | 1024 x 1024 | 44px | 4.3% | 57px | 5.57% | 0.11% |
2➔ | small-vehicle polygon | q_DJI_0047__1024__0___0.png | 1024 x 1024 | 39px | 3.81% | 56px | 5.47% | 0.1% |
3➔ | small-vehicle polygon | q_DJI_0047__1024__0___0.png | 1024 x 1024 | 36px | 3.52% | 52px | 5.08% | 0.08% |
4➔ | small-vehicle polygon | q_DJI_0047__1024__0___0.png | 1024 x 1024 | 36px | 3.52% | 49px | 4.79% | 0.08% |
5➔ | small-vehicle polygon | q_DJI_0047__1024__0___0.png | 1024 x 1024 | 46px | 4.49% | 55px | 5.37% | 0.1% |
6➔ | small-vehicle polygon | q_DJI_0047__1024__0___0.png | 1024 x 1024 | 42px | 4.1% | 51px | 4.98% | 0.09% |
7➔ | small-vehicle polygon | q_DJI_0047__1024__0___0.png | 1024 x 1024 | 34px | 3.32% | 49px | 4.79% | 0.08% |
8➔ | small-vehicle polygon | q_DJI_0047__1024__0___0.png | 1024 x 1024 | 33px | 3.22% | 50px | 4.88% | 0.07% |
9➔ | small-vehicle polygon | q_DJI_0047__1024__0___0.png | 1024 x 1024 | 37px | 3.61% | 51px | 4.98% | 0.09% |
10➔ | small-vehicle polygon | q_DJI_0047__1024__0___0.png | 1024 x 1024 | 34px | 3.32% | 45px | 4.39% | 0.06% |
License #
VSAI: A Multi-View Dataset for Vehicle Detection in Complex Scenarios Using Aerial Images is under CC BY-NC-SA 4.0 license.
Citation #
If you make use of the VSAI data, please cite the following reference:
Wang J, Teng X, Li Z, Yu Q, Bian Y, Wei J. VSAI: A Multi-View Dataset for Vehicle Detection in Complex Scenarios Using Aerial Images. Drones. 2022; 6(7):161. https://doi.org/10.3390/drones6070161
If you are happy with Dataset Ninja and use provided visualizations and tools in your work, please cite us:
@misc{ visualization-tools-for-vsai-dataset,
  title = { Visualization Tools for VSAI Dataset },
  type = { Computer Vision Tools },
  author = { Dataset Ninja },
  howpublished = { \url{ https://datasetninja.com/vsai } },
  url = { https://datasetninja.com/vsai },
  journal = { Dataset Ninja },
  publisher = { Dataset Ninja },
  year = { 2026 },
  month = { jul },
  note = { visited on 2026-07-26 },
}
Download #
Dataset VSAI can be downloaded in Supervisely format:
As an alternative, it can be downloaded with dataset-tools package:
pip install --upgrade dataset-tools
… using following python code:
import dataset_tools as dtools

dtools.download(dataset='VSAI', dst_dir='~/dataset-ninja/')
Make sure not to overlook the python code example available on the Supervisely Developer Portal. It will give you a clear idea of how to effortlessly work with the downloaded dataset.
The data in original format can be downloaded here.
Disclaimer #
Our gal from the legal dep told us we need to post this:
Dataset Ninja provides visualizations and statistics for some datasets that can be found online and can be downloaded by general audience. Dataset Ninja is not a dataset hosting platform and can only be used for informational purposes. The platform does not claim any rights for the original content, including images, videos, annotations and descriptions. Joint publishing is prohibited.
You take full responsibility when you use datasets presented at Dataset Ninja, as well as other information, including visualizations and statistics we provide. You are in charge of compliance with any dataset license and all other permissions. You are required to navigate datasets homepage and make sure that you can use it. In case of any questions, get in touch with us at hello@datasetninja.com.