Introduction #
For this work, authors have thus built a water-related image database, which they referred to as the WaterDataset. This training dataset contains 2388 water-related images that come with annotations. It also contains 20 manually labeled water videos for testing. The dataset is designed for a novel video object segmentation network for water, named WaterNet, which can effectively capture variations in water’s appearance in the video through online learning and updating.
The training set has 2388 water-related still images with annotations; 1888 images are from ADE20K and 300 images are from RiverDataset. These images contain various types of water, including lakes, canals, rivers, oceans, and floods. The evaluation set contains 20 water-related videos:
- 7 videos recorded on days with heavy rain, when local creeks and ponds were flooded. Frames in these 7 videos were all manually labeled.
- 10 surveillance videos from Farson Digital Watercams that recorded open waters from 8 a.m. to 6 p.m. Frames in these 10 videos were uniformly labeled every 50 frames.
- 3 surveillance videos taken at the beach recorded changes in sea waves.
Please Note, that some images contain blanked masks (For example ADE_train_00002842.png, ADE_train_00003321.png, etc. (total 8)
Summary #
WaterDataset v2 is a dataset for a semantic segmentation task. It is applicable or relevant across various domains.
The dataset consists of 4413 images with 2392 labeled objects belonging to 1 single class (water).
Images in the WaterDataset dataset have pixel-level semantic segmentation annotations. There are 2021 (46% of the total) unlabeled images (i.e. without annotations). There are 2 splits in the dataset: val (2225 images) and train (2188 images). Also, the dataset contains seq tag. The dataset was released in 2020 by the Louisiana State University, Zhejiang University, and Northeastern University.

Explore #
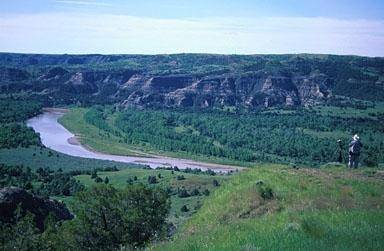
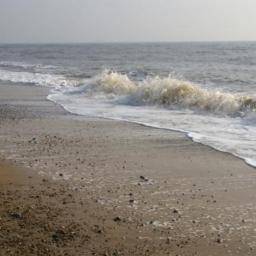
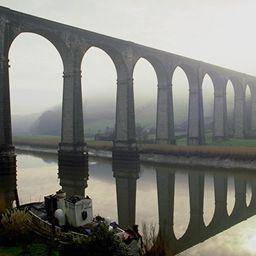
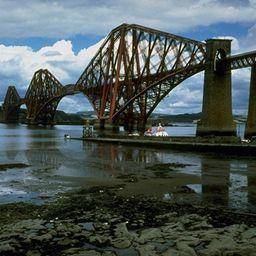
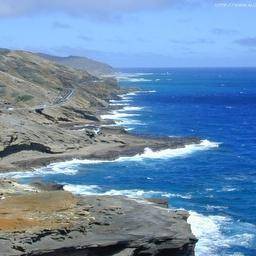
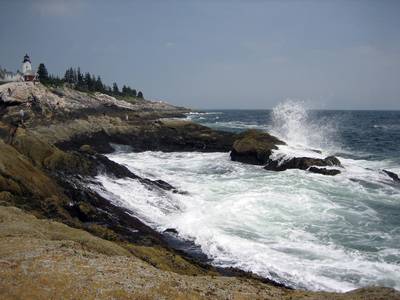
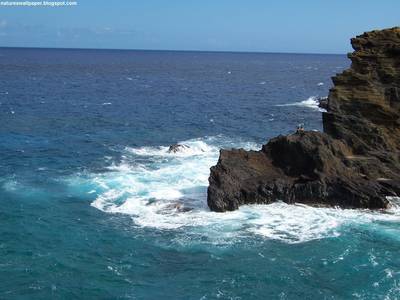
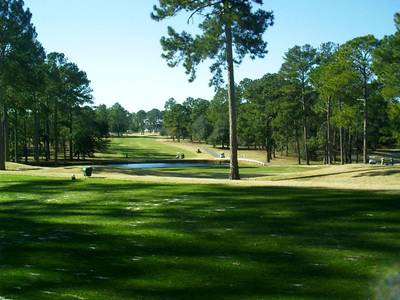
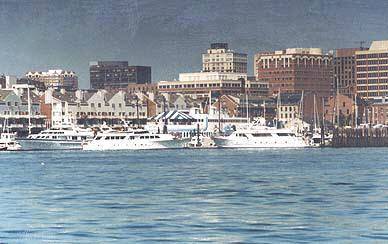
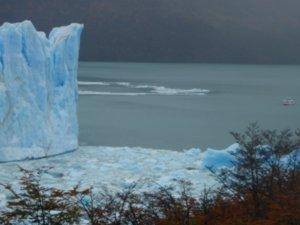
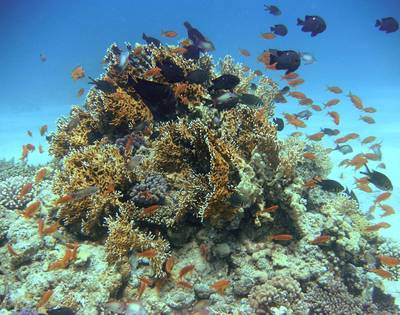
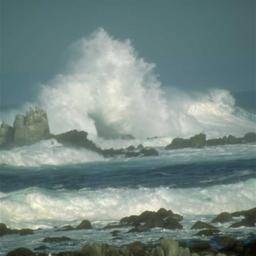
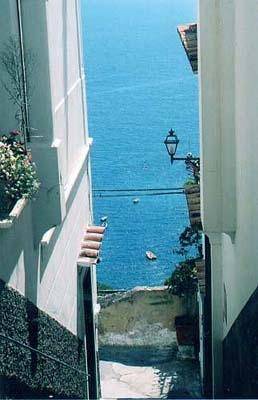
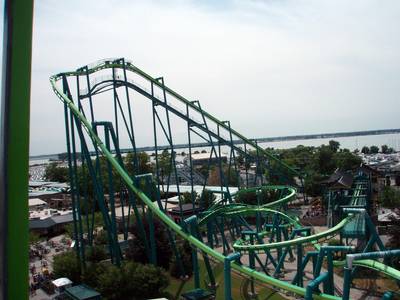
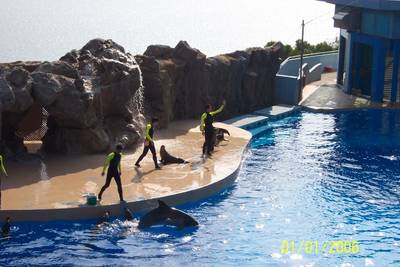
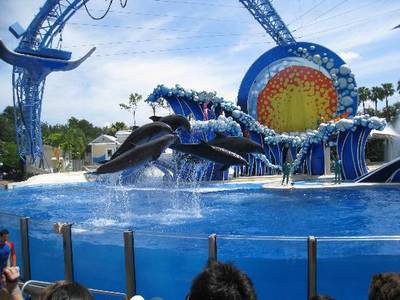
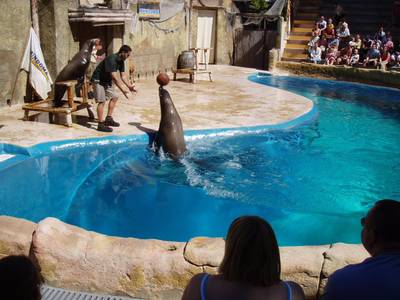
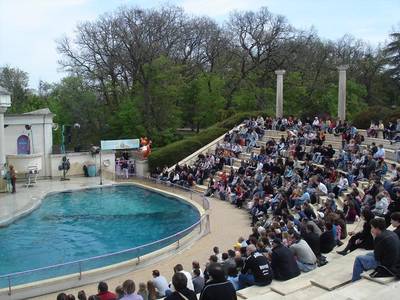
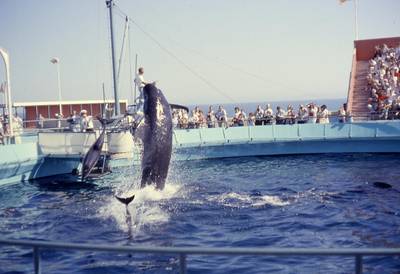
WaterDataset dataset has 4413 images. Click on one of the examples below or open "Explore" tool anytime you need to view dataset images with annotations. This tool has extended visualization capabilities like zoom, translation, objects table, custom filters and more. Hover the mouse over the images to hide or show annotations.
























Class balance #
There are 1 annotation classes in the dataset. Find the general statistics and balances for every class in the table below. Click any row to preview images that have labels of the selected class. Sort by column to find the most rare or prevalent classes.
Class ㅤ | Images ㅤ | Objects ㅤ | Count on image average | Area on image average |
|---|---|---|---|---|
water➔ mask | 2392 | 2392 | 1 | 25.98% |
Images #
Explore every single image in the dataset with respect to the number of annotations of each class it has. Click a row to preview selected image. Sort by any column to find anomalies and edge cases. Use horizontal scroll if the table has many columns for a large number of classes in the dataset.
Object distribution #
Interactive heatmap chart for every class with object distribution shows how many images are in the dataset with a certain number of objects of a specific class. Users can click cell and see the list of all corresponding images.
Class sizes #
The table below gives various size properties of objects for every class. Click a row to see the image with annotations of the selected class. Sort columns to find classes with the smallest or largest objects or understand the size differences between classes.
Class | Object count | Avg area | Max area | Min area | Min height | Min height | Max height | Max height | Avg height | Avg height | Min width | Min width | Max width | Max width |
|---|---|---|---|---|---|---|---|---|---|---|---|---|---|---|
water mask | 2392 | 25.98% | 98.28% | 0.02% | 3px | 0.35% | 1449px | 100% | 230px | 44.01% | 8px | 0.78% | 2839px | 100% |
Spatial Heatmap #
The heatmaps below give the spatial distributions of all objects for every class. These visualizations provide insights into the most probable and rare object locations on the image. It helps analyze objects' placements in a dataset.

Objects #
Table contains all 2392 objects. Click a row to preview an image with annotations, and use search or pagination to navigate. Sort columns to find outliers in the dataset.
Object ID ㅤ | Class ㅤ | Image name click row to open | Image size height x width | Height ㅤ | Height ㅤ | Width ㅤ | Width ㅤ | Area ㅤ |
|---|---|---|---|---|---|---|---|---|
1➔ | water mask | ADE20K_ADE_train_00000941.png | 313 x 472 | 227px | 72.52% | 472px | 100% | 31.82% |
2➔ | water mask | ADE20K_ADE_train_00012890.png | 788 x 1144 | 225px | 28.55% | 1142px | 99.83% | 23.26% |
3➔ | water mask | ADE20K_ADE_train_00010883.png | 389 x 500 | 128px | 32.9% | 499px | 99.8% | 20.28% |
4➔ | water mask | river_00222.jpg | 480 x 640 | 340px | 70.83% | 583px | 91.09% | 31.88% |
5➔ | water mask | ADE20K_ADE_train_00003096.png | 256 x 256 | 141px | 55.08% | 253px | 98.83% | 29.89% |
6➔ | water mask | ADE20K_ADE_train_00014356.png | 483 x 716 | 196px | 40.58% | 715px | 99.86% | 36.59% |
7➔ | water mask | ADE20K_ADE_train_00013023.png | 245 x 331 | 244px | 99.59% | 330px | 99.7% | 84.6% |
8➔ | water mask | ADE20K_ADE_train_00002233.png | 1288 x 966 | 183px | 14.21% | 915px | 94.72% | 7.27% |
9➔ | water mask | ADE20K_ADE_train_00010793.png | 1632 x 1224 | 459px | 28.12% | 1217px | 99.43% | 20.75% |
10➔ | water mask | ADE20K_ADE_train_00006485.png | 396 x 599 | 169px | 42.68% | 295px | 49.25% | 10.37% |
License #
Citation #
If you make use of the Water Segmentation data, please cite the following reference:
@article{liang2020waternet,
  title={WaterNet: An adaptive matching pipeline for segmenting water with volatile appearance},
  author={Liang, Yongqing and Jafari, Navid and Luo, Xing and Chen, Qin and Cao, Yanpeng and Li, Xin},
  journal={Computational Visual Media},
  pages={1--14},
  year={2020},
  publisher={Springer}
}
If you are happy with Dataset Ninja and use provided visualizations and tools in your work, please cite us:
@misc{ visualization-tools-for-water-segmentation-dataset,
  title = { Visualization Tools for WaterDataset Dataset },
  type = { Computer Vision Tools },
  author = { Dataset Ninja },
  howpublished = { \url{ https://datasetninja.com/water-segmentation } },
  url = { https://datasetninja.com/water-segmentation },
  journal = { Dataset Ninja },
  publisher = { Dataset Ninja },
  year = { 2026 },
  month = { feb },
  note = { visited on 2026-02-05 },
}
Download #
Dataset WaterDataset can be downloaded in Supervisely format:
As an alternative, it can be downloaded with dataset-tools package:
pip install --upgrade dataset-tools
… using following python code:
import dataset_tools as dtools

dtools.download(dataset='WaterDataset', dst_dir='~/dataset-ninja/')
Make sure not to overlook the python code example available on the Supervisely Developer Portal. It will give you a clear idea of how to effortlessly work with the downloaded dataset.
Disclaimer #
Our gal from the legal dep told us we need to post this:
Dataset Ninja provides visualizations and statistics for some datasets that can be found online and can be downloaded by general audience. Dataset Ninja is not a dataset hosting platform and can only be used for informational purposes. The platform does not claim any rights for the original content, including images, videos, annotations and descriptions. Joint publishing is prohibited.
You take full responsibility when you use datasets presented at Dataset Ninja, as well as other information, including visualizations and statistics we provide. You are in charge of compliance with any dataset license and all other permissions. You are required to navigate datasets homepage and make sure that you can use it. In case of any questions, get in touch with us at hello@datasetninja.com.


