

Introduction #
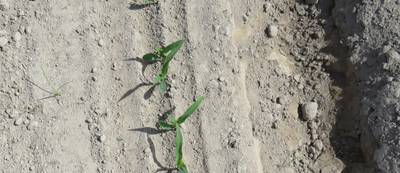
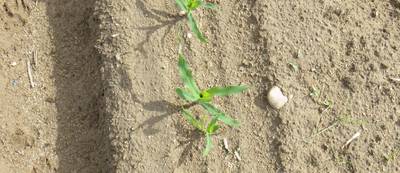
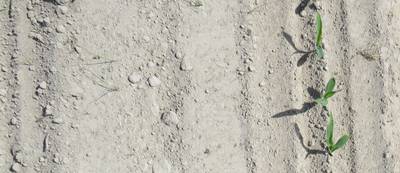
The authors of the WeedMaize dataset conducted their experiments in fields located in Badajoz, Spain (39°1’14.42", -6°3’40.69"). They captured images in April 2020 within maize crops (Zea mays L.M) at V1 and V3 growth stages, without any weed treatment, 10 days prior. Using an “M” trajectory, zenithal images were taken every 2 meters from a height of 1.3 meters. These images featured three weed species (Cyperus rotundus L., Echinochloa crus-galli L., and Solanum nigrum L.) in low-growth stages (Vc and V1 or greater), as well as crop plants (Zea Mays L.). In total, 312 images were manually labeled, including a “Ve” class for unidentified emerging plants. The labeling process involved the use of LabelImg software, and the data was saved in PascalVOC format.
A Canon PowerShot SX540 HS camera with a resolution of 5184 px X 3886 px was used, with a shutter speed of 1/1000 and automatic ISO calibration to maintain image quality under changing lighting conditions. The images represented various configurations, including weeds within and between crop lines, with significant overlap between weeds and maize plants, especially those in the V3 growth stages.
Here is how EPPO codes for plants generally work: codes consist of 5 letters = 3 (genus) + 2 (species). For example, Alopecurus myosuroides -> ALOMY. More information on that here
Plant labels include SOLNI_Vc for Solanum nigrum L. at the embryonic stage, SOLNI for more developed Solanum nigrum L. plants, CYPRO_min for multi-leaf Cyperus rotundus L. plants with center-focused bounding boxes, CYPRO for single-leaf Cyperus rotundus L. plants (>V1), ECHCG for Echinochloa crus galli L., and ZEAMX for Zea mays L. plants.
The dataset was split as follows: 70% of the images formed the train_set, while the remaining 30% comprised the validation_set. Additionally, a random sample of 30% of the training set images constituted the test_set, used to assess training progress. Training and validation (including testing) were performed using a GeForce GTX 1080 GPU, but due to GPU limitations, image sizes had to be reduced. This reduction involved scanning each image to generate 74 smaller sub-images, with parameters set as follows: width 3886 px, height 1926 px, and an overlap of 1900 px. The corresponding XML files defining plant labels were adjusted accordingly for each sub-image.
During scanning, some bounding boxes near the sub-image edges might have been cut, resulting in incomplete data. To ensure data integrity, these boxes were eliminated from training. The chosen large overlap during scanning ensured that if a plant was removed due to touching the edge, it would appear in the next sub-image, ensuring all plants had labels in the training set. After scanning the three image groups (training, test, and validation sets), 4368 training sub-images, 2181 validation sub-images, and 1310 test sub-images were obtained. Sub-images without bounding boxes were removed, and labeling errors were corrected by experts through visual examination. The final data set consists of 7859 sub-images with 60436 bounding boxes.
 Homepage
 Conference Proceedings
Summary #
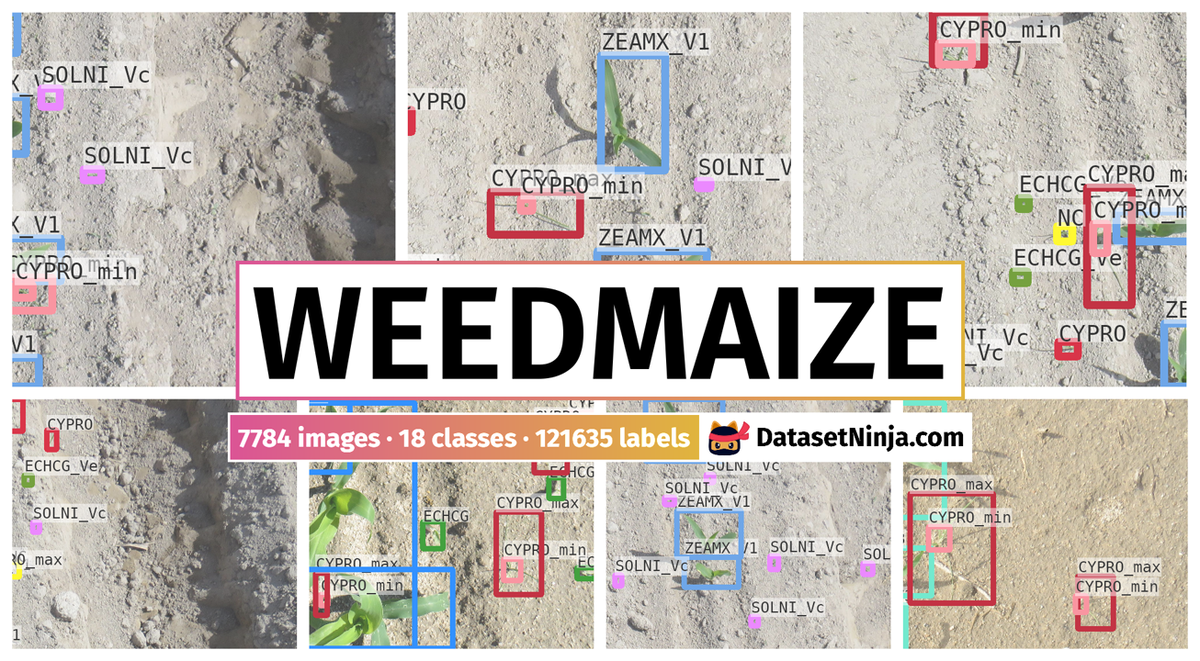
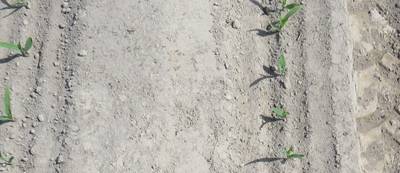
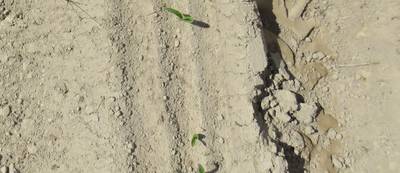
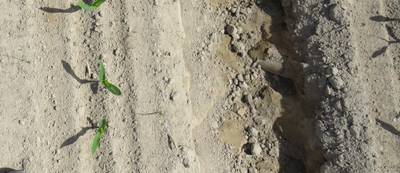
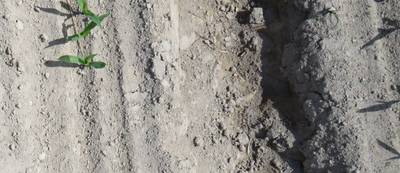
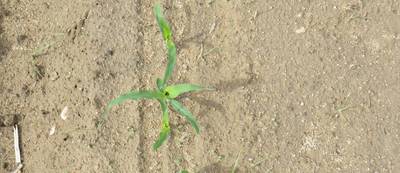
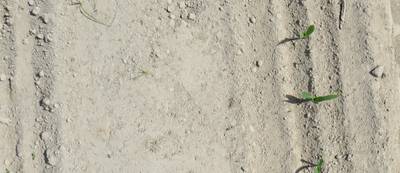
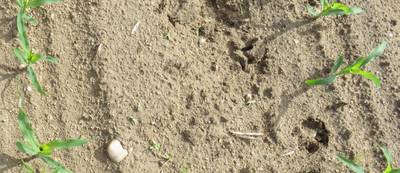
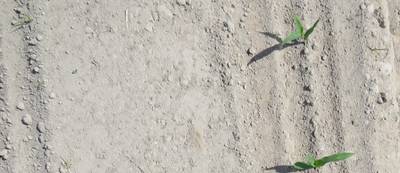
WeedMaize is a dataset for an object detection task. It is used in the agricultural industry.
The dataset consists of 7784 images with 121635 labeled objects belonging to 18 different classes including CYPRO_max, CYPRO_min, CYPRO, and other: ZEAMX_V1, NC, SOLNI_Vc, ECHCG_Ve, ZEAMX_V3, ECHCG, SOLNI_V1, ZEAMX_V4, ZEAMX, ECHCG_V2, OE, ECHCG_V1, POROL, SOLNI_V2, and SOLNI.
Images in the WeedMaize dataset have bounding box annotations. All images are labeled (i.e. with annotations). There are 3 splits in the dataset: train_set (4368 images), test_set (2184 images), and validation_set (1232 images). The dataset was released in 2021 by the Universidad Politécnica de Madrid, Spain.
Explore #
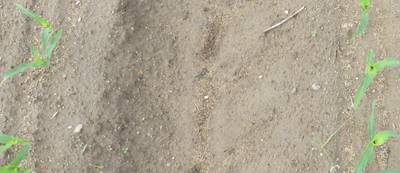
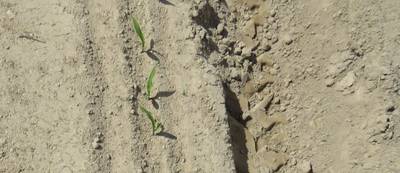
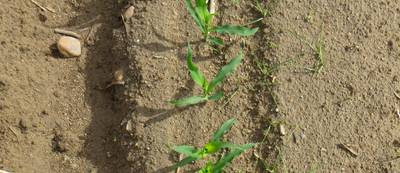
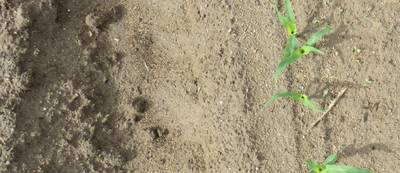
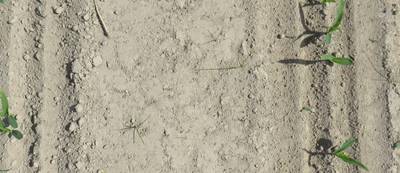
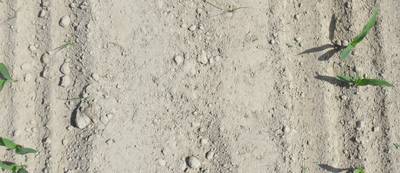
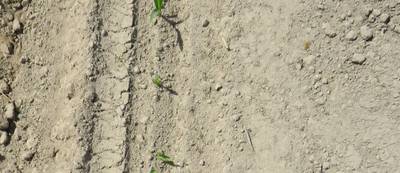
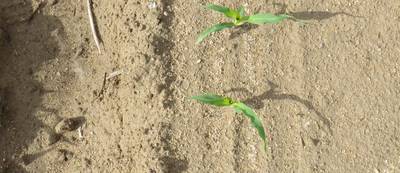
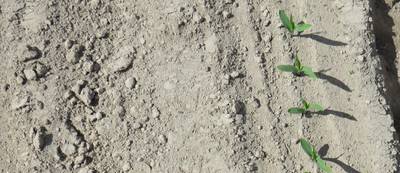
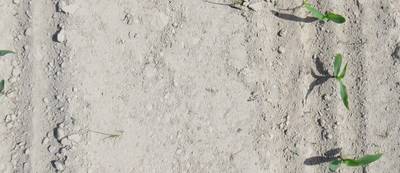
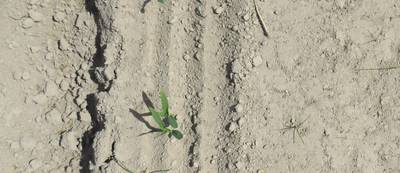
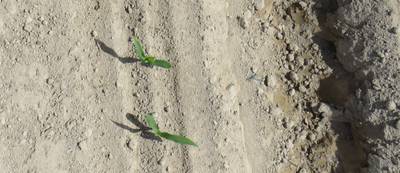
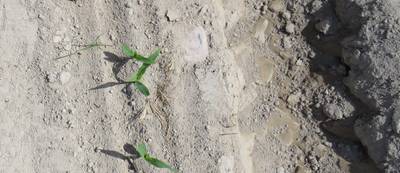
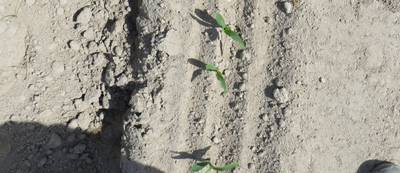
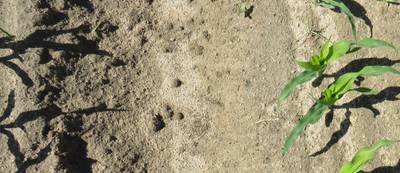
WeedMaize dataset has 7784 images. Click on one of the examples below or open "Explore" tool anytime you need to view dataset images with annotations. This tool has extended visualization capabilities like zoom, translation, objects table, custom filters and more. Hover the mouse over the images to hide or show annotations.


Class balance #
There are 18 annotation classes in the dataset. Find the general statistics and balances for every class in the table below. Click any row to preview images that have labels of the selected class. Sort by column to find the most rare or prevalent classes.

Class ㅤ | Images ㅤ | Objects ㅤ | Count on image average | Area on image average |
|---|---|---|---|---|
CYPRO_max➔ rectangle | 5682 | 16737 | 2.95 | 4.51% |
CYPRO_min➔ rectangle | 5364 | 14121 | 2.63 | 0.42% |
CYPRO➔ rectangle | 5309 | 12064 | 2.27 | 0.6% |
ZEAMX_V1➔ rectangle | 5211 | 22728 | 4.36 | 5.26% |
NC➔ rectangle | 4427 | 11208 | 2.53 | 0.15% |
SOLNI_Vc➔ rectangle | 3967 | 13849 | 3.49 | 0.16% |
ECHCG_Ve➔ rectangle | 2387 | 5404 | 2.26 | 0.08% |
ZEAMX_V3➔ rectangle | 1880 | 8053 | 4.28 | 19.29% |
ECHCG➔ rectangle | 1475 | 5533 | 3.75 | 1% |
SOLNI_V1➔ rectangle | 1266 | 8771 | 6.93 | 0.4% |
Co-occurrence matrix #
Co-occurrence matrix is an extremely valuable tool that shows you the images for every pair of classes: how many images have objects of both classes at the same time. If you click any cell, you will see those images. We added the tooltip with an explanation for every cell for your convenience, just hover the mouse over a cell to preview the description.
Images #
Explore every single image in the dataset with respect to the number of annotations of each class it has. Click a row to preview selected image. Sort by any column to find anomalies and edge cases. Use horizontal scroll if the table has many columns for a large number of classes in the dataset.
Object distribution #
Interactive heatmap chart for every class with object distribution shows how many images are in the dataset with a certain number of objects of a specific class. Users can click cell and see the list of all corresponding images.
Class sizes #
The table below gives various size properties of objects for every class. Click a row to see the image with annotations of the selected class. Sort columns to find classes with the smallest or largest objects or understand the size differences between classes.
Class | Object count | Avg area | Max area | Min area | Min height | Min height | Max height | Max height | Avg height | Avg height | Min width | Min width | Max width | Max width |
|---|---|---|---|---|---|---|---|---|---|---|---|---|---|---|
ZEAMX_V1 rectangle | 22728 | 1.25% | 7.45% | 0.02% | 18px | 1.39% | 566px | 43.67% | 201px | 15.48% | 17px | 0.57% | 656px | 21.87% |
CYPRO_max rectangle | 16737 | 1.6% | 18.22% | 0.01% | 19px | 1.47% | 914px | 70.52% | 216px | 16.63% | 17px | 0.57% | 1022px | 34.07% |
CYPRO_min rectangle | 14121 | 0.16% | 1.67% | 0.01% | 16px | 1.23% | 222px | 17.13% | 74px | 5.74% | 16px | 0.53% | 293px | 9.77% |
SOLNI_Vc rectangle | 13849 | 0.05% | 1.4% | 0.01% | 16px | 1.23% | 290px | 22.38% | 40px | 3.11% | 16px | 0.53% | 279px | 9.3% |
CYPRO rectangle | 12064 | 0.27% | 15.26% | 0.01% | 17px | 1.31% | 823px | 63.5% | 91px | 7.03% | 16px | 0.53% | 1143px | 38.1% |
NC rectangle | 11208 | 0.06% | 3.38% | 0.01% | 17px | 1.31% | 449px | 34.65% | 41px | 3.14% | 17px | 0.57% | 305px | 10.17% |
SOLNI_V1 rectangle | 8771 | 0.06% | 1.6% | 0.01% | 17px | 1.31% | 235px | 18.13% | 44px | 3.37% | 17px | 0.57% | 265px | 8.83% |
ZEAMX_V3 rectangle | 8053 | 5.19% | 19.01% | 0.02% | 22px | 1.7% | 1053px | 81.25% | 385px | 29.74% | 20px | 0.67% | 1208px | 40.27% |
ECHCG rectangle | 5533 | 0.27% | 7.2% | 0.01% | 17px | 1.31% | 374px | 28.86% | 90px | 6.92% | 17px | 0.57% | 748px | 24.93% |
ECHCG_Ve rectangle | 5404 | 0.04% | 0.22% | 0.01% | 16px | 1.23% | 93px | 7.18% | 37px | 2.82% | 17px | 0.57% | 119px | 3.97% |
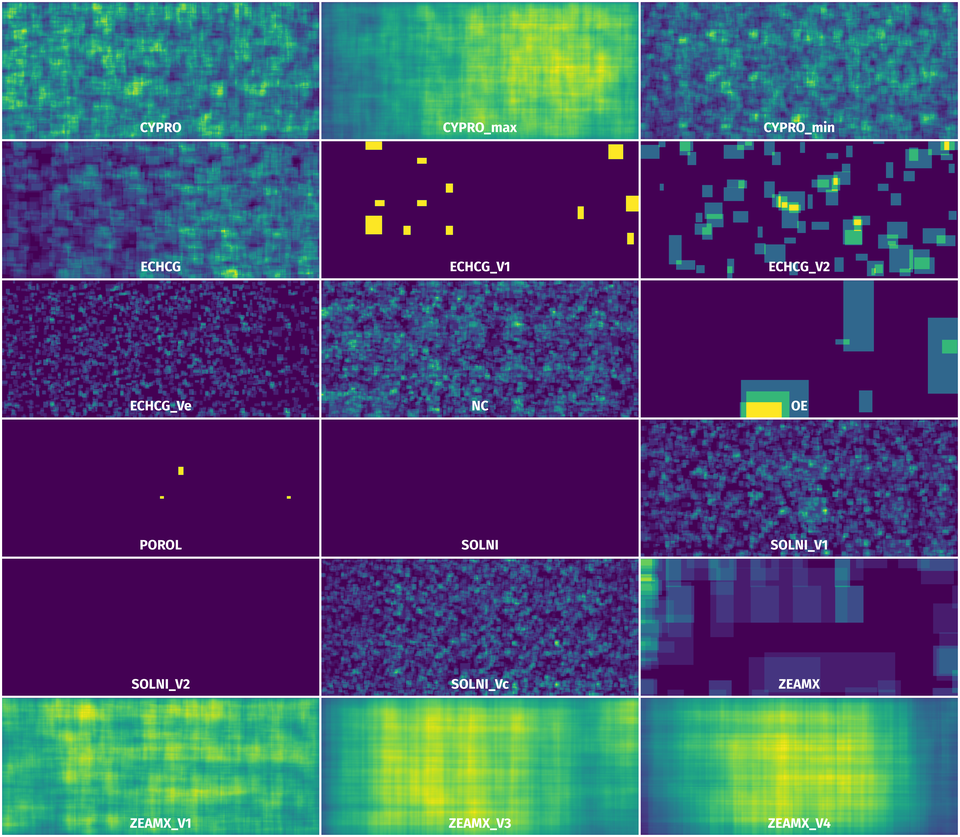
Spatial Heatmap #
The heatmaps below give the spatial distributions of all objects for every class. These visualizations provide insights into the most probable and rare object locations on the image. It helps analyze objects' placements in a dataset.
Objects #
Table contains all 100779 objects. Click a row to preview an image with annotations, and use search or pagination to navigate. Sort columns to find outliers in the dataset.
Object ID ㅤ | Class ㅤ | Image name click row to open | Image size height x width | Height ㅤ | Height ㅤ | Width ㅤ | Width ㅤ | Area ㅤ |
|---|---|---|---|---|---|---|---|---|
1➔ | ZEAMX_V1 rectangle | IMG_1891_13.JPG | 1296 x 3000 | 176px | 13.58% | 437px | 14.57% | 1.98% |
2➔ | ZEAMX_V1 rectangle | IMG_1891_13.JPG | 1296 x 3000 | 232px | 17.9% | 114px | 3.8% | 0.68% |
3➔ | ZEAMX_V1 rectangle | IMG_1891_13.JPG | 1296 x 3000 | 162px | 12.5% | 172px | 5.73% | 0.72% |
4➔ | ZEAMX_V1 rectangle | IMG_1891_13.JPG | 1296 x 3000 | 179px | 13.81% | 168px | 5.6% | 0.77% |
5➔ | ZEAMX_V1 rectangle | IMG_1891_13.JPG | 1296 x 3000 | 117px | 9.03% | 166px | 5.53% | 0.5% |
6➔ | CYPRO_min rectangle | IMG_1891_13.JPG | 1296 x 3000 | 93px | 7.18% | 53px | 1.77% | 0.13% |
7➔ | NC rectangle | IMG_1891_13.JPG | 1296 x 3000 | 43px | 3.32% | 48px | 1.6% | 0.05% |
8➔ | SOLNI_Vc rectangle | IMG_1891_13.JPG | 1296 x 3000 | 58px | 4.48% | 29px | 0.97% | 0.04% |
9➔ | ECHCG_Ve rectangle | IMG_1891_13.JPG | 1296 x 3000 | 27px | 2.08% | 47px | 1.57% | 0.03% |
10➔ | NC rectangle | IMG_1891_13.JPG | 1296 x 3000 | 24px | 1.85% | 40px | 1.33% | 0.02% |
License #
WeedMaize is under CC BY 4.0 license.
Citation #
If you make use of the WeedMaize data, please cite the following reference:
@dataset{WeedMaize,
  author={JM López Correa and D. Andújar, M and Todeschini, J. Karouta and JM Begochea and Ribeiro A},
  title={WeedMaize},
  year={2021},
  url={https://doi.org/10.5281/zenodo.5106795}
}
If you are happy with Dataset Ninja and use provided visualizations and tools in your work, please cite us:
@misc{ visualization-tools-for-weedmaize-dataset,
  title = { Visualization Tools for WeedMaize Dataset },
  type = { Computer Vision Tools },
  author = { Dataset Ninja },
  howpublished = { \url{ https://datasetninja.com/weedmaize } },
  url = { https://datasetninja.com/weedmaize },
  journal = { Dataset Ninja },
  publisher = { Dataset Ninja },
  year = { 2026 },
  month = { jul },
  note = { visited on 2026-07-16 },
}
Download #
Dataset WeedMaize can be downloaded in Supervisely format:
As an alternative, it can be downloaded with dataset-tools package:
pip install --upgrade dataset-tools
… using following python code:
import dataset_tools as dtools

dtools.download(dataset='WeedMaize', dst_dir='~/dataset-ninja/')
Make sure not to overlook the python code example available on the Supervisely Developer Portal. It will give you a clear idea of how to effortlessly work with the downloaded dataset.
The data in original format can be downloaded here:
Disclaimer #
Our gal from the legal dep told us we need to post this:
Dataset Ninja provides visualizations and statistics for some datasets that can be found online and can be downloaded by general audience. Dataset Ninja is not a dataset hosting platform and can only be used for informational purposes. The platform does not claim any rights for the original content, including images, videos, annotations and descriptions. Joint publishing is prohibited.
You take full responsibility when you use datasets presented at Dataset Ninja, as well as other information, including visualizations and statistics we provide. You are in charge of compliance with any dataset license and all other permissions. You are required to navigate datasets homepage and make sure that you can use it. In case of any questions, get in touch with us at hello@datasetninja.com.