Introduction #
The Wildtrack: Multi-Camera Person Dataset brings multi-camera detection and tracking methods into the wild. It meets the need of the deep learning methods for a large-scale multi-camera dataset of walking pedestrians, where the cameras’ fields of view in large part overlap. Being acquired by current high tech hardware it provides HD resolution data. Further, its high precision joint calibration and synchronization shall allow for development of new algorithms that go beyond what is possible with currently available datasets.
Motivation
Pedestrian detection is a crucial problem within computer vision research, representing a specialized subset of object detection. However, the task’s complexity arises from the diverse appearances of individuals and the critical need for high accuracy, particularly in applications like autonomous vehicle navigation. Consequently, pedestrian detection has evolved into a distinct field, garnering extensive research attention and spawning various algorithms with broad applications beyond their original scope.
Despite significant advancements, particularly with the integration of deep learning methods, current monocular detectors still face limitations, particularly in heavily occluded scenarios. This constraint is understandable given the inherent ambiguity in identifying individuals under such conditions, solely relying on single-camera observations. Genuinely, multi-camera detectors come at hand. Important research body in the past decade has also been devoted on this topic. In general, simple averaging of the per-view predictions, can only improve upon a single view detector. Further, more sophisticated methods jointly make use of the information to yield a prediction.
Dataset description
The dataset was acquired using seven high-tech statically positioned cameras with overlapping fields of view. Precisely, three GoPro Hero 4 and four GoPro Hero 3 cameras were used.
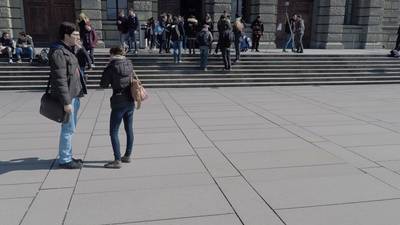
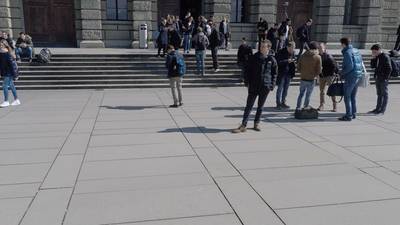
Synchronized corresponding frames from the seven views.
The data acquisition took place in front of the main building of ETH Zurich, Switzerland, during nice weather conditions. The sequences are of resolution 1920×1080 pixels, shot at 60 frames per second. The camera layout is such that their fields of view overlap in large part. As can be noticed, the height of the positions of the cameras is above humans’ average height. To obtain the illustration the authors pre-define an area of interest, and discretize it into a regular grid of points each defining a position. For each position they sum the cameras for which it is visible. The normalized values are then displayed, where the darker the filling color of a cell is the higher the number of such cameras is. The authors see that in large part the fields of view between the cameras overlap. Precisely, in the illustration they considered 1440×480 grid. Out of the total of 10800 positions, 77, 2489, 2466, 1662, 1711, 2066, 329, are simultaneously visible to 1, 2, . . . , 7 views, respectively. On average, each position is seen from 3.92 cameras.
Top view visualisation of the amount of overlap between the cameras’ fields of view. Each cell represents a position, and the darker it is coloured the more visible it is from different cameras.
The sequences were initially synchronised with a 50 ms accuracy, what was further refined by detailed manual inspection.
Illustration of the camera calibration precision. Best seen in color: blue - clicked points; red - projection of the intersection of the two clicked points. Note that the authors omit one of the views, since the considered point is occluded in it.
Currently, the initial 2000 frames, extracted from videos with a frame rate of 10fps, are undergoing annotation. This annotation process operates at a frame rate of 2fps, meaning that out of the aforementioned extracted frames, every fifth frame has been annotated. Consequently, a total of 400 frames have been annotated. There are 8725 multi-view annotations in total.
Multiview examples of our dataset. Each row represents a single positive multi-view annotation.
Calibration of the cameras
Camera calibration involves determining both the extrinsic and intrinsic parameters of a camera. The extrinsic parameters establish a rigid mapping from 3D world coordinates to the camera’s 3D coordinates, while the intrinsic parameters, also known as projective transformation, entail identifying the optimal parameters to construct a projection model that relates 2D image points to 3D scene points. In the authors setup, all seven cameras remain static. Unlike existing multi-camera datasets, their focus lies in achieving joint camera calibration with utmost accuracy. This entails calibrating the cameras in such a way that a specific point in 3D space, visible within certain camera fields of view, appears at the expected 2D location—similar to how a human observer would perceive it. This goal doesn’t necessarily align with obtaining individually accurate per-camera calibration. Since a 2D point from a single camera may ambiguously map to 3D space, the obtained parameters may not address this ambiguity.
Summary #
Wildtrack: Multi-Camera Person Dataset is a dataset for an object detection task. It is used in the surveillance industry.
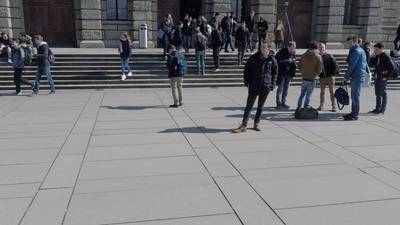
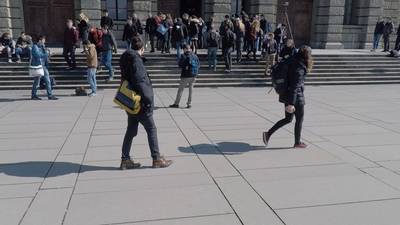
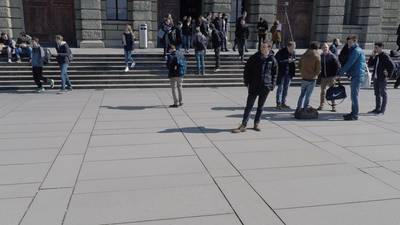
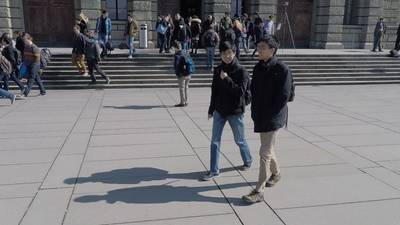
The dataset consists of 2807 images with 42721 labeled objects belonging to 1 single class (pedestrian).
Images in the Wildtrack dataset have bounding box annotations. There are 7 (0% of the total) unlabeled images (i.e. without annotations). There are no pre-defined train/val/test splits in the dataset. Alternatively, the dataset could be split into 7 cameras: camera 1 (401 images), camera 2 (401 images), camera 3 (401 images), camera 4 (401 images), camera 5 (401 images), camera 6 (401 images), and camera 7 (401 images). Additionally, every label contains information about person id, and position id. Explore it in supervisely labeling tool. The dataset was released in 2017 by the Idiap Research Institute, Switzerland, Ecole Polytechnique Federale de Lausanne, Switzerland, and ETH Zurich, Switzerland.

Explore #
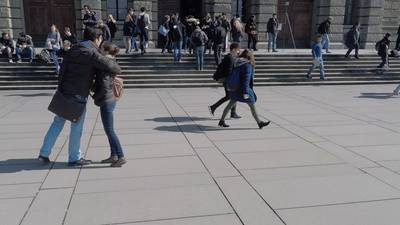
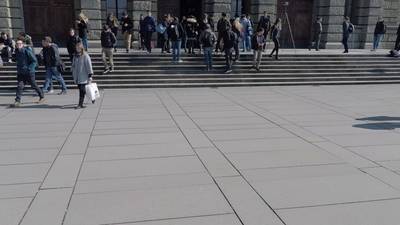
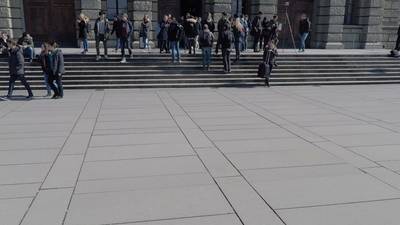
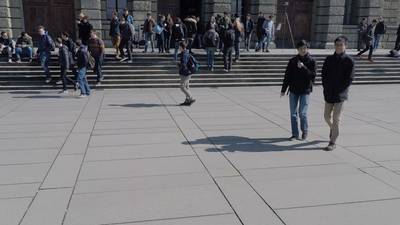
Wildtrack dataset has 2807 images. Click on one of the examples below or open "Explore" tool anytime you need to view dataset images with annotations. This tool has extended visualization capabilities like zoom, translation, objects table, custom filters and more. Hover the mouse over the images to hide or show annotations.







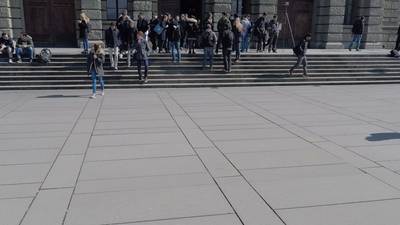


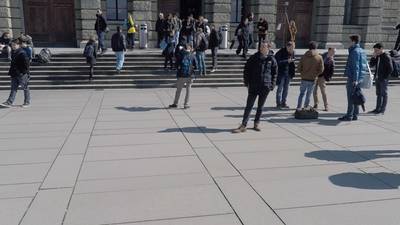


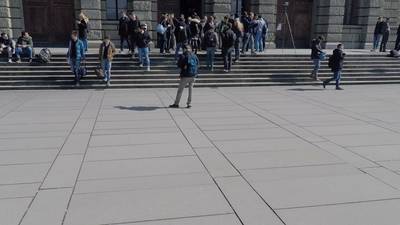


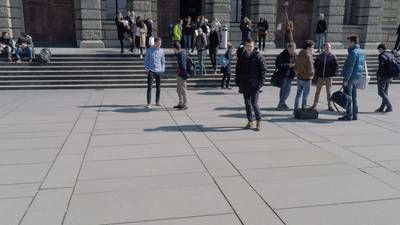


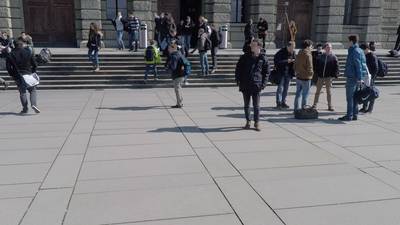

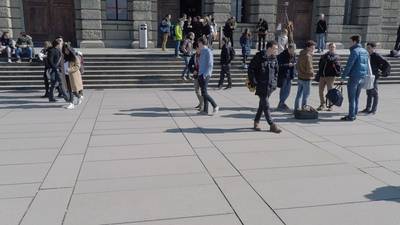


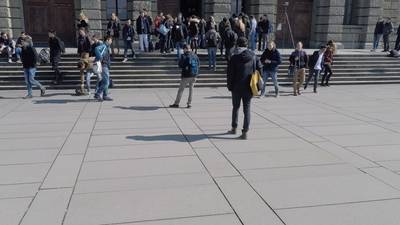

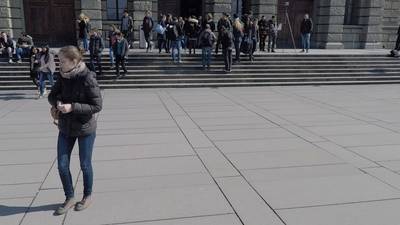









Class balance #
There are 1 annotation classes in the dataset. Find the general statistics and balances for every class in the table below. Click any row to preview images that have labels of the selected class. Sort by column to find the most rare or prevalent classes.
Class ㅤ | Images ㅤ | Objects ㅤ | Count on image average | Area on image average |
|---|---|---|---|---|
pedestrian➔ rectangle | 2800 | 42721 | 15.26 | 15.6% |
Images #
Explore every single image in the dataset with respect to the number of annotations of each class it has. Click a row to preview selected image. Sort by any column to find anomalies and edge cases. Use horizontal scroll if the table has many columns for a large number of classes in the dataset.
Object distribution #
Interactive heatmap chart for every class with object distribution shows how many images are in the dataset with a certain number of objects of a specific class. Users can click cell and see the list of all corresponding images.
Class sizes #
The table below gives various size properties of objects for every class. Click a row to see the image with annotations of the selected class. Sort columns to find classes with the smallest or largest objects or understand the size differences between classes.
Class | Object count | Avg area | Max area | Min area | Min height | Min height | Max height | Max height | Avg height | Avg height | Min width | Min width | Max width | Max width |
|---|---|---|---|---|---|---|---|---|---|---|---|---|---|---|
pedestrian rectangle | 42721 | 1.29% | 25.39% | 0.02% | 19px | 1.76% | 1038px | 96.11% | 262px | 24.22% | 3px | 0.16% | 635px | 33.07% |
Spatial Heatmap #
The heatmaps below give the spatial distributions of all objects for every class. These visualizations provide insights into the most probable and rare object locations on the image. It helps analyze objects' placements in a dataset.

Objects #
Table contains all 42721 objects. Click a row to preview an image with annotations, and use search or pagination to navigate. Sort columns to find outliers in the dataset.
Object ID ㅤ | Class ㅤ | Image name click row to open | Image size height x width | Height ㅤ | Height ㅤ | Width ㅤ | Width ㅤ | Area ㅤ |
|---|---|---|---|---|---|---|---|---|
1➔ | pedestrian rectangle | C5_00001325.png | 1080 x 1920 | 342px | 31.67% | 71px | 3.7% | 1.17% |
2➔ | pedestrian rectangle | C5_00001325.png | 1080 x 1920 | 394px | 36.48% | 137px | 7.14% | 2.6% |
3➔ | pedestrian rectangle | C5_00001325.png | 1080 x 1920 | 229px | 21.2% | 82px | 4.27% | 0.91% |
4➔ | pedestrian rectangle | C5_00001325.png | 1080 x 1920 | 451px | 41.76% | 121px | 6.3% | 2.63% |
5➔ | pedestrian rectangle | C5_00001325.png | 1080 x 1920 | 361px | 33.43% | 129px | 6.72% | 2.25% |
6➔ | pedestrian rectangle | C5_00001325.png | 1080 x 1920 | 343px | 31.76% | 109px | 5.68% | 1.8% |
7➔ | pedestrian rectangle | C5_00001325.png | 1080 x 1920 | 338px | 31.3% | 98px | 5.1% | 1.6% |
8➔ | pedestrian rectangle | C5_00001325.png | 1080 x 1920 | 292px | 27.04% | 73px | 3.8% | 1.03% |
9➔ | pedestrian rectangle | C5_00001325.png | 1080 x 1920 | 240px | 22.22% | 49px | 2.55% | 0.57% |
10➔ | pedestrian rectangle | C5_00001325.png | 1080 x 1920 | 376px | 34.81% | 115px | 5.99% | 2.09% |
License #
The Wildtrack: Multi-Camera Person Dataset is publicly available.
Citation #
If you make use of the Wildtrack data, please cite the following reference:
@dataset{Wildtrack,
  author={Tatjana Chavdarova and Pierre Baque and Stephane Bouquet and Andrii Maksai and Cijo Jose and Louis Lettry and Pascal Fua and Luc Van Gool and Francois Fleuret},
  title={Wildtrack: Multi-Camera Person Dataset},
  year={2017},
  url={https://www.kaggle.com/datasets/aryashah2k/large-scale-multicamera-detection-dataset}
}
If you are happy with Dataset Ninja and use provided visualizations and tools in your work, please cite us:
@misc{ visualization-tools-for-wildtrack-dataset,
  title = { Visualization Tools for Wildtrack Dataset },
  type = { Computer Vision Tools },
  author = { Dataset Ninja },
  howpublished = { \url{ https://datasetninja.com/wildtrack } },
  url = { https://datasetninja.com/wildtrack },
  journal = { Dataset Ninja },
  publisher = { Dataset Ninja },
  year = { 2026 },
  month = { feb },
  note = { visited on 2026-02-05 },
}
Download #
Dataset Wildtrack can be downloaded in Supervisely format:
As an alternative, it can be downloaded with dataset-tools package:
pip install --upgrade dataset-tools
… using following python code:
import dataset_tools as dtools

dtools.download(dataset='Wildtrack', dst_dir='~/dataset-ninja/')
Make sure not to overlook the python code example available on the Supervisely Developer Portal. It will give you a clear idea of how to effortlessly work with the downloaded dataset.
The data in original format can be downloaded here.
Disclaimer #
Our gal from the legal dep told us we need to post this:
Dataset Ninja provides visualizations and statistics for some datasets that can be found online and can be downloaded by general audience. Dataset Ninja is not a dataset hosting platform and can only be used for informational purposes. The platform does not claim any rights for the original content, including images, videos, annotations and descriptions. Joint publishing is prohibited.
You take full responsibility when you use datasets presented at Dataset Ninja, as well as other information, including visualizations and statistics we provide. You are in charge of compliance with any dataset license and all other permissions. You are required to navigate datasets homepage and make sure that you can use it. In case of any questions, get in touch with us at hello@datasetninja.com.


