

Introduction #
The author of the Wind Turbine Object Detection from Aerial Imagery dataset has compiled a repository containing aerial images captured over west-central Iowa to detect wind turbines. The dataset is divided into two splits: Training and Validation. The workflow is segmented into three distinct phases: 1. Training, 2. Validation, and 3. Wind Turbine Detection and Localization.
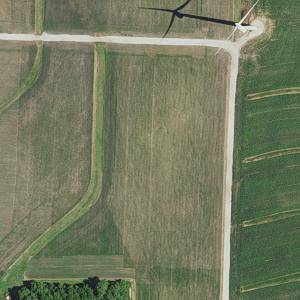
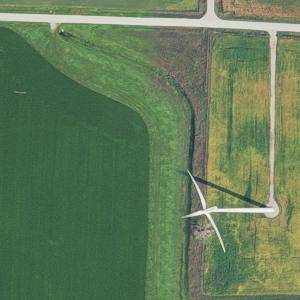
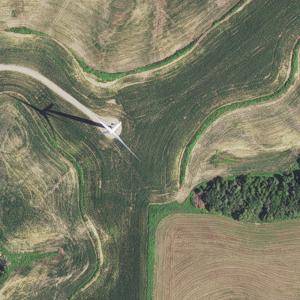
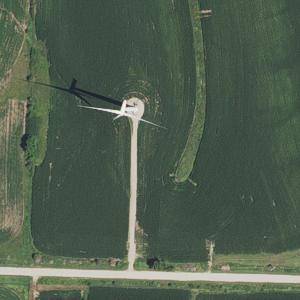
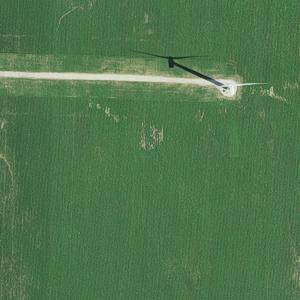
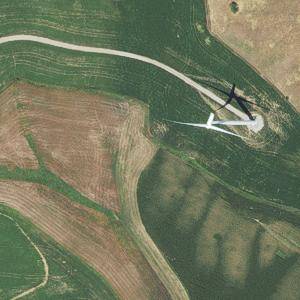
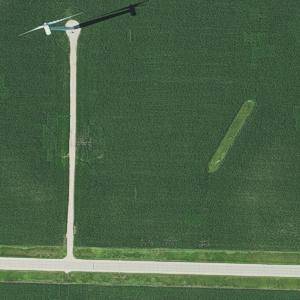
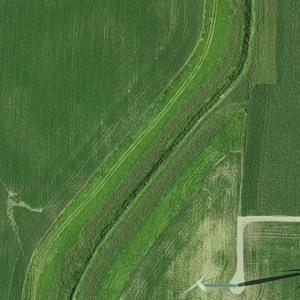
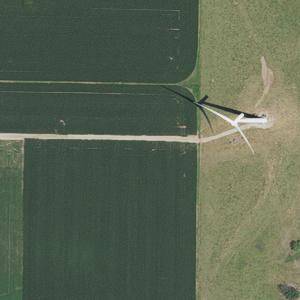
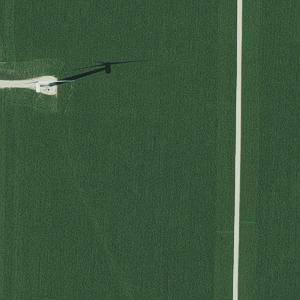
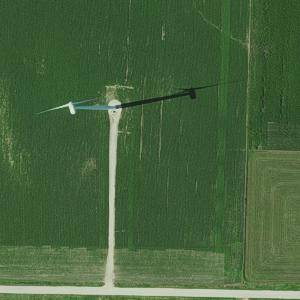
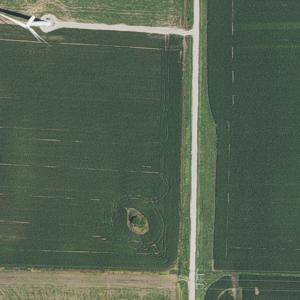
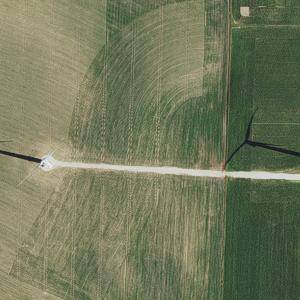
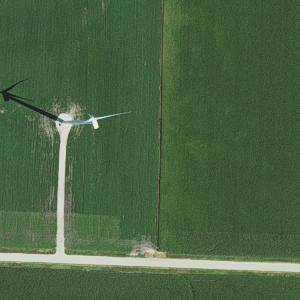
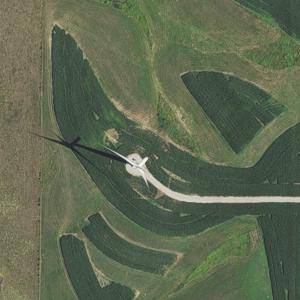
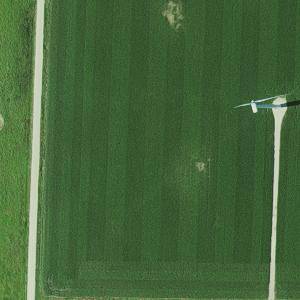
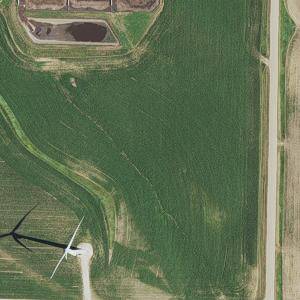
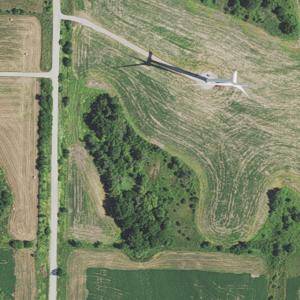
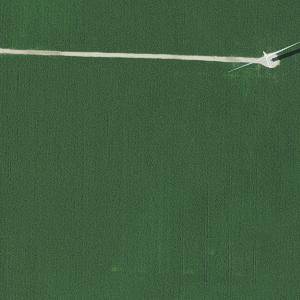
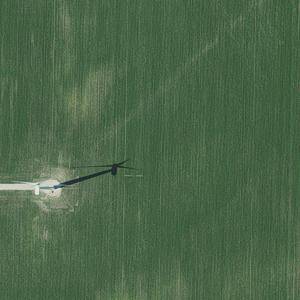
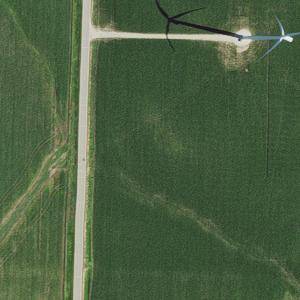
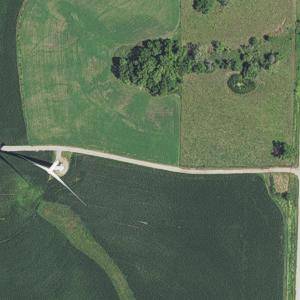
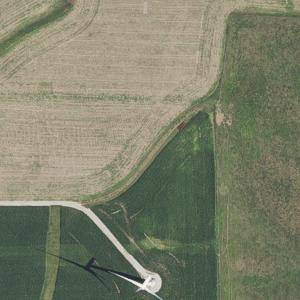
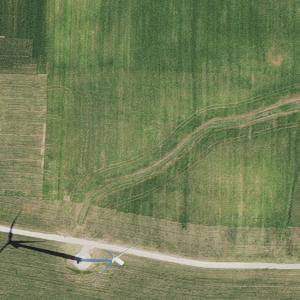
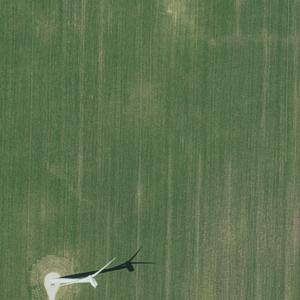
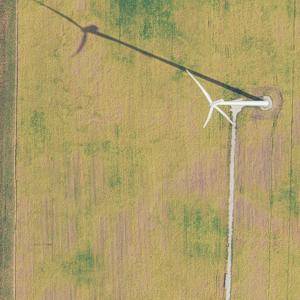
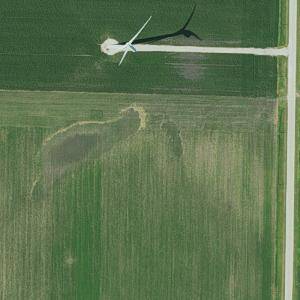
Training: The training process leveraged labeled 300x300 pixel images extracted from the original 5978x7648 pixel aerial images within the National Agriculture Imagery Program (NAIP) database. Every image contained at least one wind turbine, with labeling accomplished through LabelImg. A selection of labeled images is showcased below. In total, 392 images were employed for training, with an additional 80 for testing. This diverse training set encompassed wind turbines varying in capacity, manufacturer, and design.
Validation: A set of unlabeled validation images was meticulously separated from the training and testing datasets to assess the model’s performance. The validation pool comprised 16 images. It’s worth noting that, due to random data and image augmentation during training, validation results can exhibit minor variations across different training runs. Nonetheless, in most cases, default training parameters correctly detected at least 15 out of the 17 wind turbines in the validation image set. While 100% accuracy has been achieved, the inherent randomness in the training process can lead to slight variations in results. Several validation results are provided below for reference.
Wind Turbine Detection and Localization: In the final stage, the trained model is applied to full NAIP images, encompassing an area of approximately 4 miles by 4 miles. To facilitate detection across this expansive region, a sliding window technique is implemented to analyze 300x300 pixel images within the original 5978x7648 pixel images. Following this analysis, markers are plotted on the original NAIP images to indicate the location of each detected wind turbine. Furthermore, the latitude and longitude coordinates for each wind turbine are generated for verification purposes.
 Homepage
Summary #
Wind Turbine Object Detection from Aerial Imagery Using TensorFlow Object Detection API and Google Colab is a dataset for an object detection task. Possible applications of the dataset could be in the energy industry.
The dataset consists of 488 images with 476 labeled objects belonging to 1 single class (wind turbine).
Images in the Wind Turbine Detection (by Luke Borkowski) dataset have bounding box annotations. There are 16 (3% of the total) unlabeled images (i.e. without annotations). There are 3 splits in the dataset: train (392 images), test (80 images), and valid (16 images). The dataset was released in 2019.

Explore #
Wind Turbine Detection (by Luke Borkowski) dataset has 488 images. Click on one of the examples below or open "Explore" tool anytime you need to view dataset images with annotations. This tool has extended visualization capabilities like zoom, translation, objects table, custom filters and more. Hover the mouse over the images to hide or show annotations.


Class balance #
There are 1 annotation classes in the dataset. Find the general statistics and balances for every class in the table below. Click any row to preview images that have labels of the selected class. Sort by column to find the most rare or prevalent classes.

Class ㅤ | Images ㅤ | Objects ㅤ | Count on image average | Area on image average |
|---|---|---|---|---|
wind turbine➔ rectangle | 472 | 476 | 1.01 | 3.18% |
Images #
Explore every single image in the dataset with respect to the number of annotations of each class it has. Click a row to preview selected image. Sort by any column to find anomalies and edge cases. Use horizontal scroll if the table has many columns for a large number of classes in the dataset.
Object distribution #
Interactive heatmap chart for every class with object distribution shows how many images are in the dataset with a certain number of objects of a specific class. Users can click cell and see the list of all corresponding images.
Class sizes #
The table below gives various size properties of objects for every class. Click a row to see the image with annotations of the selected class. Sort columns to find classes with the smallest or largest objects or understand the size differences between classes.
Class | Object count | Avg area | Max area | Min area | Min height | Min height | Max height | Max height | Avg height | Avg height | Min width | Min width | Max width | Max width |
|---|---|---|---|---|---|---|---|---|---|---|---|---|---|---|
wind turbine rectangle | 476 | 3.15% | 9.39% | 0.76% | 17px | 5.67% | 89px | 29.67% | 44px | 14.7% | 18px | 6% | 112px | 37.33% |
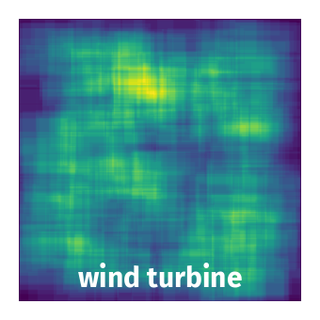
Spatial Heatmap #
The heatmaps below give the spatial distributions of all objects for every class. These visualizations provide insights into the most probable and rare object locations on the image. It helps analyze objects' placements in a dataset.
Objects #
Table contains all 476 objects. Click a row to preview an image with annotations, and use search or pagination to navigate. Sort columns to find outliers in the dataset.
Object ID ㅤ | Class ㅤ | Image name click row to open | Image size height x width | Height ㅤ | Height ㅤ | Width ㅤ | Width ㅤ | Area ㅤ |
|---|---|---|---|---|---|---|---|---|
1➔ | wind turbine rectangle | m_4109450_ne_15_1_20170709_15_20.jpg | 300 x 300 | 48px | 16% | 85px | 28.33% | 4.53% |
2➔ | wind turbine rectangle | m_4109443_sw_15_1_20170721_17_17.jpg | 300 x 300 | 32px | 10.67% | 100px | 33.33% | 3.56% |
3➔ | wind turbine rectangle | m_4109451_nw_15_1_20170721_06_14.jpg | 300 x 300 | 59px | 19.67% | 59px | 19.67% | 3.87% |
4➔ | wind turbine rectangle | m_4209449_sw_15_1_20170701_05_12.jpg | 300 x 300 | 62px | 20.67% | 53px | 17.67% | 3.65% |
5➔ | wind turbine rectangle | m_4209428_nw_15_1_20170707_08_24.jpg | 300 x 300 | 32px | 10.67% | 83px | 27.67% | 2.95% |
6➔ | wind turbine rectangle | m_4109443_sw_15_1_20170721_16_23.jpg | 300 x 300 | 48px | 16% | 72px | 24% | 3.84% |
7➔ | wind turbine rectangle | m_4109450_se_15_1_20170709_11_08.jpg | 300 x 300 | 58px | 19.33% | 60px | 20% | 3.87% |
8➔ | wind turbine rectangle | m_4209449_se_15_1_20170701_05_11.jpg | 300 x 300 | 59px | 19.67% | 70px | 23.33% | 4.59% |
9➔ | wind turbine rectangle | m_4209457_ne_15_1_20170701_12_06.jpg | 300 x 300 | 64px | 21.33% | 46px | 15.33% | 3.27% |
10➔ | wind turbine rectangle | m_4209426_nw_15_1_20170723_19_01.jpg | 300 x 300 | 29px | 9.67% | 61px | 20.33% | 1.97% |
License #
Citation #
If you make use of the Wind Turbine Detection (by Luke Borkowski) data, please cite the following reference:
@dataset{Wind Turbine Detection (by Luke Borkowski),
	author={Luke Borkowski},
	title={Wind Turbine Object Detection from Aerial Imagery Using TensorFlow Object Detection API and Google Colab},
	year={2019},
	url={https://github.com/lbborkowski/wind-turbine-detector}
}
If you are happy with Dataset Ninja and use provided visualizations and tools in your work, please cite us:
@misc{ visualization-tools-for-wind-turbine-object-detection-using-tensorflow-dataset,
  title = { Visualization Tools for Wind Turbine Detection (by Luke Borkowski) Dataset },
  type = { Computer Vision Tools },
  author = { Dataset Ninja },
  howpublished = { \url{ https://datasetninja.com/wind-turbine-object-detection-using-tensorflow } },
  url = { https://datasetninja.com/wind-turbine-object-detection-using-tensorflow },
  journal = { Dataset Ninja },
  publisher = { Dataset Ninja },
  year = { 2026 },
  month = { jul },
  note = { visited on 2026-07-22 },
}
Download #
Dataset Wind Turbine Detection (by Luke Borkowski) can be downloaded in Supervisely format:
As an alternative, it can be downloaded with dataset-tools package:
pip install --upgrade dataset-tools
… using following python code:
import dataset_tools as dtools

dtools.download(dataset='Wind Turbine Detection (by Luke Borkowski)', dst_dir='~/dataset-ninja/')
Make sure not to overlook the python code example available on the Supervisely Developer Portal. It will give you a clear idea of how to effortlessly work with the downloaded dataset.
The data in original format can be downloaded here.
Disclaimer #
Our gal from the legal dep told us we need to post this:
Dataset Ninja provides visualizations and statistics for some datasets that can be found online and can be downloaded by general audience. Dataset Ninja is not a dataset hosting platform and can only be used for informational purposes. The platform does not claim any rights for the original content, including images, videos, annotations and descriptions. Joint publishing is prohibited.
You take full responsibility when you use datasets presented at Dataset Ninja, as well as other information, including visualizations and statistics we provide. You are in charge of compliance with any dataset license and all other permissions. You are required to navigate datasets homepage and make sure that you can use it. In case of any questions, get in touch with us at hello@datasetninja.com.