

Introduction #
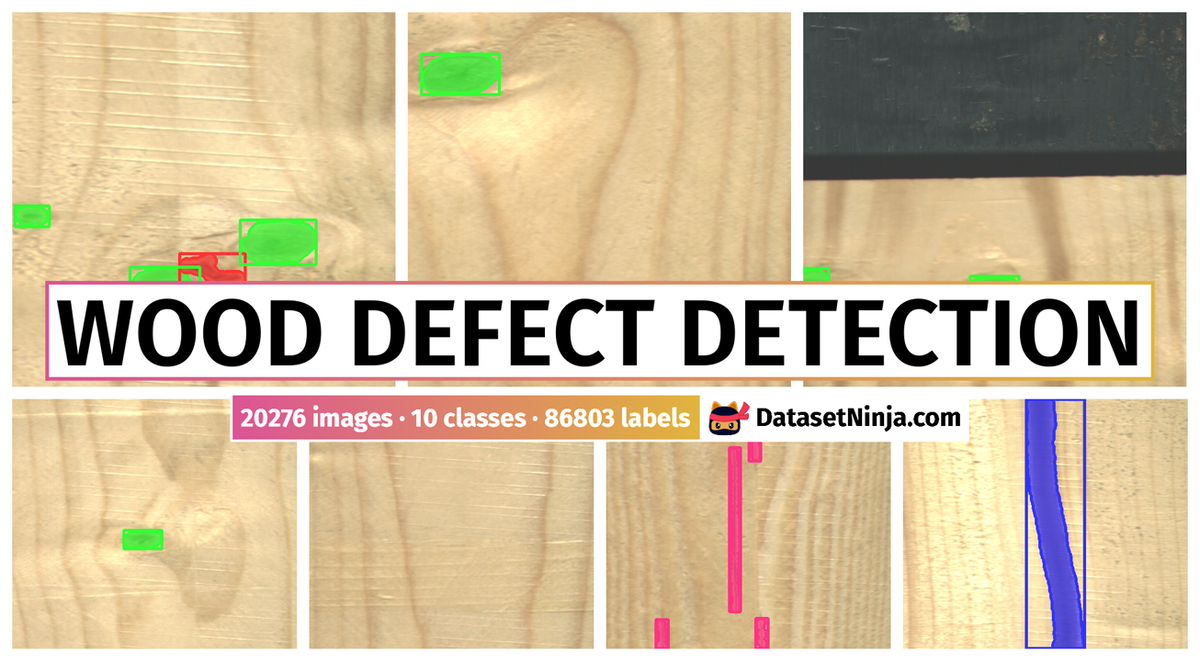
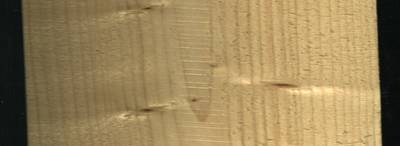
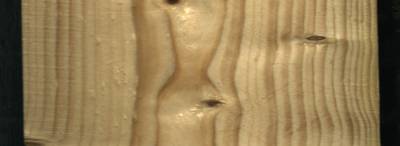
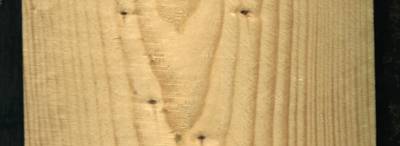
To enhance quality control procedures in the wood industry, the authors of the Wood Defect Detection dataset propose new automated vision-based systems. The dataset encompasses over 43,000 labeled defects found on wood surfaces, encompassing ten different types of the most frequently occurring defects. These include live_knot, dead_knot, knots_with_cracks, crack, resin, marrow, quartzite, missing_knot, blue_stain, and overgrown areas. Each image within the dataset is accompanied by a semantic map and a bounding box label, facilitating both semantic segmentation and localization tasks. Notably, all the data were directly collected from a wood production line as part of the manufacturing process. They highlight the significant variability in raw materials and the intricate manufacturing processes, leading to a diverse range of observable structural defects. These defects require assessment by trained specialists through manual processes that are laborious, subject to bias, and less efficient.
The wood industry’s manufacturing processes influence material utilization and cost efficiency. The complexity and variability of wood materials can result in various defects, affecting both mechanical properties and aesthetic value. Despite increasing automation, many companies rely on trained domain experts for quality grading, with manual inspection often limited by volume and subject to human-related factors. To address this, the authors aim to develop accurate automated systems.
The authors constructed a laboratory setup comprising a conveyor belt, light source, and line scan camera. The camera captured images at a speed of 4 m/s, synchronized with the conveyor belt’s movement. This experiment involved 250 wood veneers, each scanned at a resolution of 4,000 × 3,000 pixels. The resulting dataset contained 4,729 usable images, of which 353 had wood defects. To address the lack of extensive databases in this field, the authors performed an experiment in an industrial environment to acquire authentic data from the production line. To overcome challenges such as high-speed conveyor belts and vibrations, they developed both hardware and software solutions for high-resolution image acquisition. To ensure high-quality images at a speed of 9.6 m/s, the authors employed a trilinear line scan camera and a high-performance Camera Link frame grabber.
Annotation was performed manually, with the authors developing a customizable annotation tool to streamline the process. They created BMP files representing semantic maps of labeled defects, with each zone painted in an image corresponding to a specific defect. The annotation tool automatically generated coordinates for bounding boxes and labels. This large-scale dataset and associated labeling offer a valuable resource for advancing automated wood defect detection and quality control systems.
 Homepage
 Research Paper
Summary #
Supporting Data for Deep Learning and Machine Vision Based Approaches for Automated Wood Defect Detection and Quality Control is a dataset for instance segmentation, semantic segmentation, and object detection tasks. It is used in the wood and manufacturing industries, and in the computer aided quality control domain.
The dataset consists of 20276 images with 86803 labeled objects belonging to 10 different classes including live_knot, dead_knot, resin, and other: knot_with_crack, crack, marrow, quartzite, missing_knot, blue_stain, and overgrown.
Images in the Wood Defect Detection dataset have pixel-level instance segmentation and bounding box annotations. Due to the nature of the instance segmentation task, it can be automatically transformed into a semantic segmentation task (only one mask for every class). There are 1991 (10% of the total) unlabeled images (i.e. without annotations). There are no pre-defined train/val/test splits in the dataset. The dataset was released in 2021 by the VSB TUO, Czech Republic.
Explore #
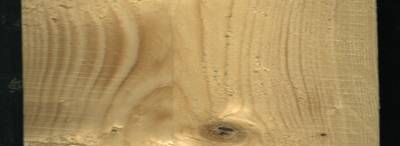
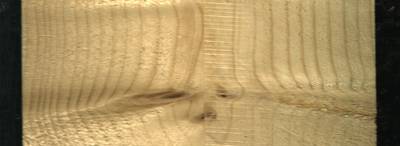
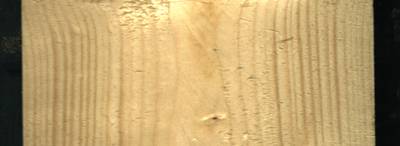
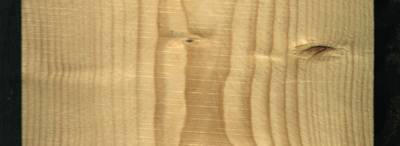
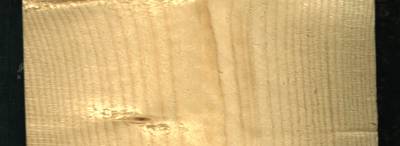
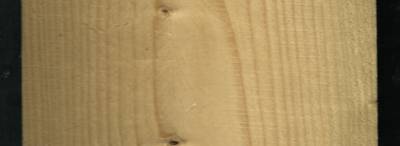
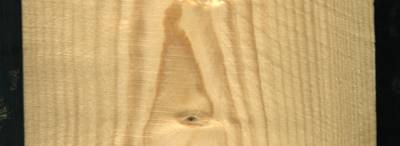
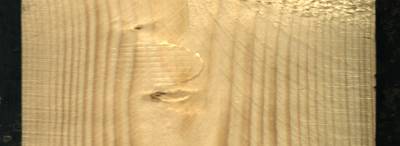
Wood Defect Detection dataset has 20276 images. Click on one of the examples below or open "Explore" tool anytime you need to view dataset images with annotations. This tool has extended visualization capabilities like zoom, translation, objects table, custom filters and more. Hover the mouse over the images to hide or show annotations.


Class balance #
There are 10 annotation classes in the dataset. Find the general statistics and balances for every class in the table below. Click any row to preview images that have labels of the selected class. Sort by column to find the most rare or prevalent classes.

Class ㅤ | Images ㅤ | Objects ㅤ | Count on image average | Area on image average |
|---|---|---|---|---|
Live_knot➔ Unknown | 11913 | 41960 | 3.52 | 1.21% |
Death_know➔ Unknown | 8350 | 23731 | 2.84 | 0.71% |
resin➔ any | 2625 | 6871 | 2.62 | 1.02% |
knot_with_crack➔ any | 1835 | 4380 | 2.39 | 2.59% |
Crack➔ Unknown | 1578 | 4306 | 2.73 | 1.83% |
Marrow➔ Unknown | 1061 | 2347 | 2.21 | 3.01% |
Quartzity➔ Unknown | 847 | 2024 | 2.39 | 5.45% |
Knot_missing➔ Unknown | 478 | 982 | 2.05 | 0.59% |
Blue_stain➔ Unknown | 77 | 192 | 2.49 | 6.84% |
overgrown➔ any | 6 | 10 | 1.67 | 0% |
Co-occurrence matrix #
Co-occurrence matrix is an extremely valuable tool that shows you the images for every pair of classes: how many images have objects of both classes at the same time. If you click any cell, you will see those images. We added the tooltip with an explanation for every cell for your convenience, just hover the mouse over a cell to preview the description.
Images #
Explore every single image in the dataset with respect to the number of annotations of each class it has. Click a row to preview selected image. Sort by any column to find anomalies and edge cases. Use horizontal scroll if the table has many columns for a large number of classes in the dataset.
Object distribution #
Interactive heatmap chart for every class with object distribution shows how many images are in the dataset with a certain number of objects of a specific class. Users can click cell and see the list of all corresponding images.
Class sizes #
The table below gives various size properties of objects for every class. Click a row to see the image with annotations of the selected class. Sort columns to find classes with the smallest or largest objects or understand the size differences between classes.
Class | Object count | Avg area | Max area | Min area | Min height | Min height | Max height | Max height | Avg height | Avg height | Min width | Min width | Max width | Max width |
|---|---|---|---|---|---|---|---|---|---|---|---|---|---|---|
Live_knot Unknown | 41960 | 0.6% | 33.56% | 0% | 1px | 0.1% | 810px | 79.1% | 85px | 8.32% | 1px | 0.04% | 1407px | 50.25% |
Death_know Unknown | 23731 | 0.44% | 22.67% | 0% | 1px | 0.1% | 648px | 63.28% | 75px | 7.31% | 1px | 0.04% | 1288px | 46% |
resin any | 6871 | 0.64% | 29.4% | 0% | 1px | 0.1% | 1024px | 100% | 187px | 18.24% | 2px | 0.07% | 1397px | 49.89% |
knot_with_crack any | 4380 | 1.93% | 10.58% | 0% | 1px | 0.1% | 408px | 39.84% | 156px | 15.26% | 1px | 0.04% | 1022px | 36.5% |
Crack Unknown | 4306 | 0.94% | 12.75% | 0% | 1px | 0.1% | 1024px | 100% | 423px | 41.29% | 1px | 0.04% | 467px | 16.68% |
Marrow Unknown | 2347 | 2.21% | 11.38% | 0% | 1px | 0.1% | 1024px | 100% | 543px | 53.07% | 2px | 0.07% | 518px | 18.5% |
Quartzity Unknown | 2024 | 3.7% | 29.94% | 0% | 1px | 0.1% | 1024px | 100% | 764px | 74.65% | 1px | 0.04% | 895px | 31.96% |
Knot_missing Unknown | 982 | 0.49% | 7.06% | 0% | 1px | 0.1% | 360px | 35.16% | 88px | 8.61% | 1px | 0.04% | 848px | 30.29% |
Blue_stain Unknown | 192 | 4.79% | 19.86% | 0.4% | 121px | 11.82% | 1024px | 100% | 720px | 70.34% | 74px | 2.64% | 634px | 22.64% |
overgrown any | 10 | 0% | 0.01% | 0% | 1px | 0.1% | 15px | 1.46% | 5px | 0.45% | 2px | 0.07% | 17px | 0.61% |
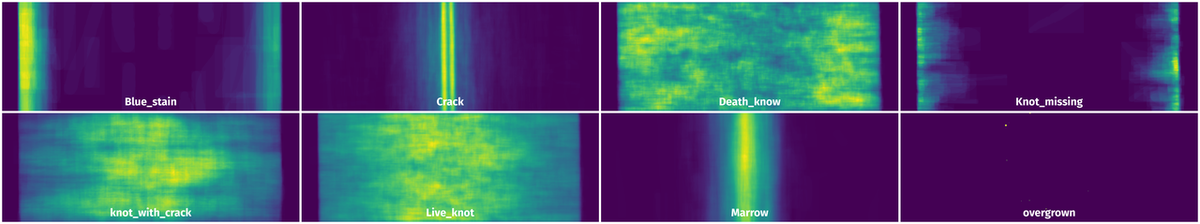
Spatial Heatmap #
The heatmaps below give the spatial distributions of all objects for every class. These visualizations provide insights into the most probable and rare object locations on the image. It helps analyze objects' placements in a dataset.
Objects #
Table contains all 86803 objects. Click a row to preview an image with annotations, and use search or pagination to navigate. Sort columns to find outliers in the dataset.
Object ID ㅤ | Class ㅤ | Image name click row to open | Image size height x width | Height ㅤ | Height ㅤ | Width ㅤ | Width ㅤ | Area ㅤ |
|---|---|---|---|---|---|---|---|---|
1➔ | knot_with_crack any | 101600016.bmp | 1024 x 2800 | 145px | 14.16% | 321px | 11.46% | 1.32% |
2➔ | knot_with_crack any | 101600016.bmp | 1024 x 2800 | 147px | 14.36% | 322px | 11.5% | 1.65% |
3➔ | Live_knot Unknown | 131000033.bmp | 1024 x 2800 | 31px | 3.03% | 108px | 3.86% | 0.1% |
4➔ | resin any | 131000033.bmp | 1024 x 2800 | 157px | 15.33% | 79px | 2.82% | 0.25% |
5➔ | resin any | 131000033.bmp | 1024 x 2800 | 157px | 15.33% | 79px | 2.82% | 0.43% |
6➔ | Live_knot Unknown | 131000033.bmp | 1024 x 2800 | 33px | 3.22% | 108px | 3.86% | 0.12% |
7➔ | Live_knot Unknown | 172100044.bmp | 1024 x 2800 | 82px | 8.01% | 137px | 4.89% | 0.32% |
8➔ | Live_knot Unknown | 172100044.bmp | 1024 x 2800 | 83px | 8.11% | 137px | 4.89% | 0.4% |
9➔ | Live_knot Unknown | 150600016.bmp | 1024 x 2800 | 86px | 8.4% | 86px | 3.07% | 0.2% |
10➔ | Live_knot Unknown | 150600016.bmp | 1024 x 2800 | 88px | 8.59% | 88px | 3.14% | 0.27% |
License #
Citation #
If you make use of the Wood Defect Detection data, please cite the following reference:
@dataset{kodytek_pavel_2021_4694695,
  author       = {Kodytek Pavel and
                  Bodzas Alexandra and
                  Bilik Petr},
  title        = {{Supporting data for Deep Learning and Machine
                   Vision based approaches for automated wood defect
                   detection and quality control.}},
  month        = apr,
  year         = 2021,
  publisher    = {Zenodo},
  doi          = {10.5281/zenodo.4694695},
  url          = {https://doi.org/10.5281/zenodo.4694695}
}
If you are happy with Dataset Ninja and use provided visualizations and tools in your work, please cite us:
@misc{ visualization-tools-for-wood-defect-detection-dataset,
  title = { Visualization Tools for Wood Defect Detection Dataset },
  type = { Computer Vision Tools },
  author = { Dataset Ninja },
  howpublished = { \url{ https://datasetninja.com/wood-defect-detection } },
  url = { https://datasetninja.com/wood-defect-detection },
  journal = { Dataset Ninja },
  publisher = { Dataset Ninja },
  year = { 2026 },
  month = { jul },
  note = { visited on 2026-07-23 },
}
Download #
Dataset Wood Defect Detection can be downloaded in Supervisely format:
As an alternative, it can be downloaded with dataset-tools package:
pip install --upgrade dataset-tools
… using following python code:
import dataset_tools as dtools

dtools.download(dataset='Wood Defect Detection', dst_dir='~/dataset-ninja/')
Make sure not to overlook the python code example available on the Supervisely Developer Portal. It will give you a clear idea of how to effortlessly work with the downloaded dataset.
The data in original format can be downloaded here:
Disclaimer #
Our gal from the legal dep told us we need to post this:
Dataset Ninja provides visualizations and statistics for some datasets that can be found online and can be downloaded by general audience. Dataset Ninja is not a dataset hosting platform and can only be used for informational purposes. The platform does not claim any rights for the original content, including images, videos, annotations and descriptions. Joint publishing is prohibited.
You take full responsibility when you use datasets presented at Dataset Ninja, as well as other information, including visualizations and statistics we provide. You are in charge of compliance with any dataset license and all other permissions. You are required to navigate datasets homepage and make sure that you can use it. In case of any questions, get in touch with us at hello@datasetninja.com.