Introduction #
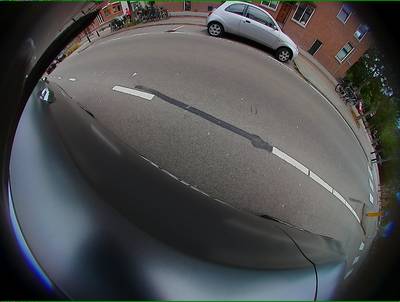
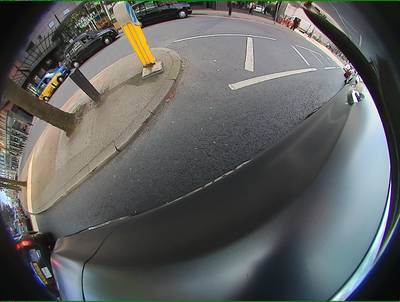
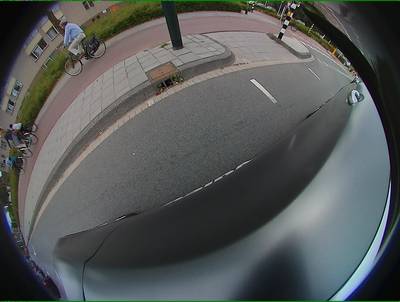
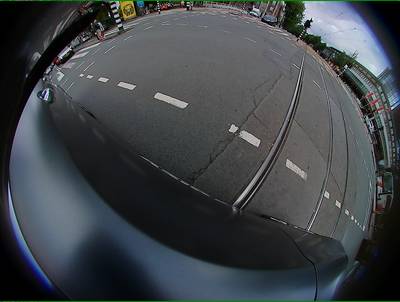
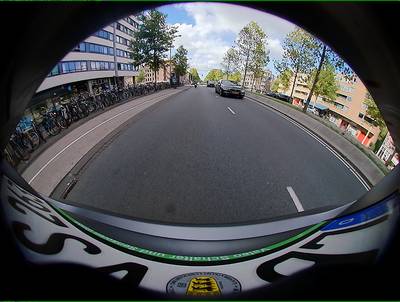
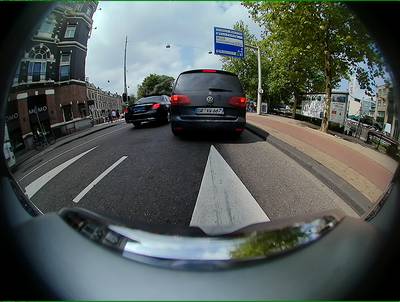
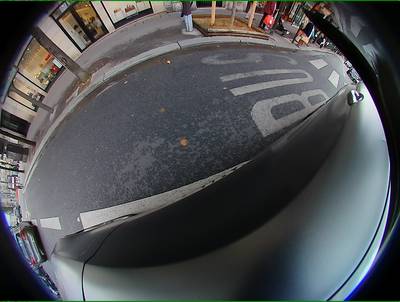
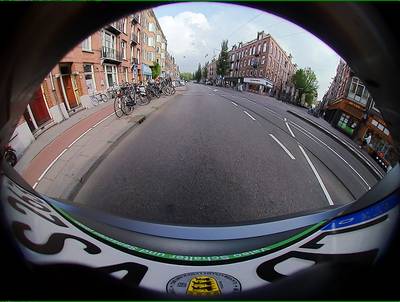
The authors of the RGB Fisheye part of a larger WoodScape dataset introduce a comprehensive fisheye automotive dataset, designed to facilitate detailed evaluations of computer vision algorithms on fisheye images. This dataset includes four surround-view cameras and addresses nine tasks, including segmentation, depth estimation, 3D bounding box detection, and soiling detection. It offers semantic annotation for over 10,000 images and annotations for other tasks for over 100,000 images. The dataset encourages the community to develop vision algorithms natively on fisheye images, avoiding naive rectification.
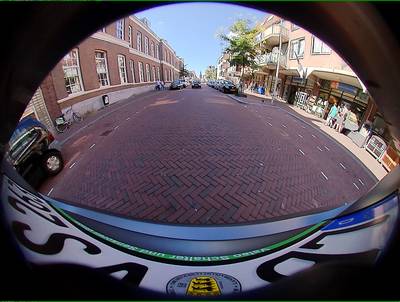
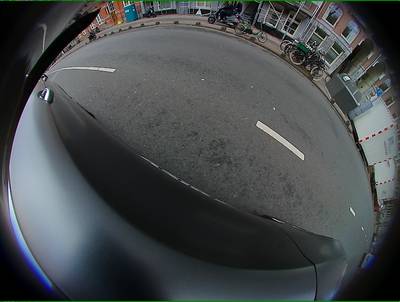
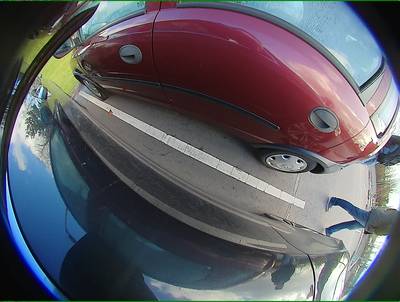
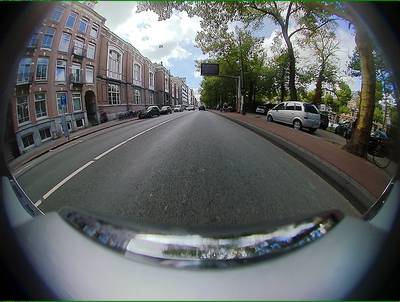
The full dataset contains four cameras covering 360° accompanied by a HD laser canner, IMU and GNSS. Annotations are made available for nine tasks, notably 3D object detection, depth estimation (overlaid on front camera) and semantic segmentation as illustrated here.
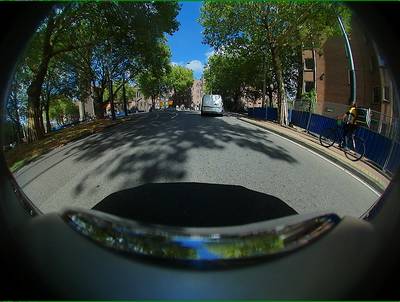
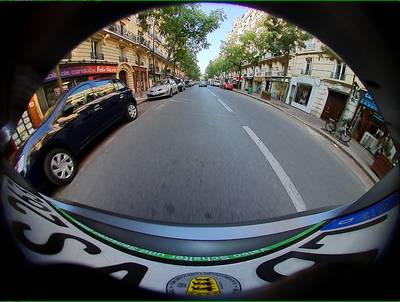
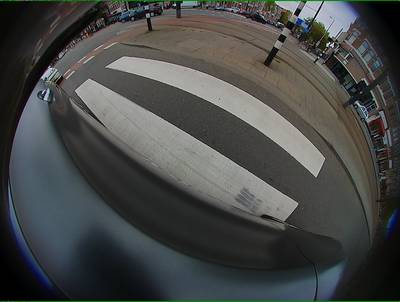
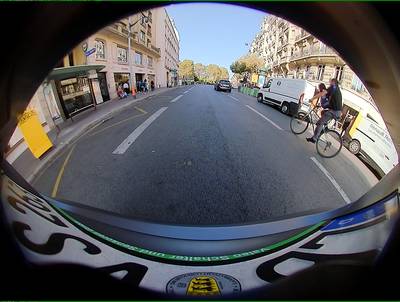
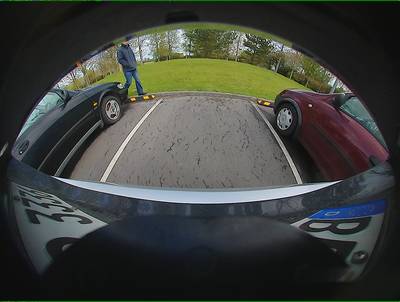
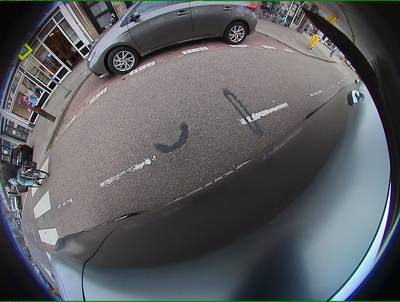
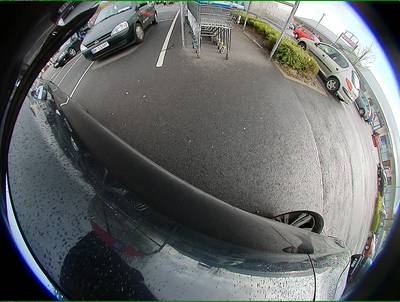
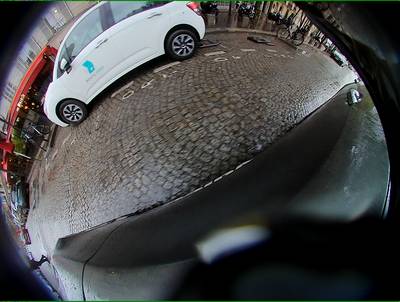
Fisheye lenses, known for their non-linear mapping and large field of view, introduce radial distortion but are valuable for applications like automotive low-speed maneuvering. The term “fisheye” was coined by Robert Wood in 1906, who invented the fisheye camera. As a homage to Wood, the dataset is named WoodScape.
The high-level goals of the dataset include promoting the development of vision algorithms on fisheye images without undistortion, providing data for multi-camera scenarios, and facilitating multi-task learning for autonomous driving vision tasks. WoodScape originates from three geographical locations, including the USA, Europe, and China, and involves various driving scenarios and sensor configurations. The dataset includes RGB fisheye cameras, a LiDAR, GNSS/IMU systems, and odometry signals.
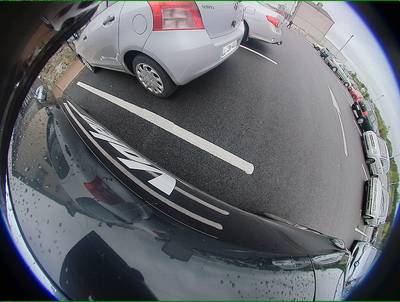
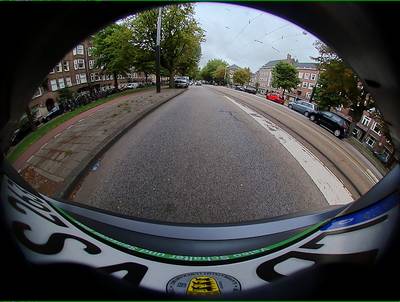
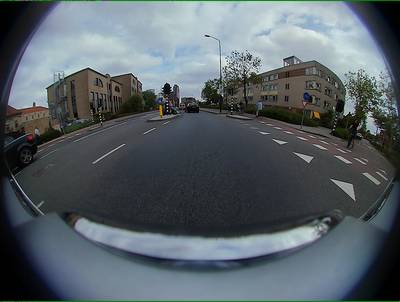
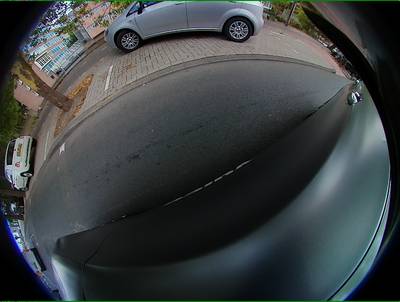
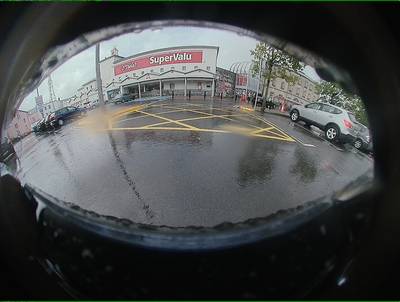
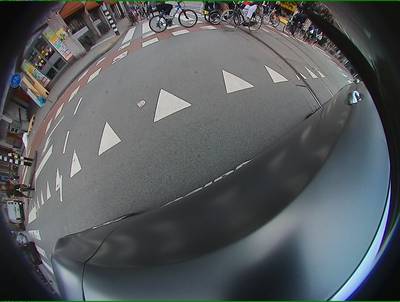
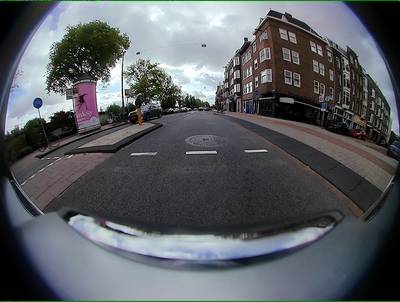
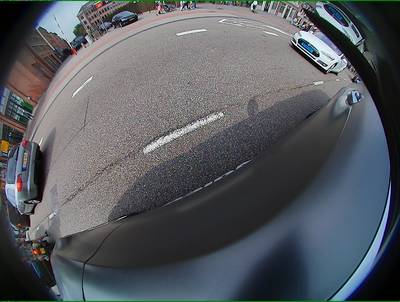
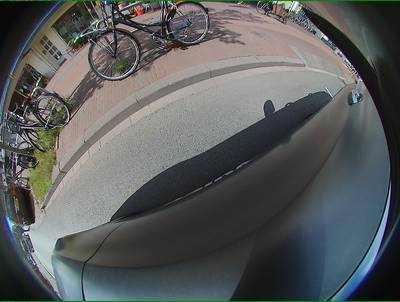
Sample images from the surround-view camera network showing wide field of view and 360° coverage.
WoodScape provides labels for multiple autonomous driving tasks, such as semantic segmentation, monocular depth estimation, object detection, visual odometry, visual SLAM, motion segmentation, soiling detection, and end-to-end driving. The dataset is compared with other popular datasets in terms of properties, highlighting its uniqueness and extensive task coverage.
Dataset Acquisition
The dataset has the diverse origin of data, intrinsic and extrinsic calibrations, and quality checks. The dataset offers images at a resolution of 1MPx with 24-bit depth, and videos that are uncompressed, running at 30 frames per second, with lengths varying from 30 to 120 seconds. Additionally, the dataset includes synthetic data created using precise models of the actual cameras, which allows for the exploration of extra tasks.
The camera is equipped with a High Dynamic Range (HDR) sensor that operates on a rolling shutter principle and boasts a dynamic range of 120 decibels. It comes with several features such as black level adjustment, automatic exposure control, automatic gain control, compensation for lens shading (also known as optical vignetting), gamma correction, and automatic white balance for color correction.
The sensors recorded for this dataset are listed below:
- 4x 1MPx RGB fisheye cameras (190◦ horizontal FOV)
- 1x LiDAR rotating at 20Hz (Velodyne HDL-64E)
- 1x GNSS/IMU (NovAtel Propak6 & SPAN-IGM-A1)
- 1x GNSS Positioning with SPS (Garmin 18x)
- Odometry signals from the vehicle bus.
WoodScape supports multiple recognition tasks with labels for forty classes.
Dataset Design
Dataset design is considered a complex task, and the authors highlight the importance of careful consistency checks and database splitting for training, model selection, and testing. A sampling strategy aims to create a minimal consistent subset of the training set for efficiency. Data splitting and class balancing strategies are also detailed, providing control over each class’s representation within splits. The dataset supports hypothesis evaluation through multiple splits and addresses potential class imbalance issues for specific tasks. The ratio between train, validation, and test splits is 6:1:3. Please note, that the validation set was not excplicitly provided by the authors.
Summary #
WoodScape: A Multi-task, Multi-camera Fisheye Dataset for Autonomous Driving is a dataset for instance segmentation, semantic segmentation, and object detection tasks. It is used in the automotive industry.
The dataset consists of 15000 images with 796503 labeled objects belonging to 46 different classes including road_surface, ego_vehicle, construction, and other: car, pole, curb, nature, green_strip, free_space, sky, person, lane_marking, other_ground_marking, bicycle, clean, opaque, other_wheeled_transport, parking_line, grouped_vehicles, void, semi transparent, trafficsign_indistingushable, rider, traffic_sign, transparent, motorcycle, van, zebra_crossing, fence, grouped_pedestrian_and_animals, unknown_traffic_light, truck, bus, traffic_light_green, movable_object, traffic_light_red, cats_eyes_and_botts_dots, parking_marking, train/tram, trailer, animal, traffic_light_yellow, grouped_botts_dots, caravan, grouped_animals, and structure.
Images in the WoodScape: RGB Fisheye dataset have pixel-level instance segmentation annotations. Due to the nature of the instance segmentation task, it can be automatically transformed into a semantic segmentation (only one mask for every class) or object detection (bounding boxes for every object) tasks. There are 1766 (12% of the total) unlabeled images (i.e. without annotations). There are 2 splits in the dataset: train (12234 images) and test (2766 images). Additionally, every image contains information about its image source (rgb or source), while every instance of the object has vehicle info, depiction, glass, occlusion, and position tags. The dataset was released in 2021 by the Valeo, France.
Here is a visualized example for randomly selected sample classes:
Explore #
WoodScape: RGB Fisheye dataset has 15000 images. Click on one of the examples below or open "Explore" tool anytime you need to view dataset images with annotations. This tool has extended visualization capabilities like zoom, translation, objects table, custom filters and more. Hover the mouse over the images to hide or show annotations.






























Class balance #
There are 46 annotation classes in the dataset. Find the general statistics and balances for every class in the table below. Click any row to preview images that have labels of the selected class. Sort by column to find the most rare or prevalent classes.
Class ㅤ | Images ㅤ | Objects ㅤ | Count on image average | Area on image average |
|---|---|---|---|---|
road_surface➔ polygon | 8233 | 50774 | 6.17 | 26.6% |
ego_vehicle➔ polygon | 8232 | 18081 | 2.2 | 54.82% |
construction➔ polygon | 8166 | 106079 | 12.99 | 9.15% |
car➔ polygon | 8043 | 60666 | 7.54 | 2.93% |
pole➔ polygon | 7861 | 79328 | 10.09 | 0.31% |
curb➔ polygon | 7804 | 35338 | 4.53 | 0.64% |
nature➔ polygon | 7667 | 45817 | 5.98 | 4.03% |
green_strip➔ polygon | 7648 | 15014 | 1.96 | 0.8% |
free_space➔ polygon | 7310 | 45619 | 6.24 | 4.16% |
sky➔ polygon | 7269 | 25945 | 3.57 | 4.46% |
Images #
Explore every single image in the dataset with respect to the number of annotations of each class it has. Click a row to preview selected image. Sort by any column to find anomalies and edge cases. Use horizontal scroll if the table has many columns for a large number of classes in the dataset.
Object distribution #
Interactive heatmap chart for every class with object distribution shows how many images are in the dataset with a certain number of objects of a specific class. Users can click cell and see the list of all corresponding images.
Class sizes #
The table below gives various size properties of objects for every class. Click a row to see the image with annotations of the selected class. Sort columns to find classes with the smallest or largest objects or understand the size differences between classes.
Class | Object count | Avg area | Max area | Min area | Min height | Min height | Max height | Max height | Avg height | Avg height | Min width | Min width | Max width | Max width |
|---|---|---|---|---|---|---|---|---|---|---|---|---|---|---|
construction polygon | 106079 | 0.69% | 35.56% | 0% | 1px | 0.1% | 966px | 100% | 89px | 9.25% | 1px | 0.08% | 1280px | 100% |
pole polygon | 79328 | 0.03% | 6.32% | 0% | 1px | 0.1% | 582px | 60.25% | 44px | 4.58% | 1px | 0.08% | 1280px | 100% |
lane_marking polygon | 62662 | 0.06% | 10.97% | 0% | 1px | 0.1% | 718px | 74.33% | 41px | 4.2% | 1px | 0.08% | 1280px | 100% |
car polygon | 60666 | 0.38% | 34.07% | 0% | 1px | 0.1% | 960px | 99.38% | 56px | 5.84% | 1px | 0.08% | 1280px | 100% |
road_surface polygon | 50774 | 4.29% | 42.2% | 0% | 1px | 0.1% | 966px | 100% | 144px | 14.89% | 1px | 0.08% | 1280px | 100% |
nature polygon | 45817 | 0.66% | 39.21% | 0% | 1px | 0.1% | 962px | 99.59% | 96px | 9.94% | 1px | 0.08% | 1280px | 100% |
free_space polygon | 45619 | 0.65% | 34.02% | 0% | 1px | 0.1% | 955px | 98.86% | 94px | 9.71% | 1px | 0.08% | 1280px | 100% |
parking_line polygon | 43468 | 0.05% | 21.81% | 0% | 1px | 0.1% | 863px | 89.34% | 42px | 4.34% | 1px | 0.08% | 1153px | 90.08% |
other_ground_marking polygon | 35865 | 0.09% | 22.68% | 0% | 1px | 0.1% | 772px | 79.92% | 38px | 3.98% | 1px | 0.08% | 1251px | 97.73% |
curb polygon | 35338 | 0.13% | 6.8% | 0% | 1px | 0.1% | 929px | 96.17% | 98px | 10.16% | 1px | 0.08% | 1164px | 90.94% |
Spatial Heatmap #
The heatmaps below give the spatial distributions of all objects for every class. These visualizations provide insights into the most probable and rare object locations on the image. It helps analyze objects' placements in a dataset.

Objects #
Table contains all 100149 objects. Click a row to preview an image with annotations, and use search or pagination to navigate. Sort columns to find outliers in the dataset.
Object ID ㅤ | Class ㅤ | Image name click row to open | Image size height x width | Height ㅤ | Height ㅤ | Width ㅤ | Width ㅤ | Area ㅤ |
|---|---|---|---|---|---|---|---|---|
1➔ | green_strip polygon | rgb_04084_RV.png | 966 x 1280 | 4px | 0.41% | 1280px | 100% | 0.31% |
2➔ | green_strip polygon | rgb_04084_RV.png | 966 x 1280 | 4px | 0.41% | 1280px | 100% | 0.31% |
3➔ | car polygon | rgb_04084_RV.png | 966 x 1280 | 36px | 3.73% | 55px | 4.3% | 0.11% |
4➔ | van polygon | rgb_04084_RV.png | 966 x 1280 | 22px | 2.28% | 32px | 2.5% | 0.04% |
5➔ | car polygon | rgb_04084_RV.png | 966 x 1280 | 65px | 6.73% | 113px | 8.83% | 0.31% |
6➔ | car polygon | rgb_04084_RV.png | 966 x 1280 | 10px | 1.04% | 12px | 0.94% | 0% |
7➔ | van polygon | rgb_04084_RV.png | 966 x 1280 | 75px | 7.76% | 37px | 2.89% | 0.11% |
8➔ | car polygon | rgb_04084_RV.png | 966 x 1280 | 31px | 3.21% | 24px | 1.88% | 0.03% |
9➔ | car polygon | rgb_04084_RV.png | 966 x 1280 | 17px | 1.76% | 21px | 1.64% | 0.02% |
10➔ | bicycle polygon | rgb_04084_RV.png | 966 x 1280 | 39px | 4.04% | 42px | 3.28% | 0.04% |
License #
To encourage the research community to improve AI-based systems, Valeo is making available to the public, free of charge, the Dataset subject to the terms and conditions below:
- Dataset means a collection of fisheye camera data and lidar data, collected in diverse conditions from moving vehicles, labelled by Mighty Ai and anonymized with brighter AI’s Deep Natural AnonymizationTM, available at woodscape.valeo.ai.
- Valeo means Valeo Comfort and Driving Assistance SAS.
- You means the individual or entity who accesses the Dataset subject to the present terms of use.
By downloading the Dataset You are agreeing to comply with the present terms and conditions.
You shall use the Dataset only (i) for research purposes in conjunction with internal non-published research projects, publicly available research, publications and studies, access to which is not subject to payment, (ii) teaching, (iii) to perform benchmarking for purposes of academic or applied research publication or (iv) for personal experimentation.
You shall not use the Dataset for commercial purposes i.e. primarily intended for or directed towards commercial advantage or monetary compensation, and notably not use or deploy the Dataset, any models trained on or refined using the Dataset including pre-training or augmentation, in operation of a vehicle or to assist in the operation of vehicle.
You shall cause to be conspicuously displayed in all public material and website referencing research conducted with the Dataset, a notice that the research was conducted using Valeo Woodscape Dataset by providing a link to the Dataset website. Valeo has taken reasonable care to remove any identifiable information from the Dataset including faces of people and license plates. Valeo prohibits You from using the Dataset in any manner to identify any person.
The Dataset may automatically update. Valeo is not obliged to make any updates available, to provide any technical support of any kind or to continue making the Dataset available for any period of time. Valeo may terminate Your access to the Dataset at any time, with or without cause, with or without notice.
These terms and conditions may be amended from time to time at Valeo’s sole discretion. Please periodically review the controlling version of these terms. By continuing to use the Dataset, you acknowledge and agree to such amendment.
YOU AGREE THAT THE DATASET IS PROVIDED “AS IS” WITHOUT ANY EXPRESS OR IMPLIED WARRANTY, INCLUDING WITHOUT LIMITATIONS WARRANTIES OF TITLE, MERCHANTABILITY, FITNESS FOR A PARTICULAR PURPOSE AND NON INFRINGEMENT. WITHOUT LIMITING TO THE FOREGOING, VALEO DOES NOT WARRANT THAT THE CONTENT OF THE DATASET IS COMPLETE, ACCURATE, RELIABLE OR CORRECT IN THEIR POSTED FORMS. IN NO EVENT SHALL VALEO BE LIABLE UNDER ANY LEGAL THEORY WITH RESPECT TO THE DATASET OR ANY WORK MADE OR DEVELOPPED USING THE DATASET, FOR ANY DIRECT DAMAGES OR FOR ANY INDIRECT, CONSEQUENTIAL, INCIDENTAL, PUNITIVE OR SPECIAL DAMAGES OR LOST PROFITS.
The entire risk arising out of use or performance of the Dataset remains with You. You agree that it is solely your responsibility to comply with all applicable laws with regard to the use of the Dataset. These terms and conditions shall be governed by and interpreted in accordance with the laws of France. All disputes about these terms will be presented to the applicable courts of Paris (France). You consent to the jurisdiction of such courts and waive any jurisdictional or venue defenses otherwise available.
Citation #
If you make use of the WoodScape data, please cite the following reference:
@InProceedings{Yogamani_2019_ICCV,
  author = {Yogamani, Senthil and Hughes, Ciaran and Horgan, Jonathan and Sistu, Ganesh and Varley, Padraig and O'Dea, Derek and Uricar, Michal and Milz, Stefan and Simon, Martin and Amende, Karl and Witt, Christian and Rashed, Hazem and Chennupati, Sumanth and Nayak, Sanjaya and Mansoor, Saquib and Perrotton, Xavier and Perez, Patrick},
  title = {WoodScape: A Multi-Task, Multi-Camera Fisheye Dataset for Autonomous Driving},
  booktitle = {Proceedings of the IEEE/CVF International Conference on Computer Vision (ICCV)},
  month = {October},
  year = {2019},
  doi = {10.1109/ICCV.2019.00940}
}
If you are happy with Dataset Ninja and use provided visualizations and tools in your work, please cite us:
@misc{ visualization-tools-for-woodscape-dataset,
  title = { Visualization Tools for WoodScape: RGB Fisheye Dataset },
  type = { Computer Vision Tools },
  author = { Dataset Ninja },
  howpublished = { \url{ https://datasetninja.com/woodscape } },
  url = { https://datasetninja.com/woodscape },
  journal = { Dataset Ninja },
  publisher = { Dataset Ninja },
  year = { 2026 },
  month = { jan },
  note = { visited on 2026-01-06 },
}
Download #
Dataset WoodScape: RGB Fisheye can be downloaded in Supervisely format:
As an alternative, it can be downloaded with dataset-tools package:
pip install --upgrade dataset-tools
… using following python code:
import dataset_tools as dtools

dtools.download(dataset='WoodScape: RGB Fisheye', dst_dir='~/dataset-ninja/')
Make sure not to overlook the python code example available on the Supervisely Developer Portal. It will give you a clear idea of how to effortlessly work with the downloaded dataset.
The data in original format can be downloaded here.
Disclaimer #
Our gal from the legal dep told us we need to post this:
Dataset Ninja provides visualizations and statistics for some datasets that can be found online and can be downloaded by general audience. Dataset Ninja is not a dataset hosting platform and can only be used for informational purposes. The platform does not claim any rights for the original content, including images, videos, annotations and descriptions. Joint publishing is prohibited.
You take full responsibility when you use datasets presented at Dataset Ninja, as well as other information, including visualizations and statistics we provide. You are in charge of compliance with any dataset license and all other permissions. You are required to navigate datasets homepage and make sure that you can use it. In case of any questions, get in touch with us at hello@datasetninja.com.


