

Introduction #
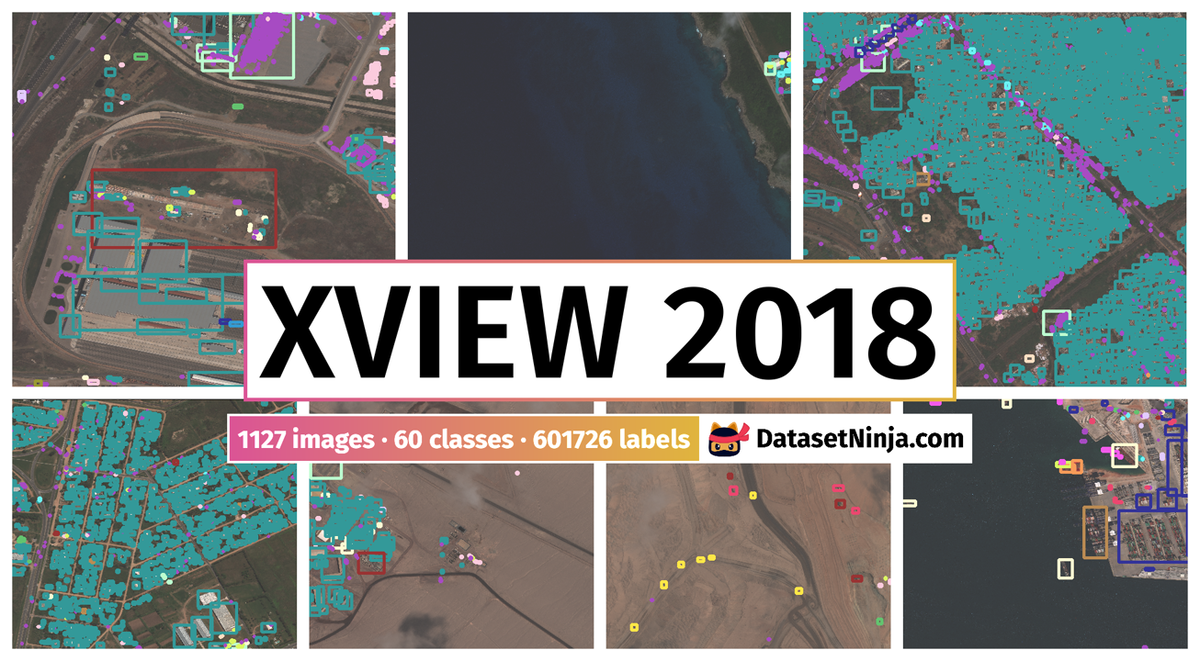
The DIUx xView: Objects in Context in Overhead Imagery is a large-scale dataset designed to advance object detection techniques and research in overhead object detection. This satellite imagery dataset was aimed at addressing challenges in four key areas of computer vision. Their approach involved a unique process for geospatial category detection and bounding box annotation, including three stages of quality control. The dataset was collected using WorldView-3 satellites, providing higher-resolution imagery compared to most publicly available satellite datasets. The authors conducted comparisons with other object detection datasets in both natural and overhead imagery domains, leveraging the Single Shot MultiBox Detector for baseline analysis. xView was noted as one of the largest and most diverse publicly accessible object detection datasets to date, comprising over 1 million objects across 60 classes and covering more than 1,400 km² of imagery.
The authors emphasized the significance of overhead image data from satellites and its growing relevance in real-world applications, which called for the development of more sophisticated and robust models and algorithms for object detection. They expressed their hope that xView would serve as a central resource for a wide range of research endeavors in computer vision and overhead object detection.
They highlighted the limited availability of object detection datasets for overhead satellite imagery, characterized by low class counts, poor geographic diversity, limited training instances, or narrow class scopes. xView aimed to address these limitations by conducting extensive labeling efforts across various locations and implementing a hierarchical ontology of parent and child-level classes.
The authors outlined the four computer vision frontiers that xView targeted, including improving minimum resolution and multi-scale recognition, enhancing learning efficiency for imbalanced datasets, pushing the limit of discoverable object classes, and improving the detection of fine-grained classes. They noted that over 80% of the classes in xView were fine-grained, which required precise object detection.
Details about the dataset were provided, covering aspects such as image collection, annotation methodology, quality control, gold standards, and dataset statistics. The dataset encompassed a diverse range of classes (analogous with their real-world prevalence, buildings and small cars have the highest instance counts), spanned various geographic regions, and featured objects of different sizes, presenting unique challenges for object detection algorithms. The authors conducted rigorous quality control measures, involving multiple stages of review and validation, to ensure the accuracy and consistency of annotations.
The dataset was divided into three splits for public release: train, test, and val, with specific percentages allocated to each split. These splits were based on per-image levels, and the authors aimed to ensure each category had a sufficient number of instances in each split. Comparisons with other object detection datasets were made, highlighting the unique characteristics and diversity of xView.
 Homepage
 Research Paper
Summary #
DIUx xView: Objects in Context in Overhead Imagery 2018 Challenge is a dataset for an object detection task. It is used in the geospatial domain.
The dataset consists of 1127 images with 601726 labeled objects belonging to 60 different classes including building, small car, truck, and other: bus, cargo truck, vehicle lot, utility truck, trailer, truck w/box, dump truck, facility, storage tank, pickup truck, shed, passenger vehicle, truck w/flatbed, front loader/bulldozer, excavator, construction site, damaged building, shipping container lot, truck tractor, cargo plane, mobile crane, engineering vehicle, shipping container, motorboat, pylon, and 32 more.
Images in the xView 2018 dataset have bounding box annotations. There are 281 (25% of the total) unlabeled images (i.e. without annotations). There are 2 splits in the dataset: train (846 images) and val (281 images). Additionally, objects contain information about parent classes and coordinates. Explore them in supervisely. The dataset was released in 2018 by the Defense Innovation Unit (DIU), USA.
Explore #
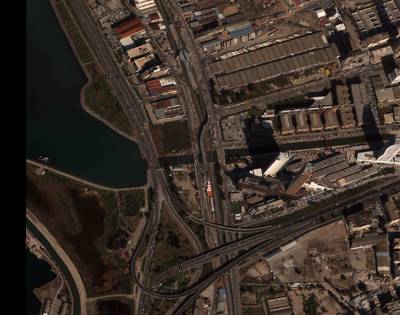
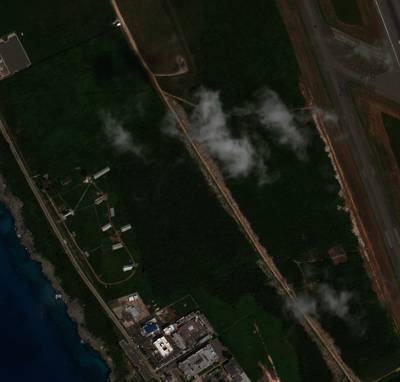
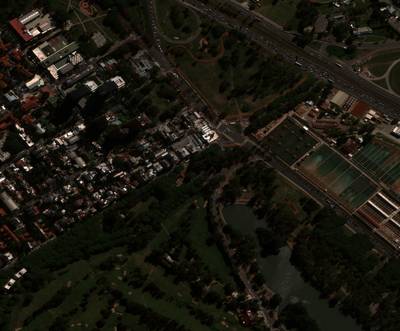
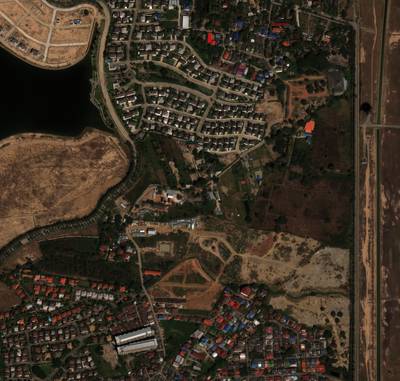
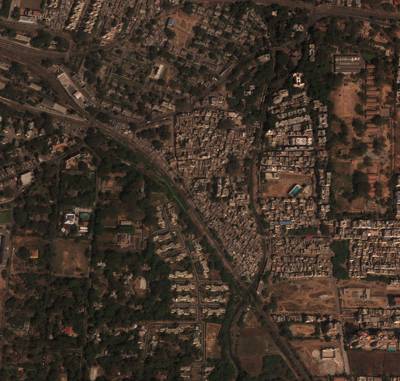
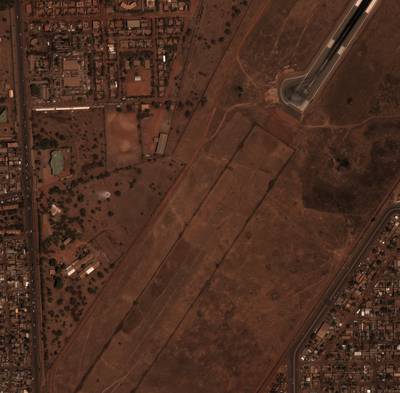
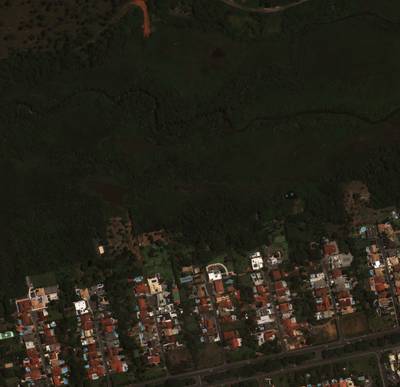
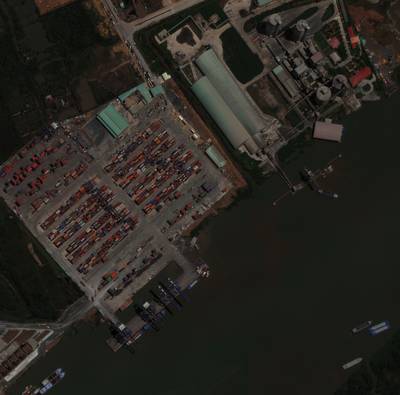
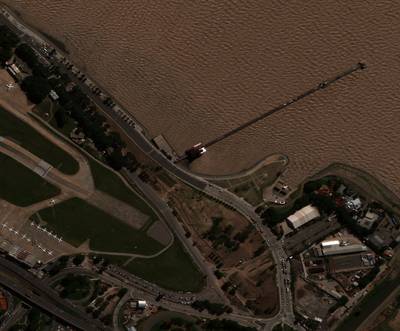
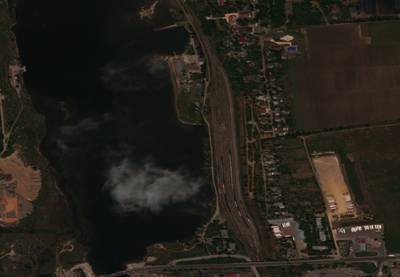
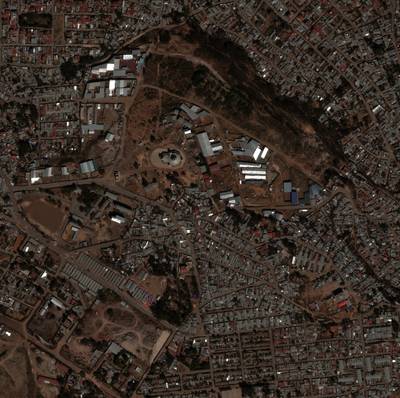
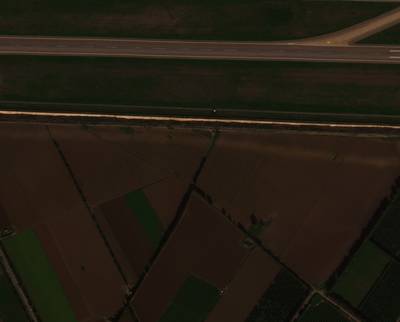
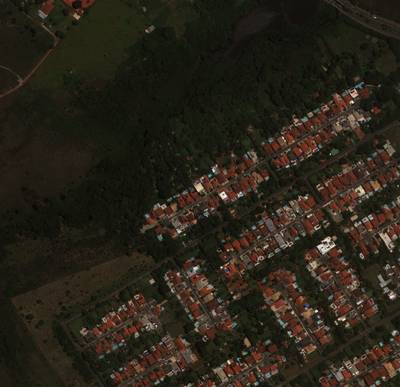
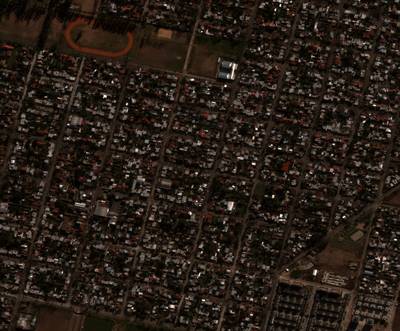
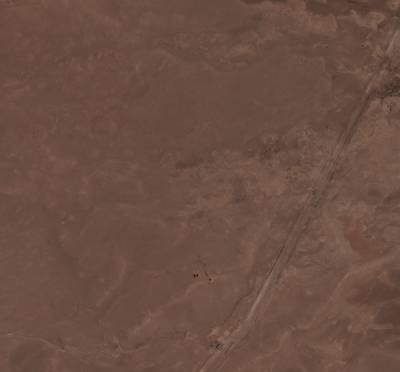
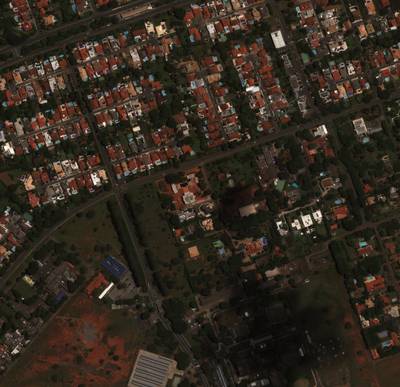
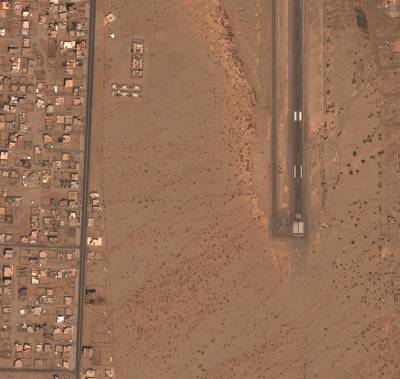
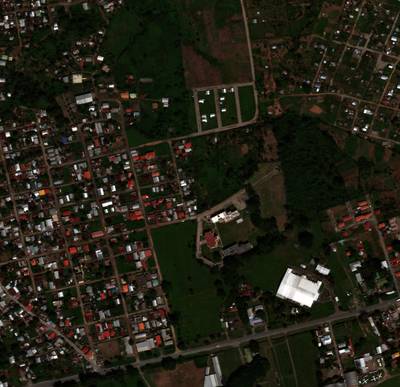
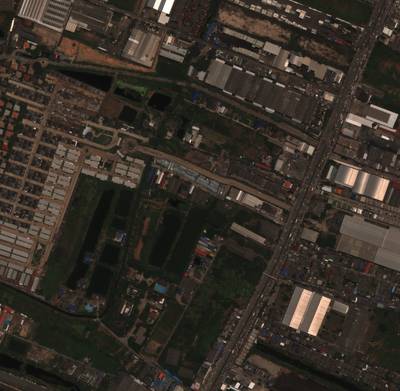
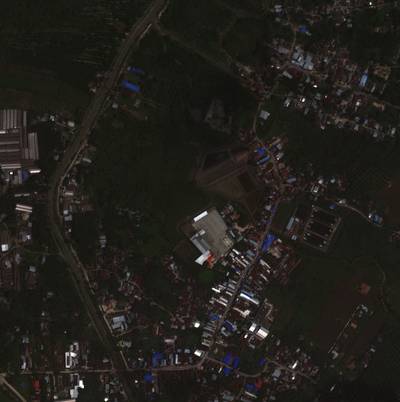
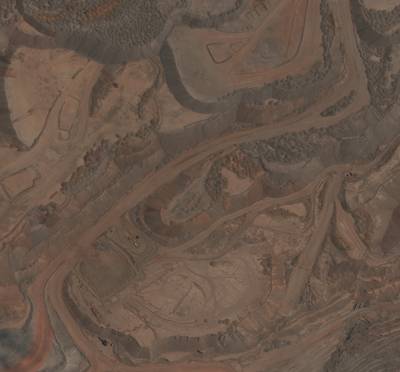
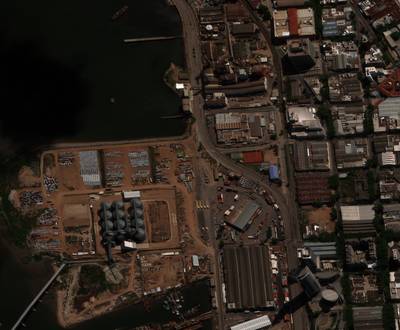
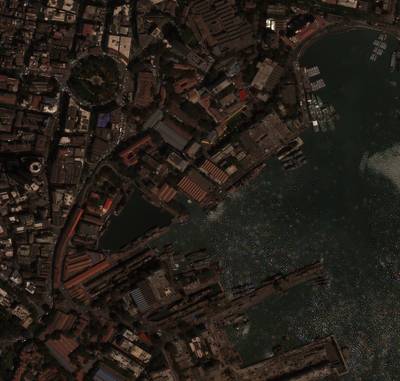
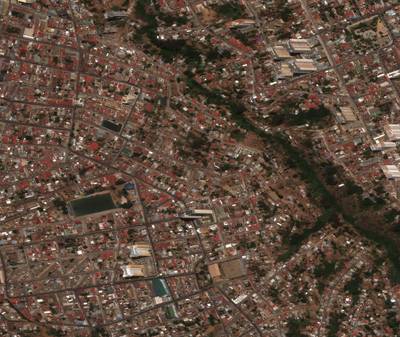
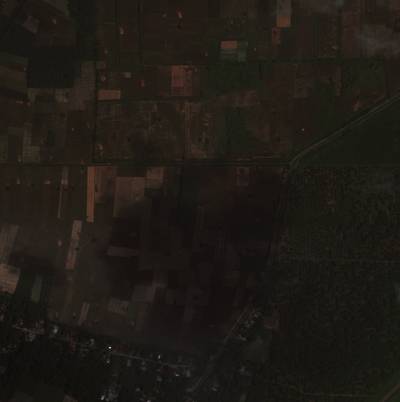
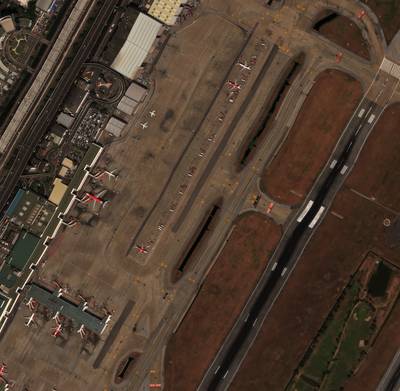
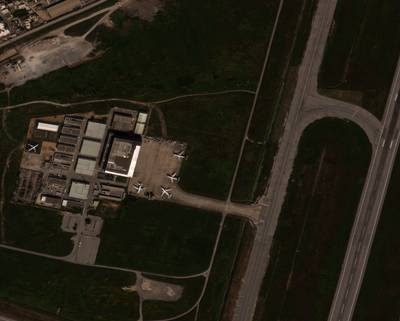
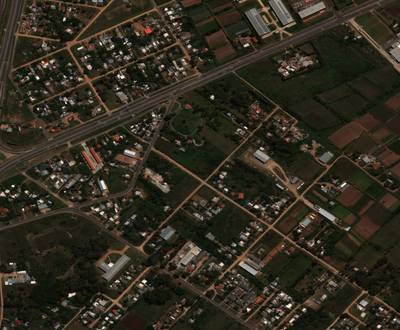
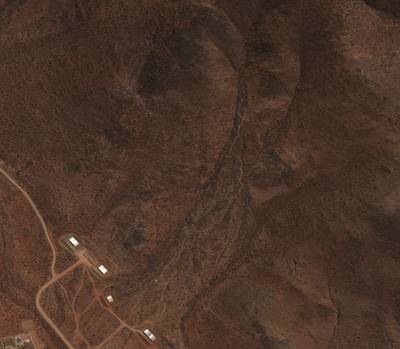
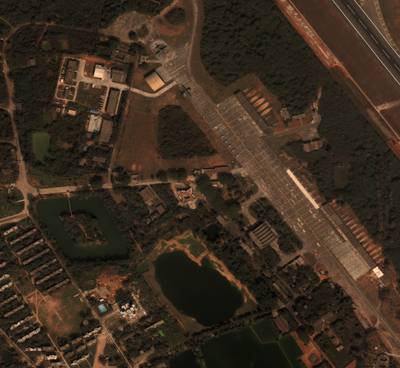
xView 2018 dataset has 1127 images. Click on one of the examples below or open "Explore" tool anytime you need to view dataset images with annotations. This tool has extended visualization capabilities like zoom, translation, objects table, custom filters and more. Hover the mouse over the images to hide or show annotations.


Class balance #
There are 60 annotation classes in the dataset. Find the general statistics and balances for every class in the table below. Click any row to preview images that have labels of the selected class. Sort by column to find the most rare or prevalent classes.

Class ㅤ | Images ㅤ | Objects ㅤ | Count on image average | Area on image average |
|---|---|---|---|---|
building➔ rectangle | 726 | 316671 | 436.19 | 14.04% |
small car➔ rectangle | 691 | 211660 | 306.31 | 0.53% |
truck➔ rectangle | 535 | 12189 | 22.78 | 0.11% |
bus➔ rectangle | 447 | 6975 | 15.6 | 0.07% |
cargo truck➔ rectangle | 411 | 5899 | 14.35 | 0.07% |
vehicle lot➔ rectangle | 358 | 4266 | 11.92 | 1.79% |
utility truck➔ rectangle | 355 | 3635 | 10.24 | 0.03% |
trailer➔ rectangle | 314 | 4103 | 13.07 | 0.1% |
truck w/box➔ rectangle | 299 | 3653 | 12.22 | 0.13% |
dump truck➔ rectangle | 255 | 1358 | 5.33 | 0.03% |
Images #
Explore every single image in the dataset with respect to the number of annotations of each class it has. Click a row to preview selected image. Sort by any column to find anomalies and edge cases. Use horizontal scroll if the table has many columns for a large number of classes in the dataset.
Class sizes #
The table below gives various size properties of objects for every class. Click a row to see the image with annotations of the selected class. Sort columns to find classes with the smallest or largest objects or understand the size differences between classes.
Class | Object count | Avg area | Max area | Min area | Min height | Min height | Max height | Max height | Avg height | Avg height | Min width | Min width | Max width | Max width |
|---|---|---|---|---|---|---|---|---|---|---|---|---|---|---|
building rectangle | 316671 | 0.04% | 23.3% | 0% | 1px | 0.03% | 2467px | 76.71% | 47px | 1.6% | 1px | 0.03% | 2581px | 57.67% |
small car rectangle | 211660 | 0% | 0.88% | 0% | 1px | 0.03% | 395px | 12.36% | 13px | 0.44% | 1px | 0.03% | 757px | 15.19% |
truck rectangle | 12189 | 0% | 0.05% | 0% | 3px | 0.09% | 77px | 2.51% | 21px | 0.71% | 1px | 0.03% | 96px | 2.79% |
bus rectangle | 6975 | 0% | 0.03% | 0% | 1px | 0.03% | 73px | 2.64% | 21px | 0.73% | 2px | 0.06% | 97px | 2.28% |
cargo truck rectangle | 5899 | 0% | 0.17% | 0% | 1px | 0.04% | 150px | 4.71% | 21px | 0.72% | 1px | 0.03% | 162px | 4.65% |
vehicle lot rectangle | 4266 | 0.16% | 8.77% | 0% | 2px | 0.08% | 941px | 38.76% | 93px | 3.17% | 2px | 0.06% | 1076px | 27.42% |
trailer rectangle | 4103 | 0.01% | 1% | 0% | 5px | 0.17% | 324px | 10.6% | 24px | 0.82% | 3px | 0.09% | 311px | 9.45% |
truck w/box rectangle | 3653 | 0.01% | 0.19% | 0% | 3px | 0.1% | 158px | 5.98% | 34px | 1.13% | 4px | 0.13% | 110px | 3.2% |
utility truck rectangle | 3635 | 0% | 0.01% | 0% | 2px | 0.07% | 37px | 1.31% | 16px | 0.55% | 3px | 0.1% | 46px | 1.31% |
passenger vehicle rectangle | 2954 | 0% | 0.02% | 0% | 4px | 0.12% | 53px | 1.66% | 13px | 0.46% | 4px | 0.14% | 58px | 1.76% |
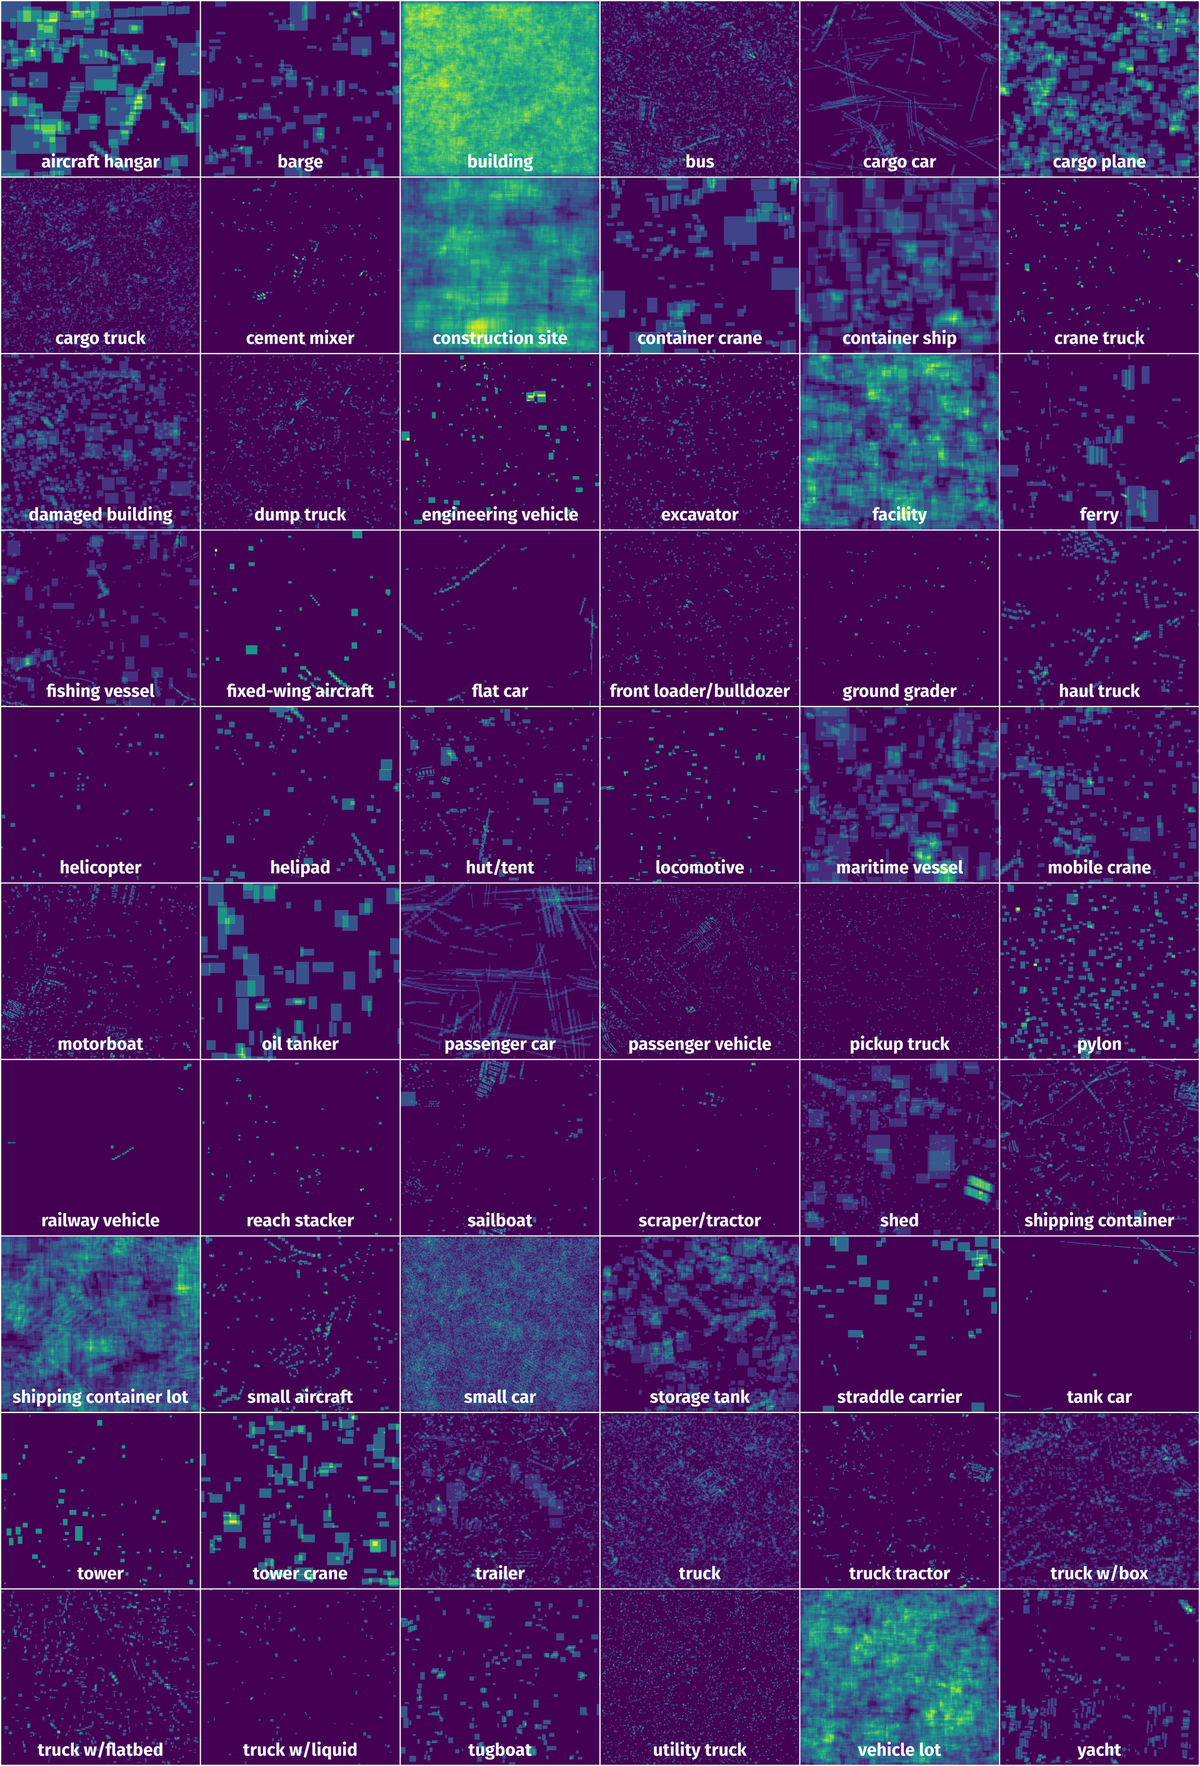
Spatial Heatmap #
The heatmaps below give the spatial distributions of all objects for every class. These visualizations provide insights into the most probable and rare object locations on the image. It helps analyze objects' placements in a dataset.
Objects #
Table contains all 111150 objects. Click a row to preview an image with annotations, and use search or pagination to navigate. Sort columns to find outliers in the dataset.
Object ID ㅤ | Class ㅤ | Image name click row to open | Image size height x width | Height ㅤ | Height ㅤ | Width ㅤ | Width ㅤ | Area ㅤ |
|---|---|---|---|---|---|---|---|---|
1➔ | cargo truck rectangle | 520.tif.tiff | 2771 x 2979 | 10px | 0.36% | 32px | 1.07% | 0% |
2➔ | cargo truck rectangle | 520.tif.tiff | 2771 x 2979 | 13px | 0.47% | 38px | 1.28% | 0.01% |
3➔ | cargo truck rectangle | 520.tif.tiff | 2771 x 2979 | 15px | 0.54% | 38px | 1.28% | 0.01% |
4➔ | building rectangle | 520.tif.tiff | 2771 x 2979 | 52px | 1.88% | 47px | 1.58% | 0.03% |
5➔ | building rectangle | 520.tif.tiff | 2771 x 2979 | 39px | 1.41% | 42px | 1.41% | 0.02% |
6➔ | shipping container lot rectangle | 520.tif.tiff | 2771 x 2979 | 154px | 5.56% | 73px | 2.45% | 0.14% |
7➔ | building rectangle | 520.tif.tiff | 2771 x 2979 | 45px | 1.62% | 92px | 3.09% | 0.05% |
8➔ | building rectangle | 520.tif.tiff | 2771 x 2979 | 28px | 1.01% | 44px | 1.48% | 0.01% |
9➔ | building rectangle | 520.tif.tiff | 2771 x 2979 | 38px | 1.37% | 57px | 1.91% | 0.03% |
10➔ | building rectangle | 520.tif.tiff | 2771 x 2979 | 21px | 0.76% | 17px | 0.57% | 0% |
License #
DIUx xView: Objects in Context in Overhead Imagery 2018 Challenge is under CC BY-NC-SA 4.0 license.
Citation #
If you make use of the xView 2018 data, please cite the following reference:
Darius Lam, Richard Kuzma, Kevin McGee, Samuel Dooley, Michael Laielli, Matthew Klaric, Yaroslav Bulatov, Brendan McCord.
xView: Objects in Context in Overhead Imagery, 2018.
https://arxiv.org/abs/1802.07856v1
If you are happy with Dataset Ninja and use provided visualizations and tools in your work, please cite us:
@misc{ visualization-tools-for-xview-dataset,
  title = { Visualization Tools for xView 2018 Dataset },
  type = { Computer Vision Tools },
  author = { Dataset Ninja },
  howpublished = { \url{ https://datasetninja.com/xview } },
  url = { https://datasetninja.com/xview },
  journal = { Dataset Ninja },
  publisher = { Dataset Ninja },
  year = { 2026 },
  month = { jul },
  note = { visited on 2026-07-15 },
}
Download #
Dataset xView 2018 can be downloaded in Supervisely format:
As an alternative, it can be downloaded with dataset-tools package:
pip install --upgrade dataset-tools
… using following python code:
import dataset_tools as dtools

dtools.download(dataset='xView 2018', dst_dir='~/dataset-ninja/')
Make sure not to overlook the python code example available on the Supervisely Developer Portal. It will give you a clear idea of how to effortlessly work with the downloaded dataset.
The data in original format can be downloaded here.
Disclaimer #
Our gal from the legal dep told us we need to post this:
Dataset Ninja provides visualizations and statistics for some datasets that can be found online and can be downloaded by general audience. Dataset Ninja is not a dataset hosting platform and can only be used for informational purposes. The platform does not claim any rights for the original content, including images, videos, annotations and descriptions. Joint publishing is prohibited.
You take full responsibility when you use datasets presented at Dataset Ninja, as well as other information, including visualizations and statistics we provide. You are in charge of compliance with any dataset license and all other permissions. You are required to navigate datasets homepage and make sure that you can use it. In case of any questions, get in touch with us at hello@datasetninja.com.