
Introduction #
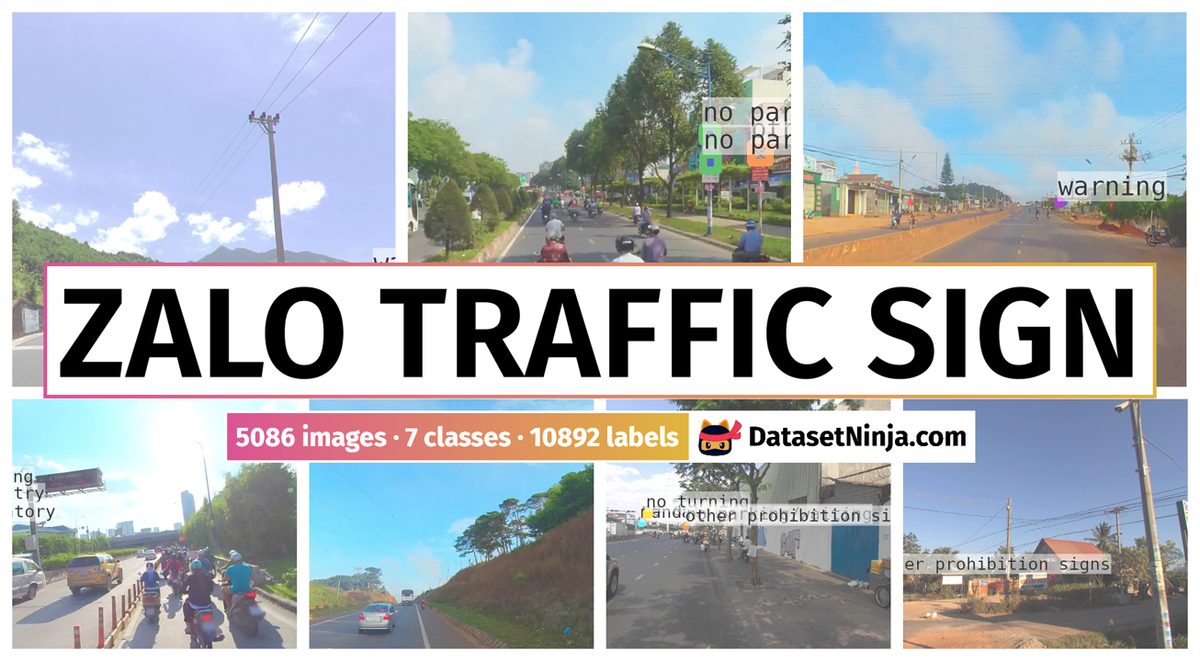
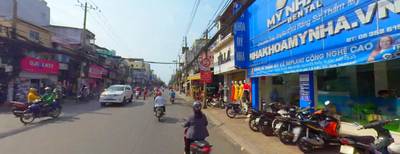
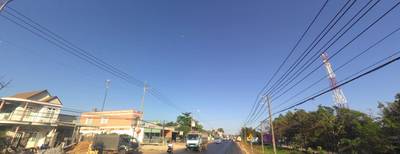
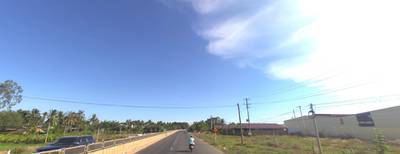
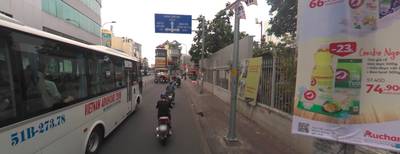
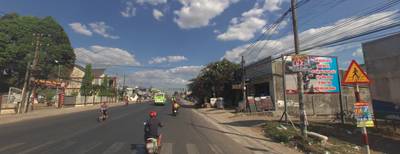
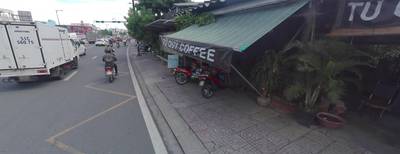
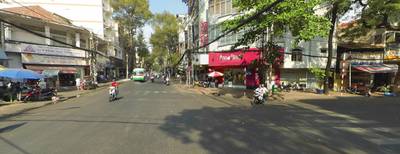
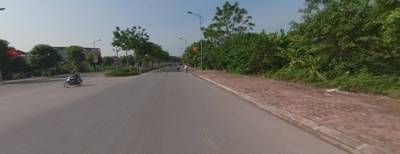
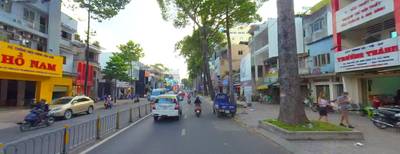
The Zalo Traffic Sign Detection 2020 Dataset presents a significant challenge yet is highly suitable for traffic sign detection applications in the diverse traffic conditions of Vietnam. Comprising 4,500 images sized at 1622x626 pixels, the dataset was curated by crawling Google Street View Map across various locations in Vietnam. The task entails detecting seven prevalent types of traffic signs: no entry, no parking/waiting, no turning, max speed, other prohibition signs, warning, and mandatory. Notably, the dataset poses considerable challenges due to the majority of objects of interest being extremely small, often less than 10x10 pixels in size. Additionally, it encompasses a wide array of scenes, ranging from urban areas to rural landscapes and from bustling city streets to secluded highways. The dataset is partitioned into two subsets: the train set, comprising 4,000 images, and the test set, comprising 500 images. Although the size of images of the Zalo dataset is large, traffic signs are very small in comparison to the whole image because the signs are very far from the camera.
 Homepage
 Research Paper
Summary #
Zalo Traffic Sign Detection 2020 Dataset is a dataset for an object detection task. It is used in the automotive industry.
The dataset consists of 5086 images with 10892 labeled objects belonging to 7 different classes including warning, no parking/waiting, other prohibition signs, and other: no entry, mandatory, max speed, and no turning.
Images in the Zalo Traffic Sign dataset have bounding box annotations. There are 586 (12% of the total) unlabeled images (i.e. without annotations). There are 2 splits in the dataset: train (4500 images) and test (586 images). Additionally, every image marked with street id tag. The dataset was released in 2020 by the Zalo AI, Vietnam.
Explore #
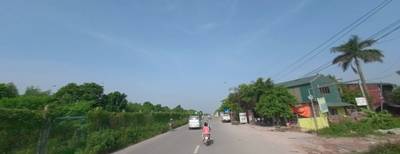
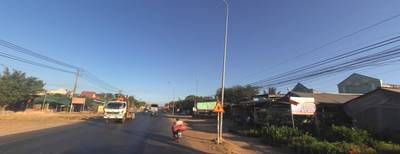
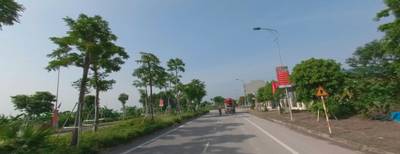
Zalo Traffic Sign dataset has 5086 images. Click on one of the examples below or open "Explore" tool anytime you need to view dataset images with annotations. This tool has extended visualization capabilities like zoom, translation, objects table, custom filters and more. Hover the mouse over the images to hide or show annotations.


Class balance #
There are 7 annotation classes in the dataset. Find the general statistics and balances for every class in the table below. Click any row to preview images that have labels of the selected class. Sort by column to find the most rare or prevalent classes.

Class ㅤ | Images ㅤ | Objects ㅤ | Count on image average | Area on image average |
|---|---|---|---|---|
warning➔ rectangle | 1853 | 3049 | 1.65 | 0.16% |
no parking/waiting➔ rectangle | 1578 | 2220 | 1.41 | 0.18% |
other prohibition signs➔ rectangle | 1115 | 1784 | 1.6 | 0.16% |
no entry➔ rectangle | 1040 | 1415 | 1.36 | 0.06% |
mandatory➔ rectangle | 789 | 1021 | 1.29 | 0.08% |
max speed➔ rectangle | 441 | 847 | 1.92 | 0.16% |
no turning➔ rectangle | 438 | 556 | 1.27 | 0.2% |
Co-occurrence matrix #
Co-occurrence matrix is an extremely valuable tool that shows you the images for every pair of classes: how many images have objects of both classes at the same time. If you click any cell, you will see those images. We added the tooltip with an explanation for every cell for your convenience, just hover the mouse over a cell to preview the description.
Images #
Explore every single image in the dataset with respect to the number of annotations of each class it has. Click a row to preview selected image. Sort by any column to find anomalies and edge cases. Use horizontal scroll if the table has many columns for a large number of classes in the dataset.
Object distribution #
Interactive heatmap chart for every class with object distribution shows how many images are in the dataset with a certain number of objects of a specific class. Users can click cell and see the list of all corresponding images.
Class sizes #
The table below gives various size properties of objects for every class. Click a row to see the image with annotations of the selected class. Sort columns to find classes with the smallest or largest objects or understand the size differences between classes.
Class | Object count | Avg area | Max area | Min area | Min height | Min height | Max height | Max height | Avg height | Avg height | Min width | Min width | Max width | Max width |
|---|---|---|---|---|---|---|---|---|---|---|---|---|---|---|
warning rectangle | 3049 | 0.12% | 4.74% | 0% | 4px | 0.64% | 245px | 39.14% | 24px | 3.88% | 4px | 0.25% | 211px | 13.01% |
no parking/waiting rectangle | 2220 | 0.14% | 5.42% | 0% | 4px | 0.64% | 200px | 31.95% | 29px | 4.58% | 4px | 0.25% | 275px | 16.95% |
other prohibition signs rectangle | 1784 | 0.11% | 4.48% | 0% | 4px | 0.64% | 202px | 32.27% | 25px | 4.06% | 4px | 0.25% | 253px | 15.6% |
no entry rectangle | 1415 | 0.06% | 1.5% | 0% | 3px | 0.48% | 124px | 19.81% | 18px | 2.84% | 3px | 0.18% | 123px | 7.58% |
mandatory rectangle | 1021 | 0.07% | 2.73% | 0% | 3px | 0.48% | 176px | 28.12% | 19px | 3.1% | 4px | 0.25% | 274px | 16.89% |
max speed rectangle | 847 | 0.09% | 2.23% | 0% | 4px | 0.64% | 120px | 19.17% | 24px | 3.85% | 4px | 0.25% | 210px | 12.95% |
no turning rectangle | 556 | 0.17% | 2.43% | 0% | 5px | 0.8% | 155px | 24.76% | 31px | 5.02% | 6px | 0.37% | 190px | 11.71% |
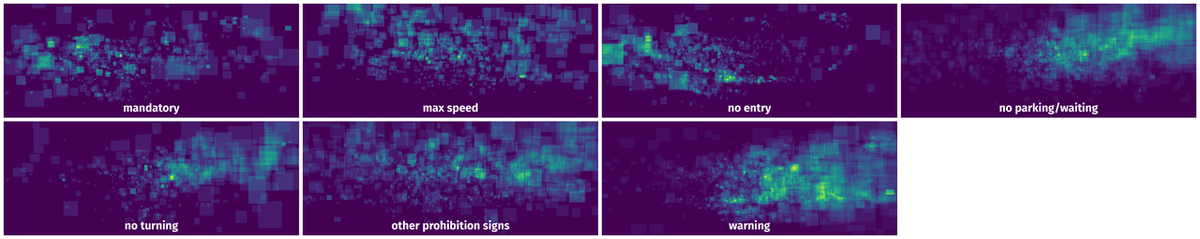
Spatial Heatmap #
The heatmaps below give the spatial distributions of all objects for every class. These visualizations provide insights into the most probable and rare object locations on the image. It helps analyze objects' placements in a dataset.
Objects #
Table contains all 10892 objects. Click a row to preview an image with annotations, and use search or pagination to navigate. Sort columns to find outliers in the dataset.
Object ID ㅤ | Class ㅤ | Image name click row to open | Image size height x width | Height ㅤ | Height ㅤ | Width ㅤ | Width ㅤ | Area ㅤ |
|---|---|---|---|---|---|---|---|---|
1➔ | warning rectangle | 7828.png | 626 x 1622 | 18px | 2.88% | 19px | 1.17% | 0.03% |
2➔ | max speed rectangle | 12474.png | 626 x 1622 | 53px | 8.47% | 50px | 3.08% | 0.26% |
3➔ | max speed rectangle | 12474.png | 626 x 1622 | 57px | 9.11% | 54px | 3.33% | 0.3% |
4➔ | other prohibition signs rectangle | 12474.png | 626 x 1622 | 59px | 9.42% | 52px | 3.21% | 0.3% |
5➔ | max speed rectangle | 12474.png | 626 x 1622 | 35px | 5.59% | 37px | 2.28% | 0.13% |
6➔ | no entry rectangle | 11046.png | 626 x 1622 | 11px | 1.76% | 12px | 0.74% | 0.01% |
7➔ | mandatory rectangle | 11046.png | 626 x 1622 | 12px | 1.92% | 12px | 0.74% | 0.01% |
8➔ | no entry rectangle | 11046.png | 626 x 1622 | 12px | 1.92% | 12px | 0.74% | 0.01% |
9➔ | mandatory rectangle | 11046.png | 626 x 1622 | 12px | 1.92% | 12px | 0.74% | 0.01% |
10➔ | no entry rectangle | 11046.png | 626 x 1622 | 13px | 2.08% | 12px | 0.74% | 0.02% |
License #
License is unknown for the Zalo Traffic Sign Detection 2020 Dataset dataset.
Citation #
If you make use of the Zalo Traffic Sign data, please cite the following reference:
PASTE HERE CUSTOM CITATION FROM THE SOURCE URL
[Source](Thanh-Tung Ngo)
If you are happy with Dataset Ninja and use provided visualizations and tools in your work, please cite us:
@misc{ visualization-tools-for-zalo-traffic-sign-dataset,
  title = { Visualization Tools for Zalo Traffic Sign Dataset },
  type = { Computer Vision Tools },
  author = { Dataset Ninja },
  howpublished = { \url{ https://datasetninja.com/zalo-traffic-sign } },
  url = { https://datasetninja.com/zalo-traffic-sign },
  journal = { Dataset Ninja },
  publisher = { Dataset Ninja },
  year = { 2026 },
  month = { jul },
  note = { visited on 2026-07-16 },
}
Download #
Please visit dataset homepage to download the data.
Disclaimer #
Our gal from the legal dep told us we need to post this:
Dataset Ninja provides visualizations and statistics for some datasets that can be found online and can be downloaded by general audience. Dataset Ninja is not a dataset hosting platform and can only be used for informational purposes. The platform does not claim any rights for the original content, including images, videos, annotations and descriptions. Joint publishing is prohibited.
You take full responsibility when you use datasets presented at Dataset Ninja, as well as other information, including visualizations and statistics we provide. You are in charge of compliance with any dataset license and all other permissions. You are required to navigate datasets homepage and make sure that you can use it. In case of any questions, get in touch with us at hello@datasetninja.com.