
Introduction #
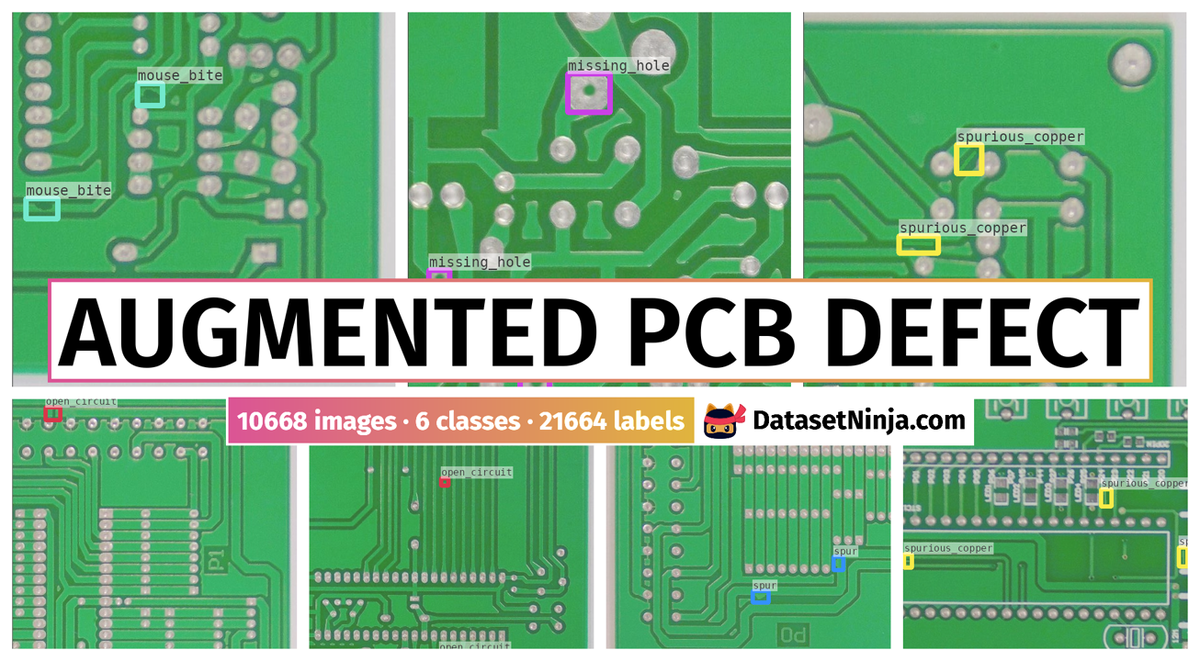
Augmented PCB Defect is a dataset designed for object detection, encompassing 10,668 images with 21,664 labeled objects across six distinct classes, including mouse_bite, missing_hole, spurious_copper, and others such as spur, open_circuit, and short. Meticulously curated with a focus on Tiny Defect Detection (TDD), this dataset plays a pivotal role in advancing quality control measures in the production of printed circuit boards (PCBs), a fundamental and crucial aspect of manufacturing processes in the electronics industry.
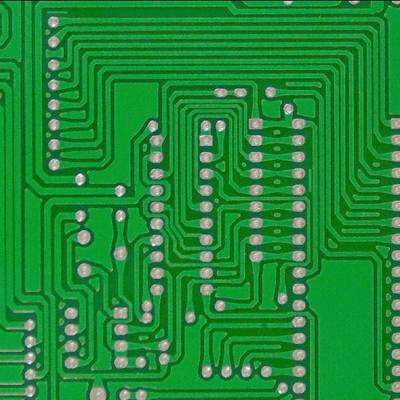
This dataset is the result of comprehensive experimentation conducted on the original PCB Defect Dataset (available on DatasetNinja). The initial dataset comprises 693 PCB defective images, each annotated with corresponding files. The average pixel size of each image in this dataset is 2,777x2,138. The PCB defects are categorized into 6 classes, including missing hole, mouse bite, open circuit, short, spur, and spurious copper, with each image potentially containing multiple defects. Recognizing the limitations of the small dataset, data augmentation techniques were applied before training, and subsequently, the images were cropped into 600x600 sub-images. This process resulted in the creation of a training set and a testing set, comprising 9,920 and 2,508 images, respectively, contributing to a more robust and diversified dataset for the development and evaluation of object detection models in the context of PCB defect detection.
PCB defects can be divided into two categories: functional defects and cosmetic defects. Functional defects can seriously affect the performance of PCB, which may lead to the abnormal usage of PCBs. These defects are the most serious defects. Cosmetic defects mainly affect the appearance of PCB, but also damage its performance in the long run due to abnormal heat dissipation and distribution of current. Among the two categories, there are six kinds of defects which frequently appear in the actual industrial scene. Here, authors mainly study these six known and common defects which contain missing hole, mouse bite, open circuit, short, spur, and spurious copper.
Some defects examples - a: Missing hole, b: Mouse bite, c: Open circuit, d: Short, e: Spur, f: Spurious copper.
In this figure, defect areas are indicated by thicker and red outlines.
| Type of Defects | Number of Images | Number of Defects |
|---|---|---|
| Missing Hole | 1832 | 3612 |
| Mouse Bite | 1852 | 3684 |
| Open Circuit | 1740 | 3548 |
| Short | 1732 | 3508 |
| Spur | 1752 | 3636 |
| Spurious Copper | 1760 | 3676 |
| Total | 10,668 | 21,664 |
Please note that the distribution of train/test/val does not match what the authors indicate in the article.
 Homepage
 Research Paper
Summary #
Augmented PCB Defect is a dataset for an object detection task. It is used in the manufacturing industry, and in the damage detection domain.
The dataset consists of 10668 images with 21664 labeled objects belonging to 6 different classes including mouse_bite, missing_hole, spurious_copper, and other: spur, open_circuit, and short.
Images in the Augmented PCB Defect dataset have bounding box annotations. All images are labeled (i.e. with annotations). There are 3 splits in the dataset: train (5120 images), val (3414 images), and test (2134 images). The dataset was released in 2019 by the Peking University and Shenzhen Skyworth-RGB Electronic, China.
Explore #
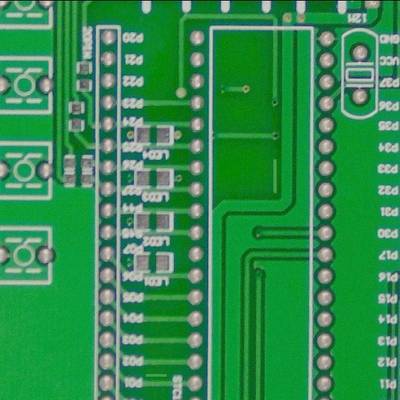
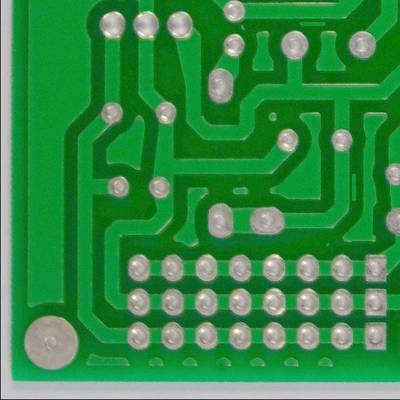
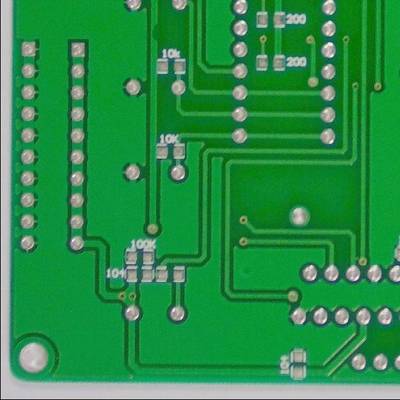
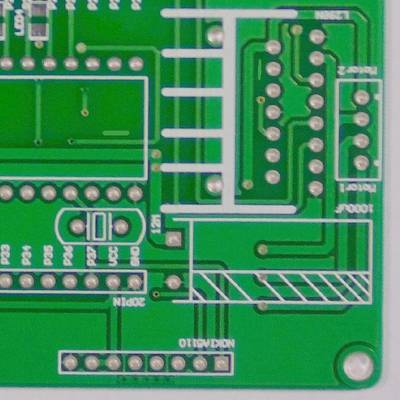
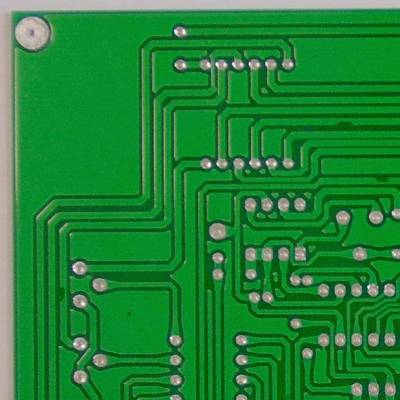
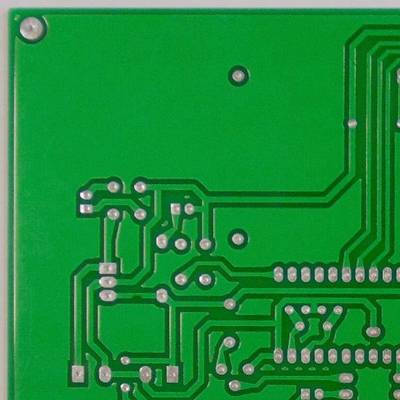
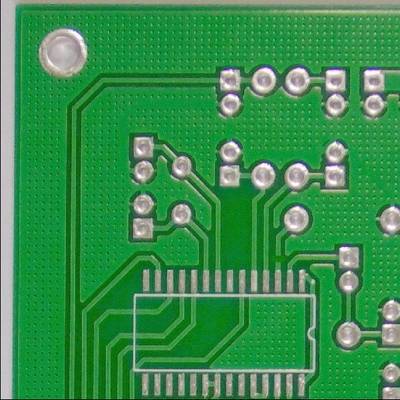
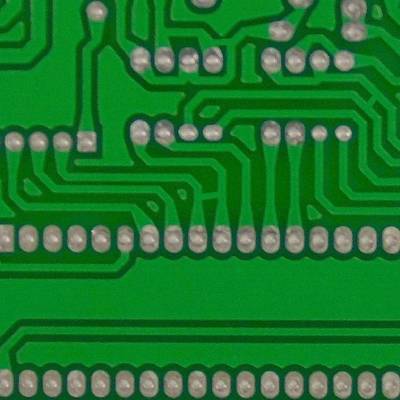
Augmented PCB Defect dataset has 10668 images. Click on one of the examples below or open "Explore" tool anytime you need to view dataset images with annotations. This tool has extended visualization capabilities like zoom, translation, objects table, custom filters and more. Hover the mouse over the images to hide or show annotations.


Class balance #
There are 6 annotation classes in the dataset. Find the general statistics and balances for every class in the table below. Click any row to preview images that have labels of the selected class. Sort by column to find the most rare or prevalent classes.

Class ㅤ | Images ㅤ | Objects ㅤ | Count on image average | Area on image average |
|---|---|---|---|---|
mouse_bite➔ rectangle | 1852 | 3684 | 1.99 | 0.44% |
missing_hole➔ rectangle | 1832 | 3612 | 1.97 | 0.53% |
spurious_copper➔ rectangle | 1760 | 3676 | 2.09 | 0.65% |
spur➔ rectangle | 1752 | 3636 | 2.08 | 0.62% |
open_circuit➔ rectangle | 1740 | 3548 | 2.04 | 0.32% |
short➔ rectangle | 1732 | 3508 | 2.03 | 0.85% |
Co-occurrence matrix #
Co-occurrence matrix is an extremely valuable tool that shows you the images for every pair of classes: how many images have objects of both classes at the same time. If you click any cell, you will see those images. We added the tooltip with an explanation for every cell for your convenience, just hover the mouse over a cell to preview the description.
Images #
Explore every single image in the dataset with respect to the number of annotations of each class it has. Click a row to preview selected image. Sort by any column to find anomalies and edge cases. Use horizontal scroll if the table has many columns for a large number of classes in the dataset.
Object distribution #
Interactive heatmap chart for every class with object distribution shows how many images are in the dataset with a certain number of objects of a specific class. Users can click cell and see the list of all corresponding images.
Class sizes #
The table below gives various size properties of objects for every class. Click a row to see the image with annotations of the selected class. Sort columns to find classes with the smallest or largest objects or understand the size differences between classes.
Class | Object count | Avg area | Max area | Min area | Min height | Min height | Max height | Max height | Avg height | Avg height | Min width | Min width | Max width | Max width |
|---|---|---|---|---|---|---|---|---|---|---|---|---|---|---|
mouse_bite rectangle | 3684 | 0.22% | 0.59% | 0.08% | 11px | 1.83% | 56px | 9.33% | 28px | 4.72% | 12px | 2% | 57px | 9.5% |
spurious_copper rectangle | 3676 | 0.31% | 1.73% | 0.09% | 10px | 1.67% | 116px | 19.33% | 35px | 5.88% | 11px | 1.83% | 115px | 19.17% |
spur rectangle | 3636 | 0.3% | 0.86% | 0.08% | 13px | 2.17% | 75px | 12.5% | 33px | 5.54% | 14px | 2.33% | 75px | 12.5% |
missing_hole rectangle | 3612 | 0.27% | 1.2% | 0.08% | 14px | 2.33% | 71px | 11.83% | 30px | 5.03% | 14px | 2.33% | 70px | 11.67% |
open_circuit rectangle | 3548 | 0.15% | 0.54% | 0.04% | 9px | 1.5% | 55px | 9.17% | 23px | 3.86% | 10px | 1.66% | 54px | 9% |
short rectangle | 3508 | 0.42% | 2.53% | 0.07% | 14px | 2.33% | 120px | 20% | 38px | 6.27% | 15px | 2.5% | 119px | 19.83% |
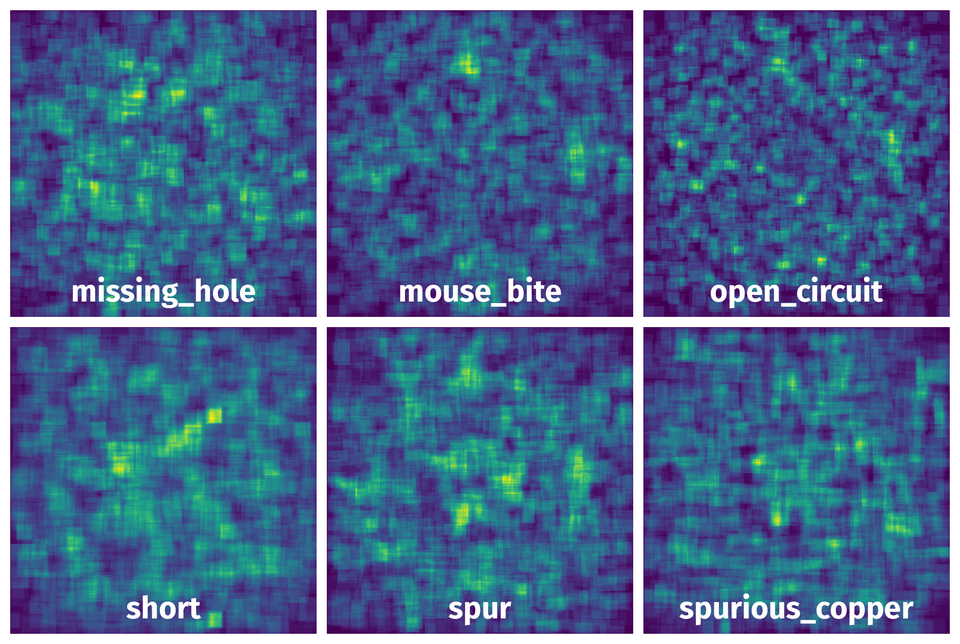
Spatial Heatmap #
The heatmaps below give the spatial distributions of all objects for every class. These visualizations provide insights into the most probable and rare object locations on the image. It helps analyze objects' placements in a dataset.
Objects #
Table contains all 21664 objects. Click a row to preview an image with annotations, and use search or pagination to navigate. Sort columns to find outliers in the dataset.
Object ID ㅤ | Class ㅤ | Image name click row to open | Image size height x width | Height ㅤ | Height ㅤ | Width ㅤ | Width ㅤ | Area ㅤ |
|---|---|---|---|---|---|---|---|---|
1➔ | spur rectangle | l_light_05_spur_01_4_600.jpg | 600 x 600 | 18px | 3% | 35px | 5.83% | 0.17% |
2➔ | spur rectangle | l_light_05_spur_01_4_600.jpg | 600 x 600 | 26px | 4.33% | 33px | 5.5% | 0.24% |
3➔ | spur rectangle | l_light_05_spur_01_1_600.jpg | 600 x 600 | 23px | 3.83% | 43px | 7.17% | 0.27% |
4➔ | short rectangle | light_09_short_03_5_600.jpg | 600 x 600 | 44px | 7.33% | 30px | 5% | 0.37% |
5➔ | short rectangle | light_09_short_03_5_600.jpg | 600 x 600 | 29px | 4.83% | 30px | 5% | 0.24% |
6➔ | short rectangle | light_09_short_03_5_600.jpg | 600 x 600 | 28px | 4.67% | 53px | 8.83% | 0.41% |
7➔ | short rectangle | light_09_short_03_5_600.jpg | 600 x 600 | 27px | 4.5% | 38px | 6.33% | 0.28% |
8➔ | open_circuit rectangle | l_light_10_open_circuit_06_3_600.jpg | 600 x 600 | 41px | 6.83% | 24px | 4% | 0.27% |
9➔ | open_circuit rectangle | l_light_10_open_circuit_06_3_600.jpg | 600 x 600 | 21px | 3.5% | 40px | 6.67% | 0.23% |
10➔ | spurious_copper rectangle | rotation_90_light_08_spurious_copper_10_1_600.jpg | 600 x 600 | 42px | 7% | 20px | 3.33% | 0.23% |
License #
License is unknown for the Augmented PCB Defect dataset.
Citation #
If you make use of the Augmented PCB Defect data, please cite the following reference:
@article{article,
  author = {Ding, Runwei and Dai, Linhui and Li, Guangpeng and Liu, Hong},
  year = {2019},
  month = {05},
  pages = {},
  title = {TDD-Net: A Tiny Defect Detection Network for Printed Circuit Boards},
  volume = {4},
  journal = {CAAI Transactions on Intelligence Technology},
  doi = {10.1049/trit.2019.0019}
}
If you are happy with Dataset Ninja and use provided visualizations and tools in your work, please cite us:
@misc{ visualization-tools-for-augmented-pcb-defect-dataset,
  title = { Visualization Tools for Augmented PCB Defect Dataset },
  type = { Computer Vision Tools },
  author = { Dataset Ninja },
  howpublished = { \url{ https://datasetninja.com/augmented-pcb-defect } },
  url = { https://datasetninja.com/augmented-pcb-defect },
  journal = { Dataset Ninja },
  publisher = { Dataset Ninja },
  year = { 2026 },
  month = { jul },
  note = { visited on 2026-07-24 },
}
Download #
Please visit dataset homepage to download the data.
Disclaimer #
Our gal from the legal dep told us we need to post this:
Dataset Ninja provides visualizations and statistics for some datasets that can be found online and can be downloaded by general audience. Dataset Ninja is not a dataset hosting platform and can only be used for informational purposes. The platform does not claim any rights for the original content, including images, videos, annotations and descriptions. Joint publishing is prohibited.
You take full responsibility when you use datasets presented at Dataset Ninja, as well as other information, including visualizations and statistics we provide. You are in charge of compliance with any dataset license and all other permissions. You are required to navigate datasets homepage and make sure that you can use it. In case of any questions, get in touch with us at hello@datasetninja.com.