
Introduction #
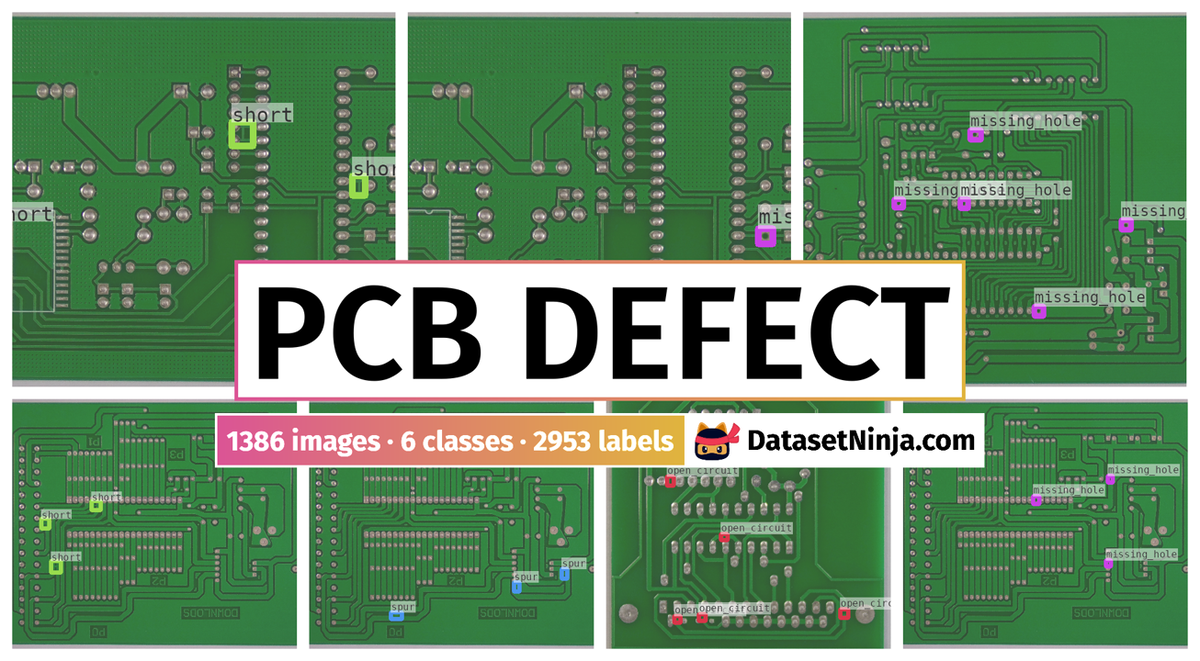
PCB Defect is a dataset tailored for an object detection task, encompassing 1386 images annotated with 2953 labeled objects across six distinct classes: open_circuit, short, spurious_copper, and other nuanced defects such as missing_hole, mouse_bite, and spur. Specifically curated for Tiny Defect Detection (TDD), the dataset is instrumental for advancing quality control measures in the production of printed circuit boards (PCBs), which is a fundamental and crucial aspect of manufacturing processes in the electronics industry.
To ensure the representativeness of the dataset, authors build a PCB image acquisition system that resembles the practical AOI system used in inspection process.
The PCB image acquisition system consisting of light source, workbench, support, camera and image process unit.
The image of template board is captured by a 16-megapixel HD industrial camera equipped with CMOS sensor, and it can be controlled by computer software or a remote control. In order to adapt to different PCB sizes and avoid edge distortion, an undistorted zoomable industrial lens is also mounted, the focal length can be adjusted between 6-12 mm and the maximum aperture is f1.6. Light source is also a key part of AOI, to avoid specular reflection of the board, possible shadows and minimize the effects of uneven illumination on subsequent steps, two frosted ring LED source equipped with special diffuse matting board are introduced to effectively overcome the adverse effects of illumination. The resolution of original photo is 4608×3456 pixels, which will be adjusted according to the size of each board when make defects.
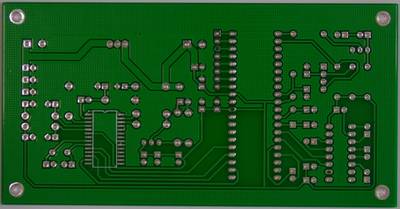
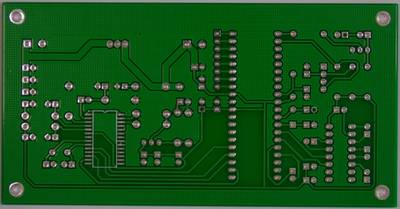
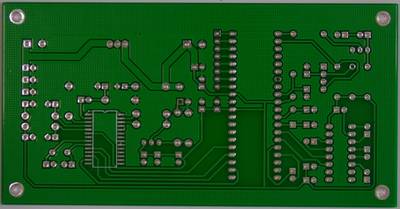
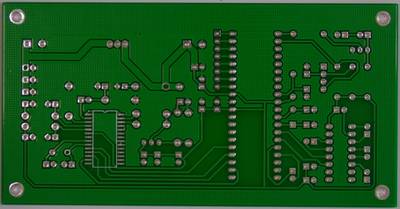
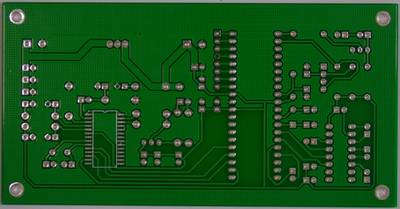
After getting cropped image, authors make 6 types of defects by photoshop, which is a graphics editor published by Adobe Systems. The defects authors defined are: missing hole, mouse bite, open circuit, short, spur, spurious copper. Each image in the dataset has 3 to 5 defects of the same category in different places. Besides, authors provide bounding box and coordinate information for every defect in every image, which is convenient for other researchers to know where the defect is. On some inspection platforms, PCB can be fixed by mechanical devices to maintain good position. However, on the assembly line, without fixing equipments, the position and the angle of the test PCB in the taken photo may distinguish from each other. Given this circumstance, in addition to the defects images with the same position as the templates, authors also provide images with random orientations to represent the situation where the image is not appropriately placed in practical detection process. The angular difference between each image and the corresponding template image is also given so that the designing and evaluating of registration algorithm could be implemented on these images.
Samples of the PCB with defects in the dataset, (a) is the defects image with the same position as template, (b) is the image with random orientation.
Moreover, rotation split has PCB images with orientations, and rotation angles
| Type of Defects | Number of Images | Number of Defects |
|---|---|---|
| Missing Hole | 115 | 497 |
| Mouse Bite | 115 | 492 |
| Open Circuit | 116 | 482 |
| Short | 116 | 491 |
| Spur | 115 | 488 |
| Spurious Copper | 116 | 503 |
| Total | 693 | 2953 |
Also, you can check the Augmented PCB Defect available on DatasetNinja based on this dataset.
 Homepage
 Research Paper
 Kaggle
Summary #
PCB Defect is a dataset for an object detection task. It is used in the manufacturing industry, and in the damage detection domain.
The dataset consists of 1386 images with 2953 labeled objects belonging to 6 different classes including open_circuit, short, spurious_copper, and other: missing_hole, mouse_bite, and spur.
Images in the PCB Defect dataset have bounding box annotations. There are 693 (50% of the total) unlabeled images (i.e. without annotations). There are 2 splits in the dataset: ds (693 images) and rotation (693 images). Also, the dataset includes subfolder and angle tags for rotation slit. The dataset was released in 2019 by the Peking University.
Explore #
PCB Defect dataset has 1386 images. Click on one of the examples below or open "Explore" tool anytime you need to view dataset images with annotations. This tool has extended visualization capabilities like zoom, translation, objects table, custom filters and more. Hover the mouse over the images to hide or show annotations.


Class balance #
There are 6 annotation classes in the dataset. Find the general statistics and balances for every class in the table below. Click any row to preview images that have labels of the selected class. Sort by column to find the most rare or prevalent classes.

Class ㅤ | Images ㅤ | Objects ㅤ | Count on image average | Area on image average |
|---|---|---|---|---|
spurious_copper➔ rectangle | 116 | 503 | 4.34 | 0.43% |
short➔ rectangle | 116 | 491 | 4.23 | 0.55% |
open_circuit➔ rectangle | 116 | 482 | 4.16 | 0.2% |
spur➔ rectangle | 115 | 488 | 4.24 | 0.39% |
mouse_bite➔ rectangle | 115 | 492 | 4.28 | 0.3% |
missing_hole➔ rectangle | 115 | 497 | 4.32 | 0.37% |
Co-occurrence matrix #
Co-occurrence matrix is an extremely valuable tool that shows you the images for every pair of classes: how many images have objects of both classes at the same time. If you click any cell, you will see those images. We added the tooltip with an explanation for every cell for your convenience, just hover the mouse over a cell to preview the description.
Images #
Explore every single image in the dataset with respect to the number of annotations of each class it has. Click a row to preview selected image. Sort by any column to find anomalies and edge cases. Use horizontal scroll if the table has many columns for a large number of classes in the dataset.
Object distribution #
Interactive heatmap chart for every class with object distribution shows how many images are in the dataset with a certain number of objects of a specific class. Users can click cell and see the list of all corresponding images.
Class sizes #
The table below gives various size properties of objects for every class. Click a row to see the image with annotations of the selected class. Sort columns to find classes with the smallest or largest objects or understand the size differences between classes.
Class | Object count | Avg area | Max area | Min area | Min height | Min height | Max height | Max height | Avg height | Avg height | Min width | Min width | Max width | Max width |
|---|---|---|---|---|---|---|---|---|---|---|---|---|---|---|
spurious_copper rectangle | 503 | 0.1% | 0.33% | 0.03% | 26px | 1.14% | 216px | 8.77% | 78px | 3.68% | 30px | 0.99% | 284px | 9.29% |
missing_hole rectangle | 497 | 0.09% | 0.38% | 0.03% | 39px | 1.78% | 141px | 6.75% | 69px | 3.27% | 40px | 1.35% | 140px | 6.13% |
mouse_bite rectangle | 492 | 0.07% | 0.2% | 0.02% | 27px | 1.17% | 121px | 5.73% | 62px | 2.89% | 26px | 0.86% | 123px | 4.69% |
short rectangle | 491 | 0.13% | 0.83% | 0.03% | 35px | 1.51% | 174px | 8.18% | 80px | 3.77% | 34px | 1.12% | 243px | 10.85% |
spur rectangle | 488 | 0.09% | 0.31% | 0.02% | 25px | 1.08% | 155px | 7.39% | 70px | 3.25% | 31px | 1.02% | 159px | 6.97% |
open_circuit rectangle | 482 | 0.05% | 0.18% | 0.01% | 24px | 1.04% | 93px | 4.61% | 51px | 2.37% | 25px | 0.82% | 110px | 4.91% |
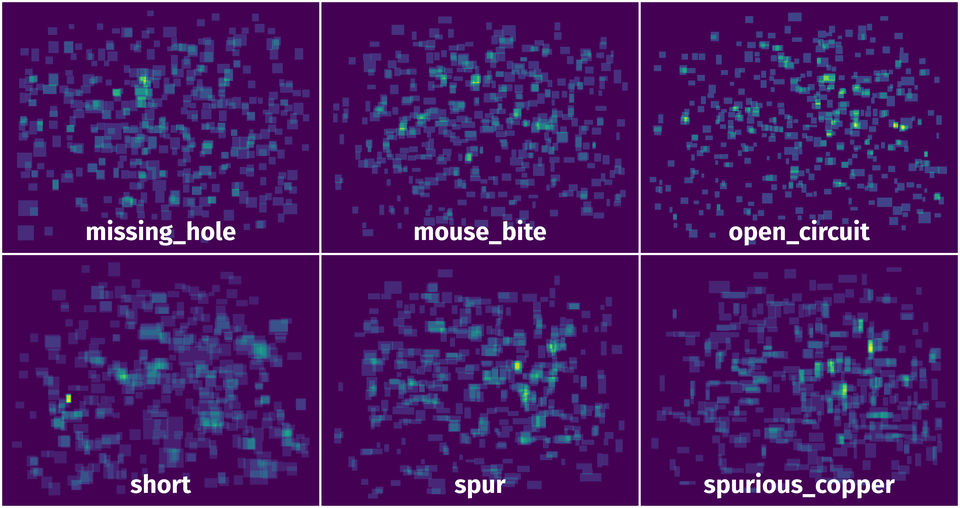
Spatial Heatmap #
The heatmaps below give the spatial distributions of all objects for every class. These visualizations provide insights into the most probable and rare object locations on the image. It helps analyze objects' placements in a dataset.
Objects #
Table contains all 2953 objects. Click a row to preview an image with annotations, and use search or pagination to navigate. Sort columns to find outliers in the dataset.
Object ID ㅤ | Class ㅤ | Image name click row to open | Image size height x width | Height ㅤ | Height ㅤ | Width ㅤ | Width ㅤ | Area ㅤ |
|---|---|---|---|---|---|---|---|---|
1➔ | spurious_copper rectangle | 12_spurious_copper_02.jpg | 2530 x 2529 | 112px | 4.43% | 52px | 2.06% | 0.09% |
2➔ | spurious_copper rectangle | 12_spurious_copper_02.jpg | 2530 x 2529 | 45px | 1.78% | 119px | 4.71% | 0.08% |
3➔ | spurious_copper rectangle | 12_spurious_copper_02.jpg | 2530 x 2529 | 41px | 1.62% | 94px | 3.72% | 0.06% |
4➔ | spurious_copper rectangle | 12_spurious_copper_02.jpg | 2530 x 2529 | 87px | 3.44% | 54px | 2.14% | 0.07% |
5➔ | spurious_copper rectangle | 12_spurious_copper_02.jpg | 2530 x 2529 | 85px | 3.36% | 53px | 2.1% | 0.07% |
6➔ | mouse_bite rectangle | 11_mouse_bite_07.jpg | 2248 x 2282 | 66px | 2.94% | 82px | 3.59% | 0.11% |
7➔ | mouse_bite rectangle | 11_mouse_bite_07.jpg | 2248 x 2282 | 88px | 3.91% | 104px | 4.56% | 0.18% |
8➔ | mouse_bite rectangle | 11_mouse_bite_07.jpg | 2248 x 2282 | 92px | 4.09% | 91px | 3.99% | 0.16% |
9➔ | mouse_bite rectangle | 11_mouse_bite_07.jpg | 2248 x 2282 | 58px | 2.58% | 88px | 3.86% | 0.1% |
10➔ | mouse_bite rectangle | 11_mouse_bite_07.jpg | 2248 x 2282 | 50px | 2.22% | 61px | 2.67% | 0.06% |
License #
License is unknown for the PCB Defect dataset.
Citation #
If you make use of the PCB Defect data, please cite the following reference:
@misc{huang2019pcb,
  title={A PCB Dataset for Defects Detection and Classification},
  author={Weibo Huang and Peng Wei},
  year={2019},
  eprint={1901.08204},
  archivePrefix={arXiv},
  primaryClass={cs.CV}
}
If you are happy with Dataset Ninja and use provided visualizations and tools in your work, please cite us:
@misc{ visualization-tools-for-pcb-defect-dataset,
  title = { Visualization Tools for PCB Defect Dataset },
  type = { Computer Vision Tools },
  author = { Dataset Ninja },
  howpublished = { \url{ https://datasetninja.com/pcb-defect } },
  url = { https://datasetninja.com/pcb-defect },
  journal = { Dataset Ninja },
  publisher = { Dataset Ninja },
  year = { 2026 },
  month = { jul },
  note = { visited on 2026-07-19 },
}
Download #
Please visit dataset homepage to download the data.
Disclaimer #
Our gal from the legal dep told us we need to post this:
Dataset Ninja provides visualizations and statistics for some datasets that can be found online and can be downloaded by general audience. Dataset Ninja is not a dataset hosting platform and can only be used for informational purposes. The platform does not claim any rights for the original content, including images, videos, annotations and descriptions. Joint publishing is prohibited.
You take full responsibility when you use datasets presented at Dataset Ninja, as well as other information, including visualizations and statistics we provide. You are in charge of compliance with any dataset license and all other permissions. You are required to navigate datasets homepage and make sure that you can use it. In case of any questions, get in touch with us at hello@datasetninja.com.