Introduction #
This is the Images 10K part of the BDD100K: A Diverse Driving Dataset for Heterogeneous Multitask Learning, which is the largest driving video dataset with 100K videos and 10 tasks, providing a comprehensive evaluation platform for image recognition algorithms in autonomous driving. The dataset boasts geographic, environmental, and weather diversity, enhancing the robustness of trained models. Through BDD100K, the authors establish a benchmark for heterogeneous multitask learning, demonstrating the need for specialized training strategies for existing models to handle such diverse tasks, thereby opening avenues for future research in this domain.
Currently, the following datasets are presented on a DatasetNinja platform:
- BDD100K: Images 100K (available on DatasetNinja)
- BDD100K: Images 10K (current)
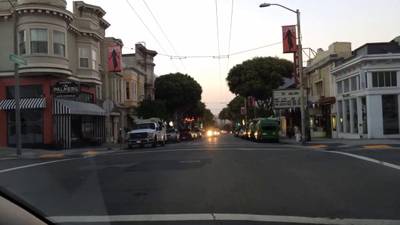
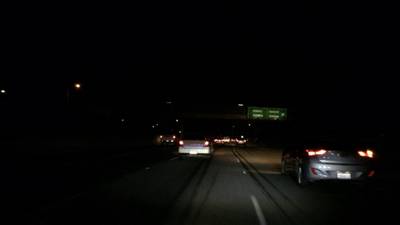
The dataset includes a diverse set of driving videos under various weather conditions, time, and scene types. The dataset also comes with a rich set of annotations: scene tagging, object bounding box, lane marking, drivable area, full-framesemantic and instance segmentation, multiple object tracking, and multiple object tracking with segmentation.
The authors construct BDD100K as a diverse and large-scale dataset of visual driving scenes. This dataset overcomes limitations by collecting over 100K diverse video clips, covering various driving scenarios, and capturing a broad range of appearance variations and pose configurations. The benchmarks encompass ten tasks, including image tagging, lane detection, drivable area segmentation, road object detection, semantic segmentation, instance segmentation, multi-object detection tracking, multi-object segmentation tracking, domain adaptation, and imitation learning. These diverse tasks enable the study of heterogeneous multitask learning, and the authors conduct extensive evaluations of existing algorithms on the new benchmarks, shedding light on the challenges of designing a single model for multiple tasks.
Geographical distribution of the data sources. Each dot represents the starting location of every video clip. The videos are from
many cities and regions in the populous areas in the US.
Instance statistics of our object categories. (a) Number of instances of each category, which follows a long-tail distribution. (b) Roughly half of the instances are occluded. (c) About 7% of the instances are truncated.
To provide a large-scale diverse driving video dataset, the authors utilize a crowdsourcing approach with contributions from tens of thousands of drivers, supported by Nexar. BDD100K includes over 100K driving videos, each 40 seconds long, collected from more than 50K rides across locations like New York and the San Francisco Bay Area, offering diverse scene types and weather conditions. The dataset is split into training, validation, and testing sets, with annotations for image tasks at the 10th second in each video and the entire sequences used for tracking tasks.
Tasks
The Image tagging involves annotations for weather conditions, scene types, and times of day. Object detection includes bounding box annotations for 10 categories, while lane marking involves labeling with eight main categories, continuity, and direction attributes. Drivable area detection distinguishes between directly and alternatively drivable areas. Semantic instance segmentation provides pixel-level annotations for 40 object classes in images randomly sampled from the dataset.
The authors present their dataset as an essential resource for advancing research in street-scene understanding, offering unparalleled diversity and complexity for evaluating algorithms in the domain of autonomous driving.
Summary #
BDD100K: A Diverse Driving Dataset for Heterogeneous Multitask Learning (Images 10K) is a dataset for instance segmentation, semantic segmentation, and object detection tasks. It is used in the automotive industry.
The dataset consists of 10000 images with 205552 labeled objects belonging to 10 different classes including car, pedestrian, truck, and other: bus, bicycle, rider, motorcycle, caravan, trailer, and train.
Images in the BDD100K: Images 10K dataset have pixel-level instance segmentation annotations. Due to the nature of the instance segmentation task, it can be automatically transformed into a semantic segmentation (only one mask for every class) or object detection (bounding boxes for every object) tasks. There are 2128 (21% of the total) unlabeled images (i.e. without annotations). There are 3 splits in the dataset: train (7000 images), test (2000 images), and val (1000 images). The dataset was released in 2020 by the UC Berkeley, USA, Cornell University, USA, UC San Diego, USA, and Element, Inc.
Here are the visualized examples for the classes:
Explore #
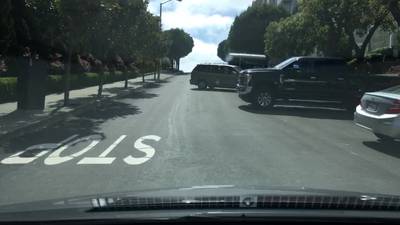
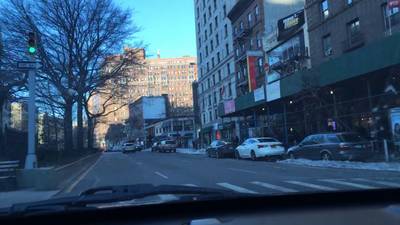
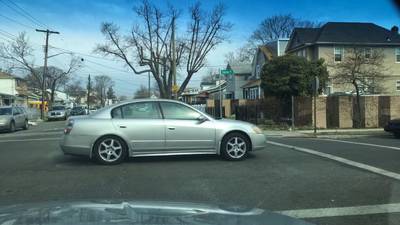
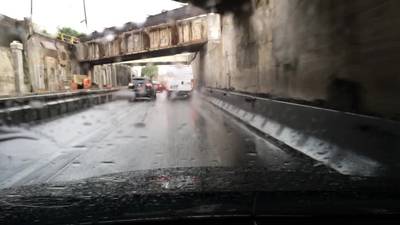
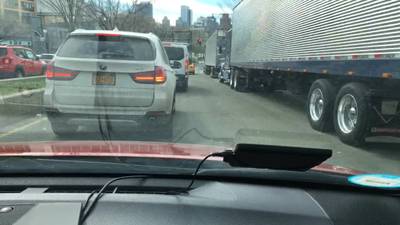
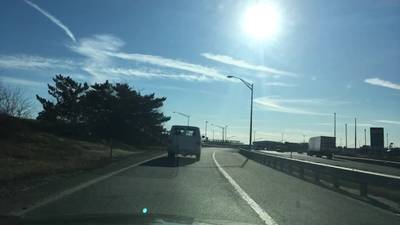
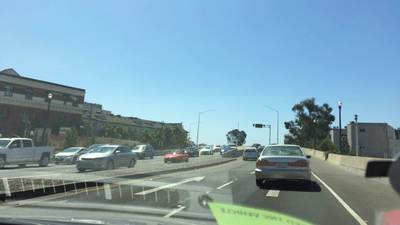
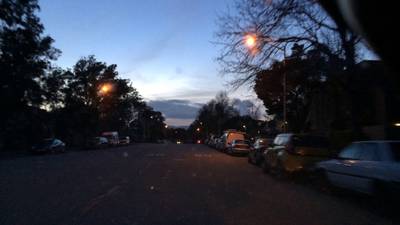
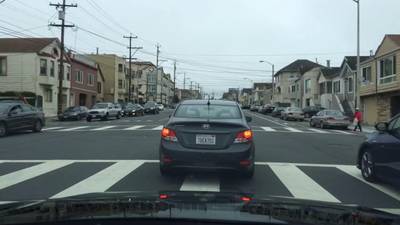
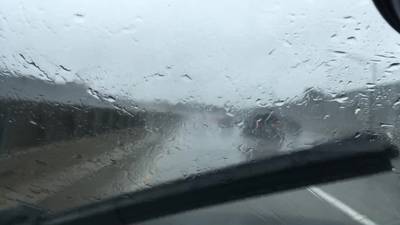
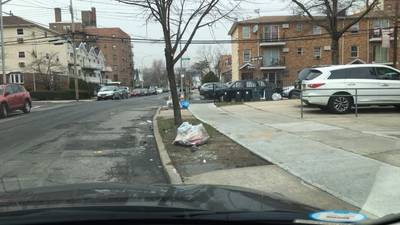
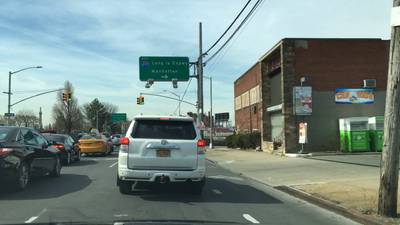
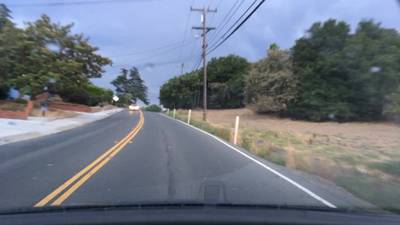
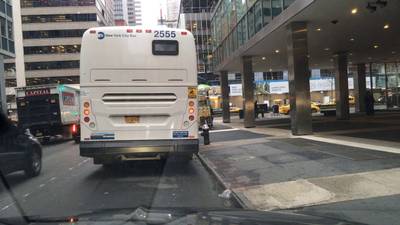
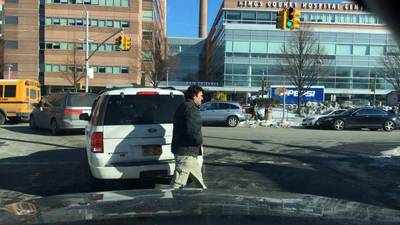
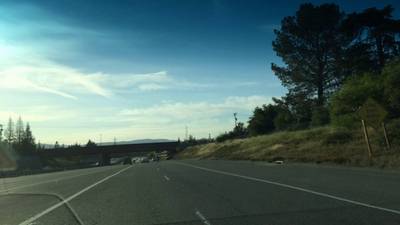
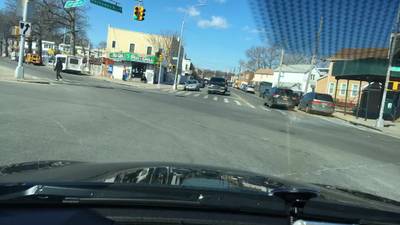
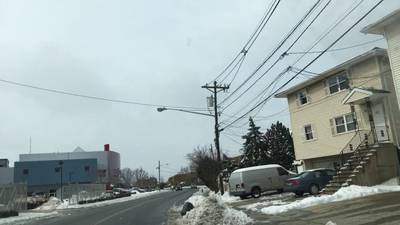
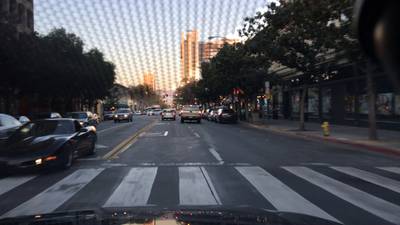
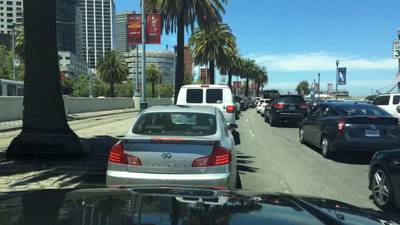
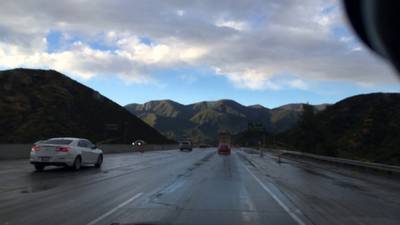
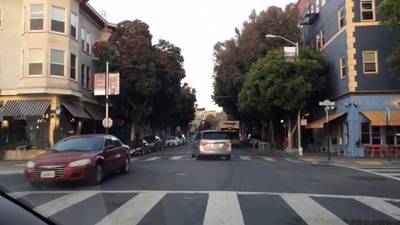
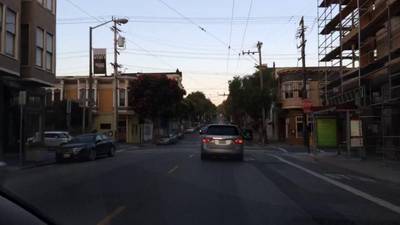
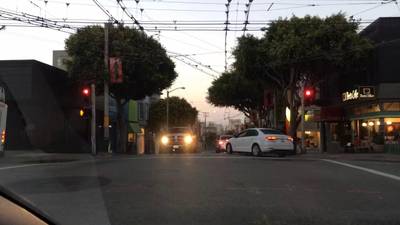
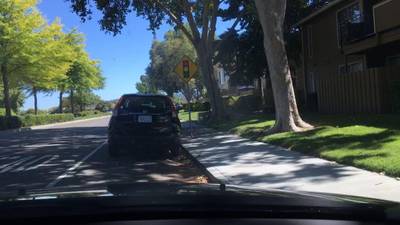
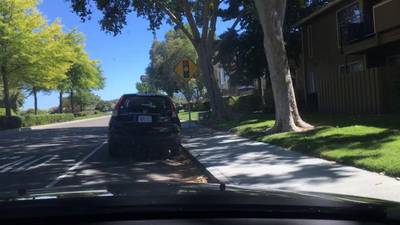
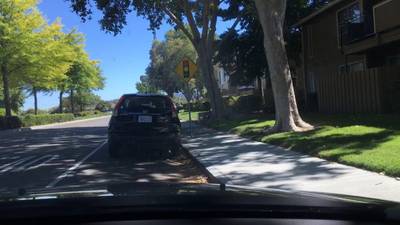
BDD100K: Images 10K dataset has 10000 images. Click on one of the examples below or open "Explore" tool anytime you need to view dataset images with annotations. This tool has extended visualization capabilities like zoom, translation, objects table, custom filters and more. Hover the mouse over the images to hide or show annotations.






























Class balance #
There are 10 annotation classes in the dataset. Find the general statistics and balances for every class in the table below. Click any row to preview images that have labels of the selected class. Sort by column to find the most rare or prevalent classes.
Class ㅤ | Images ㅤ | Objects ㅤ | Count on image average | Area on image average |
|---|---|---|---|---|
car➔ any | 7793 | 165787 | 21.27 | 10.95% |
pedestrian➔ any | 2829 | 22386 | 7.91 | 1.26% |
truck➔ any | 2478 | 8558 | 3.45 | 4.35% |
bus➔ any | 1191 | 3720 | 3.12 | 5.03% |
bicycle➔ any | 497 | 1928 | 3.88 | 1.23% |
rider➔ any | 402 | 1053 | 2.62 | 0.79% |
motorcycle➔ any | 313 | 920 | 2.94 | 1.16% |
caravan➔ any | 259 | 825 | 3.19 | 4.3% |
trailer➔ any | 88 | 230 | 2.61 | 6.25% |
train➔ any | 55 | 145 | 2.64 | 3.32% |
Co-occurrence matrix #
Co-occurrence matrix is an extremely valuable tool that shows you the images for every pair of classes: how many images have objects of both classes at the same time. If you click any cell, you will see those images. We added the tooltip with an explanation for every cell for your convenience, just hover the mouse over a cell to preview the description.
Images #
Explore every single image in the dataset with respect to the number of annotations of each class it has. Click a row to preview selected image. Sort by any column to find anomalies and edge cases. Use horizontal scroll if the table has many columns for a large number of classes in the dataset.
Class sizes #
The table below gives various size properties of objects for every class. Click a row to see the image with annotations of the selected class. Sort columns to find classes with the smallest or largest objects or understand the size differences between classes.
Class | Object count | Avg area | Max area | Min area | Min height | Min height | Max height | Max height | Avg height | Avg height | Min width | Min width | Max width | Max width |
|---|---|---|---|---|---|---|---|---|---|---|---|---|---|---|
car any | 165787 | 0.96% | 93.19% | 0% | 1px | 0.14% | 706px | 98.06% | 58px | 8.05% | 1px | 0.08% | 1280px | 100% |
pedestrian any | 22386 | 0.26% | 46.25% | 0% | 1px | 0.14% | 609px | 84.58% | 64px | 8.86% | 1px | 0.08% | 1280px | 100% |
truck any | 8558 | 2.2% | 75.86% | 0% | 2px | 0.28% | 720px | 100% | 97px | 13.48% | 2px | 0.16% | 1280px | 100% |
bus any | 3720 | 2.84% | 93.27% | 0% | 3px | 0.42% | 720px | 100% | 108px | 14.99% | 2px | 0.16% | 1280px | 100% |
bicycle any | 1928 | 0.54% | 28.04% | 0% | 1px | 0.14% | 469px | 65.14% | 57px | 7.88% | 1px | 0.08% | 1280px | 100% |
rider any | 1053 | 0.45% | 15.38% | 0% | 2px | 0.28% | 443px | 61.53% | 75px | 10.44% | 2px | 0.16% | 366px | 28.59% |
motorcycle any | 920 | 0.63% | 17.16% | 0% | 2px | 0.28% | 351px | 48.75% | 65px | 9.04% | 2px | 0.16% | 648px | 50.62% |
caravan any | 825 | 2.4% | 39.6% | 0% | 5px | 0.69% | 720px | 100% | 109px | 15.1% | 3px | 0.23% | 581px | 45.39% |
trailer any | 230 | 3.93% | 73.33% | 0% | 14px | 1.94% | 582px | 80.83% | 133px | 18.41% | 4px | 0.31% | 1280px | 100% |
train any | 145 | 2.04% | 30.04% | 0.02% | 9px | 1.25% | 572px | 79.44% | 97px | 13.42% | 19px | 1.48% | 618px | 48.28% |
Spatial Heatmap #
The heatmaps below give the spatial distributions of all objects for every class. These visualizations provide insights into the most probable and rare object locations on the image. It helps analyze objects' placements in a dataset.

Objects #
Table contains all 97888 objects. Click a row to preview an image with annotations, and use search or pagination to navigate. Sort columns to find outliers in the dataset.
Object ID ㅤ | Class ㅤ | Image name click row to open | Image size height x width | Height ㅤ | Height ㅤ | Width ㅤ | Width ㅤ | Area ㅤ |
|---|---|---|---|---|---|---|---|---|
1➔ | car any | 8a286021-385f1357.jpg | 720 x 1280 | 31px | 4.31% | 39px | 3.05% | 0.11% |
2➔ | car any | 8a286021-385f1357.jpg | 720 x 1280 | 31px | 4.31% | 39px | 3.05% | 0.13% |
3➔ | car any | 8a286021-385f1357.jpg | 720 x 1280 | 113px | 15.69% | 285px | 22.27% | 2.67% |
4➔ | car any | 8a286021-385f1357.jpg | 720 x 1280 | 113px | 15.69% | 285px | 22.27% | 3.49% |
5➔ | pedestrian any | 8a286021-385f1357.jpg | 720 x 1280 | 52px | 7.22% | 22px | 1.72% | 0.06% |
6➔ | pedestrian any | 8a286021-385f1357.jpg | 720 x 1280 | 52px | 7.22% | 22px | 1.72% | 0.12% |
7➔ | pedestrian any | 8a286021-385f1357.jpg | 720 x 1280 | 60px | 8.33% | 23px | 1.8% | 0.09% |
8➔ | pedestrian any | 8a286021-385f1357.jpg | 720 x 1280 | 60px | 8.33% | 23px | 1.8% | 0.15% |
9➔ | pedestrian any | 8a286021-385f1357.jpg | 720 x 1280 | 74px | 10.28% | 26px | 2.03% | 0.11% |
10➔ | pedestrian any | 8a286021-385f1357.jpg | 720 x 1280 | 74px | 10.28% | 26px | 2.03% | 0.21% |
License #
Copyright ©2018. The Regents of the University of California (Regents). All Rights Reserved.
THIS SOFTWARE AND/OR DATA WAS DEPOSITED IN THE BAIR OPEN RESEARCH COMMONS REPOSITORY ON 1/1/2021
Permission to use, copy, modify, and distribute this software and its documentation for educational, research, and not-for-profit purposes, without fee and without a signed licensing agreement; and permission to use, copy, modify and distribute this software for commercial purposes (such rights not subject to transfer) to BDD and BAIR Commons members and their affiliates, is hereby granted, provided that the above copyright notice, this paragraph and the following two paragraphs appear in all copies, modifications, and distributions. Contact The Office of Technology Licensing, UC Berkeley, 2150 Shattuck Avenue, Suite 510, Berkeley, CA 94720-1620, (510) 643-7201, otl@berkeley.edu, http://ipira.berkeley.edu/industry-info for commercial licensing opportunities.
IN NO EVENT SHALL REGENTS BE LIABLE TO ANY PARTY FOR DIRECT, INDIRECT, SPECIAL, INCIDENTAL, OR CONSEQUENTIAL DAMAGES, INCLUDING LOST PROFITS, ARISING OUT OF THE USE OF THIS SOFTWARE AND ITS DOCUMENTATION, EVEN IF REGENTS HAS BEEN ADVISED OF THE POSSIBILITY OF SUCH DAMAGE.
REGENTS SPECIFICALLY DISCLAIMS ANY WARRANTIES, INCLUDING, BUT NOT LIMITED TO, THE IMPLIED WARRANTIES OF MERCHANTABILITY AND FITNESS FOR A PARTICULAR PURPOSE. THE SOFTWARE AND ACCOMPANYING DOCUMENTATION, IF ANY, PROVIDED HEREUNDER IS PROVIDED “AS IS”. REGENTS HAS NO OBLIGATION TO PROVIDE MAINTENANCE, SUPPORT, UPDATES, ENHANCEMENTS, OR MODIFICATIONS.
Citation #
If you make use of the BDD100K: Images 10K data, please cite the following reference:
@dataset{BDD100K: Images 10K,
  author={Fisher Yu and Haofeng Chen and Xin Wang and Wenqi Xian and Yingying Chen and Fangchen Liu and Vashisht Madhavan and Trevor Darrell},
  title={BDD100K: A Diverse Driving Dataset for Heterogeneous Multitask Learning (Images 100K)},
  year={2020},
  url={https://www.bdd100k.com/}
}
If you are happy with Dataset Ninja and use provided visualizations and tools in your work, please cite us:
@misc{ visualization-tools-for-bdd100k-10k-dataset,
  title = { Visualization Tools for BDD100K: Images 10K Dataset },
  type = { Computer Vision Tools },
  author = { Dataset Ninja },
  howpublished = { \url{ https://datasetninja.com/bdd100k-10k } },
  url = { https://datasetninja.com/bdd100k-10k },
  journal = { Dataset Ninja },
  publisher = { Dataset Ninja },
  year = { 2026 },
  month = { feb },
  note = { visited on 2026-02-23 },
}
Download #
Dataset BDD100K: Images 10K can be downloaded in Supervisely format:
As an alternative, it can be downloaded with dataset-tools package:
pip install --upgrade dataset-tools
… using following python code:
import dataset_tools as dtools

dtools.download(dataset='BDD100K: Images 10K', dst_dir='~/dataset-ninja/')
Make sure not to overlook the python code example available on the Supervisely Developer Portal. It will give you a clear idea of how to effortlessly work with the downloaded dataset.
The data in original format can be downloaded here.
Disclaimer #
Our gal from the legal dep told us we need to post this:
Dataset Ninja provides visualizations and statistics for some datasets that can be found online and can be downloaded by general audience. Dataset Ninja is not a dataset hosting platform and can only be used for informational purposes. The platform does not claim any rights for the original content, including images, videos, annotations and descriptions. Joint publishing is prohibited.
You take full responsibility when you use datasets presented at Dataset Ninja, as well as other information, including visualizations and statistics we provide. You are in charge of compliance with any dataset license and all other permissions. You are required to navigate datasets homepage and make sure that you can use it. In case of any questions, get in touch with us at hello@datasetninja.com.


