

Introduction #
The authors present the BSTLD: Bosch Small Traffic Lights Dataset, an accurate dataset for vision-based traffic light detection. Vision-only based traffic light detection and tracking is a vital step on the way to fully automated driving in urban environments. The authors hope that this dataset allows for easy testing of objection detection approaches, especially for small objects in larger images.
Note, similar BSTLD: Bosch Small Traffic Lights Dataset datasets are also available on the DatasetNinja.com:
Motivation
Accurate detection and classification of traffic lights are vital for the success of automated driving in urban settings. Presently, there is a lack of systems capable of reliably perceiving traffic lights in real-time, without relying on map-based information, and from adequate distances necessary for seamless urban driving. While automated driving on highways has garnered considerable research attention, urban environments present a fresh set of challenges demanding more sophisticated algorithms across various domains, including perception, behavioral planning, and collision avoidance systems.
Within the realm of perception, identifying and categorizing traffic signs and lights stands out as a critical task. Traffic lights, in particular, pose a formidable challenge due to their small size and potential confusion with other urban elements such as lamps, decorations, and reflections. Recent advancements in deep neural networks have significantly enhanced various fields of machine learning, particularly computer vision. Deep learning techniques have been successfully employed for tasks such as image classification, end-to-end object detection, pixel-precise object segmentation, and numerous other applications.
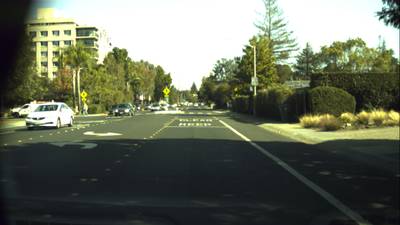
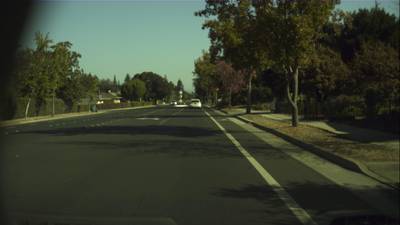
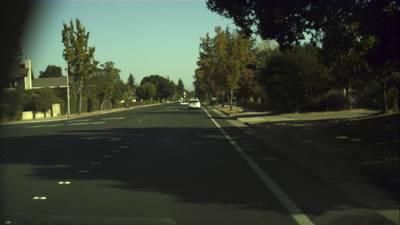
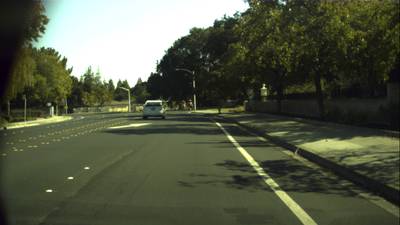
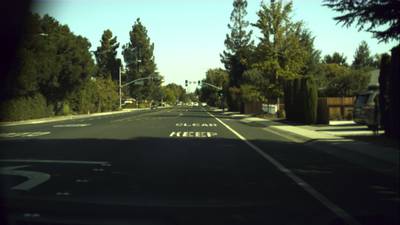
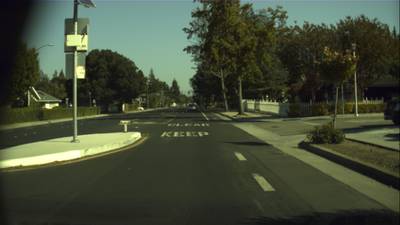
Sample detections of small traffic lights in an image. The top image is taken at the full resolution of 1280 × 720. At the bottom, the enlarged crop shows detected traffic lights of size about 6 × 12 pixels. All lights are correctly classified as yellow.
Dataset description
The authors publish the Bosch Small Traffic Lights Dataset, an accurately labeled dataset for detecting, classifying, and tracking traffic lights. Dataset contains RGB color images at the resolution of 1280 × 720 pixels. For training, the authors collected more than 5000 images, mainly along El Camino Real in the San Francisco Bay Area in California. Overall, 10,756 traffic lights are labeled within those images. The different traffic light sizes within the training set vary between approximately 1 and 85 pixels in width with the mean of 11.3 pixels.
| Width | Height | Area | |
|---|---|---|---|
| Minimum | 1.12 | 0.25 | 0.28 |
| Average | 11.18 | 24.32 | 404.52 |
| Median | 8.55 | 18.93 | 158.8 |
| Maximum | 98.0 | 207.0 | 20286.0 |
Training set bounding box sizes in pixels.
The label distribution of the different traffic light states is heavily skewed towards the three most common types which are green, red, and yellow. Also, because of the difference between the sampling frequency of our camera and the traffic light refresh rate, a lot of traffic lights frequently appear to be off. Whenever this is the case, the authors opted for labeling them as off instead of their current state.
| Training | In % | Test | In % | |
|---|---|---|---|---|
| Red | 3057 | 28.42 | 5321 | 39.44 |
| Red Straight | 9 | 0.08 | 0 | 0 |
| Red Straight Left | 1 | 0.01 | 0 | 0 |
| Red Left | 1092 | 10.15 | 0 | 0 |
| Red Right | 5 | 0.05 | 0 | 0 |
| Yellow | 444 | 4.13 | 154 | 0.01 |
| Green | 5207 | 48.41 | 7569 | 56.10 |
| Green Straight | 20 | 0.19 | 0 | 0 |
| Green Straight Left | 1 | 0.01 | 0 | 0 |
| Green Straight Right | 3 | 0.03 | 0 | 0 |
| Green Left | 178 | 1.65 | 0 | 0 |
| Green Right | 13 | 0.12 | 0 | 0 |
| Off | 726 | 6.75 | 449 | 0.03 |
Label distribution over the training and test set.
For testing, the authors collected a stereo video sequence with odometry along University Avenue in Palo Alto, California. In contrast to the training images, those images are taken and labeled consecutively at a frequency of 15.6 frames per second. Since the bounding boxes are labeled consecutively, it is possible to evaluate a tracker on them. In total, the test set comprises 8,334 labeled image files, encompassing 13,493 traffic lights. Notably, 2,094 of these lights are labeled despite being obscured by various objects. Remarkably, our test set exclusively includes labels for traffic lights in off, green, red, and yellow states. Table III offers a comprehensive breakdown of the diverse sizes of traffic lights within our test set. This dataset is intended to serve as a rigorous benchmark for the detection of traffic lights, or more broadly, small objects within images. Additionally, the authors present our findings as a baseline using this dataset.
| Width | Height | Area | |
|---|---|---|---|
| Minimum | 1.875 | 3.250 | 11.718 |
| Average | 9.430 | 26.745 | 313.349 |
| Median | 8.500 | 24.500 | 212.109 |
| Maximum | 48.375 | 104.500 | 4734.000 |
Test set traffic light bounding box sizes in pixels.
Identifying objects within images presents significant challenges, particularly when aiming for consistent performance in real-time across a spectrum of object sizes. In the case of traffic lights, achieving real-time detection with minimal false negatives and false positives is imperative. A high false negative rate can result in missed traffic lights, an outcome deemed unacceptable for autonomous vehicles. Conversely, false positive detections can induce erratic behavior in automated vehicles, such as halting for non-existent red traffic lights.
Proposed neural network
The YOLO architecture has demonstrated impressive performance on datasets like PASCAL VOC 2007 and 2012, achieving processing speeds of up to 45 frames per second. However, a grid-based approach to detection presents limitations, particularly in suggesting bounding boxes per cell. Authors have noted difficulties in detecting small objects and clusters of objects. Additionally, there’s a challenge in balancing image input sizes, processing speed, and memory usage. Given that the average width of traffic lights in our datasets is only 10 pixels, adjustments are necessary to enable the network to detect small objects effectively. To address this, the authors have implemented a multi-step approach. Instead of feeding the entire image into the network, they partition the image into different patches and evaluate each patch separately. During training, random crops of the image are utilized as inputs to the network, leading to improved convergence speed and accuracy. For the final detection phase, they focus on three specific crops in the upper part of the image, as this is where most traffic lights are typically located. The authors have also developed a heatmap to visualize the occurrences of traffic lights. Each network has a receptive field of 448 × 448 pixels, allowing for comprehensive analysis of the image data.
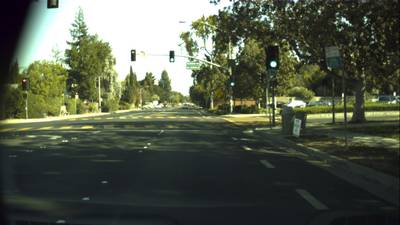
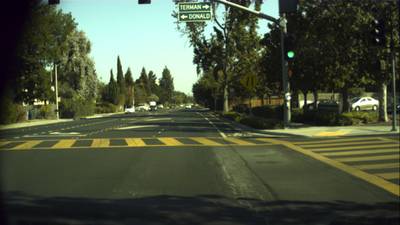
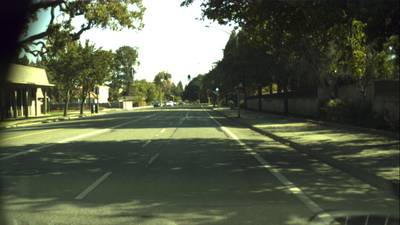
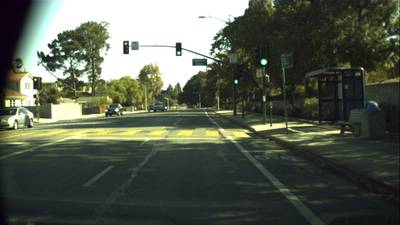
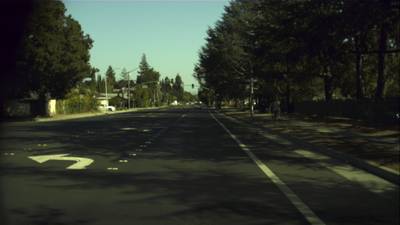
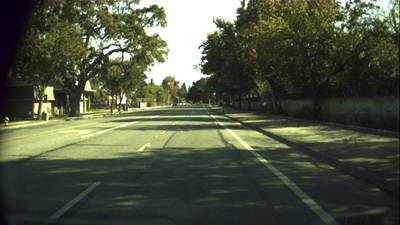
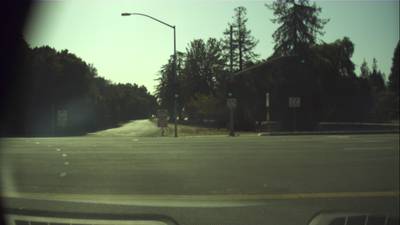
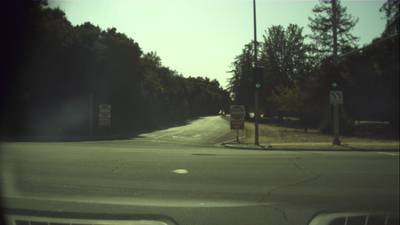
Sample image from test-set. The authors network is evaluated at the positions within the image, shown in red, teal, and yellow. Two green traffic lights are detected, one by a cell of the yellow network, the other by red.
 Homepage
 Research Paper
 GitHub
Summary #
BSTLD: Bosch Small Traffic Lights Dataset is a dataset for an object detection task. It is used in the automotive industry.
The dataset consists of 13427 images with 24241 labeled objects belonging to 4 different classes including green, red, off, and other: yellow.
Images in the BSTLD dataset have bounding box annotations. There are 3127 (23% of the total) unlabeled images (i.e. without annotations). There are 2 splits in the dataset: test (8334 images) and train (5093 images). Alternatively, the dataset could be split into 6 sequences: 2015-10-05-14-40-46_bag (1546 images), 2015-10-05-11-26-32_bag (651 images), 2015-10-05-10-55-33_bag (540 images), 2017-02-03-11-44-56_los_altos_mountain_view_traffic_lights_bag (518 images), 2015-05-29-15-29-39_arastradero_traffic_light_loop_bag (347 images), and 2015-10-05-10-52-01_bag (68 images), or into 5 traffic light direction: left (1270 objects), straight (29 objects), right (18 objects), straight right (3 objects), and straight left (2 objects). Additionally, labels contains information about occluded. Explore it in supervisely labeling tool. The dataset was released in 2017 by the Bosch Automated Driving Team, Czech.
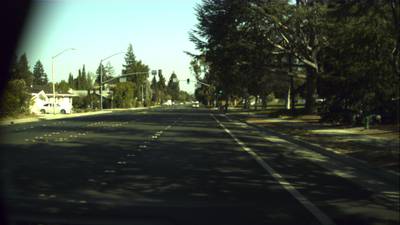
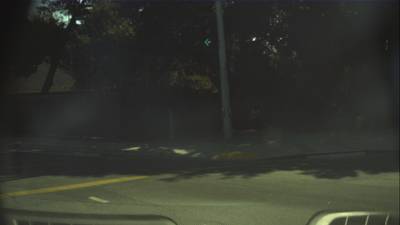
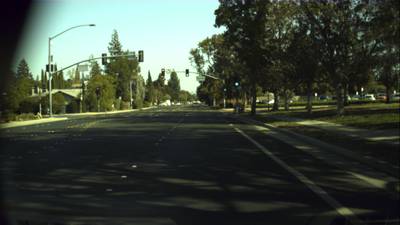
Explore #
BSTLD dataset has 13427 images. Click on one of the examples below or open "Explore" tool anytime you need to view dataset images with annotations. This tool has extended visualization capabilities like zoom, translation, objects table, custom filters and more. Hover the mouse over the images to hide or show annotations.


Class balance #
There are 4 annotation classes in the dataset. Find the general statistics and balances for every class in the table below. Click any row to preview images that have labels of the selected class. Sort by column to find the most rare or prevalent classes.

Class ㅤ | Images ㅤ | Objects ㅤ | Count on image average | Area on image average |
|---|---|---|---|---|
green➔ rectangle | 6617 | 12990 | 1.96 | 0.09% |
red➔ rectangle | 5213 | 9485 | 1.82 | 0.07% |
off➔ rectangle | 930 | 1168 | 1.26 | 0.04% |
yellow➔ rectangle | 394 | 598 | 1.52 | 0.06% |
Co-occurrence matrix #
Co-occurrence matrix is an extremely valuable tool that shows you the images for every pair of classes: how many images have objects of both classes at the same time. If you click any cell, you will see those images. We added the tooltip with an explanation for every cell for your convenience, just hover the mouse over a cell to preview the description.
Images #
Explore every single image in the dataset with respect to the number of annotations of each class it has. Click a row to preview selected image. Sort by any column to find anomalies and edge cases. Use horizontal scroll if the table has many columns for a large number of classes in the dataset.
Object distribution #
Interactive heatmap chart for every class with object distribution shows how many images are in the dataset with a certain number of objects of a specific class. Users can click cell and see the list of all corresponding images.
Class sizes #
The table below gives various size properties of objects for every class. Click a row to see the image with annotations of the selected class. Sort columns to find classes with the smallest or largest objects or understand the size differences between classes.
Class | Object count | Avg area | Max area | Min area | Min height | Min height | Max height | Max height | Avg height | Avg height | Min width | Min width | Max width | Max width |
|---|---|---|---|---|---|---|---|---|---|---|---|---|---|---|
green rectangle | 12990 | 0.05% | 2.23% | 0% | 4px | 0.56% | 208px | 28.89% | 28px | 3.9% | 3px | 0.23% | 99px | 7.73% |
red rectangle | 9485 | 0.04% | 1.02% | 0% | 4px | 0.56% | 154px | 21.39% | 25px | 3.53% | 3px | 0.23% | 95px | 7.42% |
off rectangle | 1168 | 0.04% | 0.66% | 0% | 5px | 0.69% | 108px | 15% | 22px | 3.03% | 3px | 0.23% | 65px | 5.08% |
yellow rectangle | 598 | 0.04% | 0.7% | 0% | 5px | 0.69% | 119px | 16.53% | 23px | 3.22% | 3px | 0.23% | 54px | 4.22% |
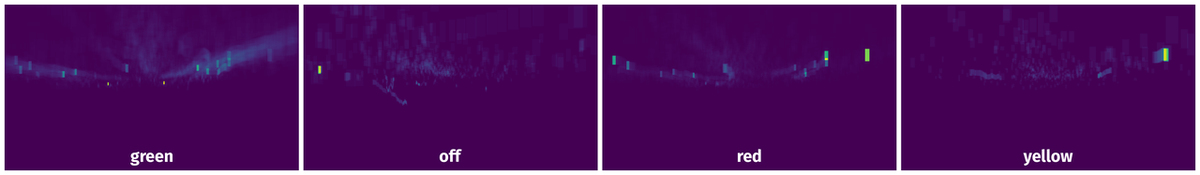
Spatial Heatmap #
The heatmaps below give the spatial distributions of all objects for every class. These visualizations provide insights into the most probable and rare object locations on the image. It helps analyze objects' placements in a dataset.
Objects #
Table contains all 24241 objects. Click a row to preview an image with annotations, and use search or pagination to navigate. Sort columns to find outliers in the dataset.
Object ID ㅤ | Class ㅤ | Image name click row to open | Image size height x width | Height ㅤ | Height ㅤ | Width ㅤ | Width ㅤ | Area ㅤ |
|---|---|---|---|---|---|---|---|---|
1➔ | green rectangle | 689700.png | 720 x 1280 | 14px | 1.94% | 8px | 0.62% | 0.01% |
2➔ | green rectangle | 689700.png | 720 x 1280 | 4px | 0.56% | 7px | 0.55% | 0% |
3➔ | green rectangle | 689700.png | 720 x 1280 | 5px | 0.69% | 5px | 0.39% | 0% |
4➔ | green rectangle | 524786.png | 720 x 1280 | 103px | 14.31% | 37px | 2.89% | 0.41% |
5➔ | green rectangle | 718362.png | 720 x 1280 | 50px | 6.94% | 23px | 1.8% | 0.12% |
6➔ | green rectangle | 718362.png | 720 x 1280 | 44px | 6.11% | 21px | 1.64% | 0.1% |
7➔ | red rectangle | 718362.png | 720 x 1280 | 6px | 0.83% | 5px | 0.39% | 0% |
8➔ | green rectangle | 718362.png | 720 x 1280 | 6px | 0.83% | 5px | 0.39% | 0% |
9➔ | green rectangle | 718362.png | 720 x 1280 | 50px | 6.94% | 14px | 1.09% | 0.08% |
10➔ | red rectangle | 583650.png | 720 x 1280 | 33px | 4.58% | 16px | 1.25% | 0.06% |
License #
ADD CUSTOM LICENSE MANUALLY
Citation #
If you make use of the BSTLD data, please cite the following reference:
@dataset{BSTLD,
  author={Karsten Behrendt and Libor Novak and Rami Botros},
  title={BSTLD: Bosch Small Traffic Lights Dataset},
  year={2017},
  url={https://hci.iwr.uni-heidelberg.de/content/bosch-small-traffic-lights-dataset}
}
If you are happy with Dataset Ninja and use provided visualizations and tools in your work, please cite us:
@misc{ visualization-tools-for-bstld-dataset,
  title = { Visualization Tools for BSTLD Dataset },
  type = { Computer Vision Tools },
  author = { Dataset Ninja },
  howpublished = { \url{ https://datasetninja.com/bstld } },
  url = { https://datasetninja.com/bstld },
  journal = { Dataset Ninja },
  publisher = { Dataset Ninja },
  year = { 2026 },
  month = { jul },
  note = { visited on 2026-07-20 },
}
Download #
Dataset BSTLD can be downloaded in Supervisely format:
As an alternative, it can be downloaded with dataset-tools package:
pip install --upgrade dataset-tools
… using following python code:
import dataset_tools as dtools

dtools.download(dataset='BSTLD', dst_dir='~/dataset-ninja/')
Make sure not to overlook the python code example available on the Supervisely Developer Portal. It will give you a clear idea of how to effortlessly work with the downloaded dataset.
The data in original format can be downloaded here.
Disclaimer #
Our gal from the legal dep told us we need to post this:
Dataset Ninja provides visualizations and statistics for some datasets that can be found online and can be downloaded by general audience. Dataset Ninja is not a dataset hosting platform and can only be used for informational purposes. The platform does not claim any rights for the original content, including images, videos, annotations and descriptions. Joint publishing is prohibited.
You take full responsibility when you use datasets presented at Dataset Ninja, as well as other information, including visualizations and statistics we provide. You are in charge of compliance with any dataset license and all other permissions. You are required to navigate datasets homepage and make sure that you can use it. In case of any questions, get in touch with us at hello@datasetninja.com.