
Introduction #
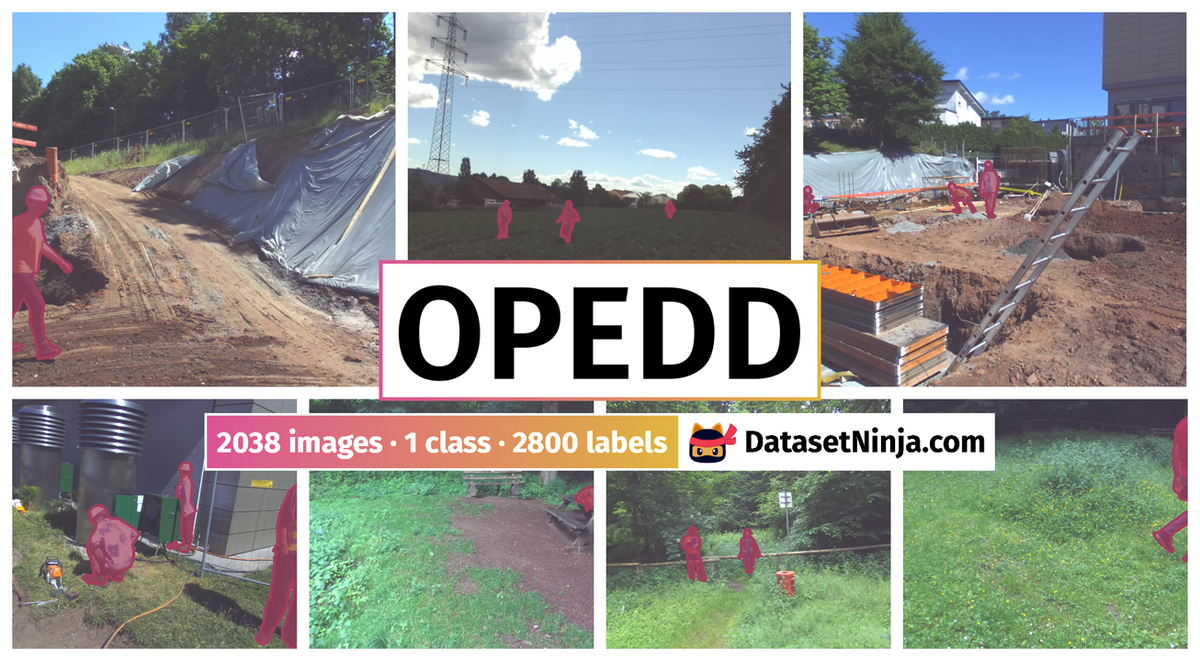
The authors introduce the OPEDD: Off-Road Pedestrian Detection Dataset for pedestrian detection which consists of 1020 images showing varying numbers of persons in differing non-urban environments and comes with manually annotated pixel-level segmentation masks and bounding boxes. It shows significant occlusion of persons from vegetation, crops, objects or other pedestrians. In dataset every image comes with manually created ground truth pixel-level segmentation masks and individual person id for every portrayed pedestrian, allowing the data to be used for tasks like object detection (bounding boxes), semantic segmentation (pixel masks) or instance segmentation (pixel masks and person id).
Note, similar OPEDD: Off-Road Pedestrian Detection Dataset dataset is also available on the DatasetNinja.com:
Motivation
The identification of pedestrians is a crucial aspect in the advancement of automated driver assistance systems. Existing datasets for pedestrian detection predominantly center around urban settings. However, contemporary neural networks, trained on such datasets, encounter challenges in extending their predictions from one environment to visually distinct ones, limiting their applicability to urban scenes. Commercial working machines, including tractors and excavators, constitute a significant proportion of motorized vehicles and are often situated in vastly different surroundings such as forests, meadows, construction sites, or farmland. These industrial vehicles operate in environments that differ substantially from urban settings. Despite their widespread use in various industries, from robust earthwork operations to precise harvesting, and despite comprising a substantial portion of the motorized vehicle fleet, there is a notable dearth of published datasets specifically tailored for pedestrian detection in these contexts.
Neural networks trained on urban-centric images often struggle to generalize effectively when confronted with non-urban environments. This limitation adversely impacts the detection capabilities of such networks in off-road scenarios, presenting a challenge for Advanced Driver Assistance Systems (ADAS) applied to mobile working vehicles, like automated emergency brakes for tractors, excavators, or harvesters. Moreover, urban environments restrict the diversity of pedestrian poses captured in datasets, with most pedestrians depicted walking or standing upright on pavements. In contrast, industrial or agricultural vehicles operating in off-road environments may encounter people in unconventional poses, such as crouching or lying down while engaged in crop harvesting or construction work. These variations pose safety challenges for humans around autonomously operating vehicles in non-urban contexts.
Characteristics of Off-Road Environments
Off-road, agricultural or rural environments show several characteristics that differentiate them from urban surroundings in a number of ways:
-
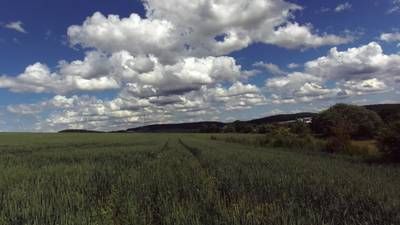
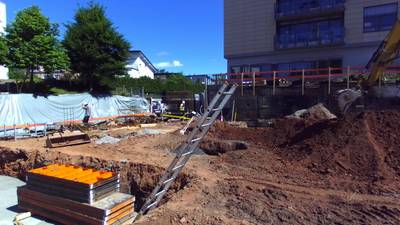
Visuals The largest differences are recognizable in the visual domain. In urban images, the background is mostly characterized by buildings and paved roads, yielding a colour spectrum dominated by greys. In contrast, off-road environments can depict a multitude of backgrounds. Agricultural and wooded surroundings usually show ample vegetation with a colour spectrum controlled by greens and browns, while construction sites display a mix of urban and non-urban components. In terms of texture, backgrounds dominated by vegetation show heavy textural repetition.
-
Composition In urban settings, pedestrians are one visually distinct object class out of many, including cars, cyclists, trucks and many more. In off-road environments, pedestrians tend to appear as much more strongly separated objects.
-
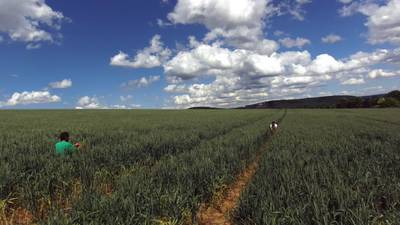
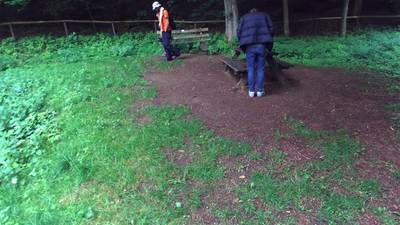
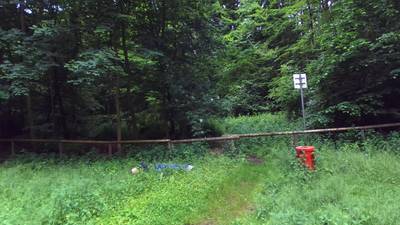
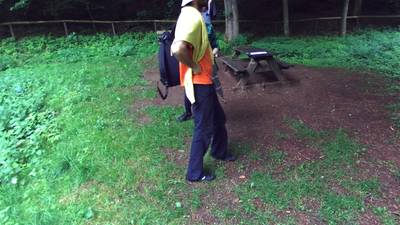
Occlusion In surroundings dominated by vegetation partial occlusion of persons by leaves, grass or branches is very common. Examples are people harvesting fruit in orchards or a person standing in field crops, having parts of the lower body obstructed. Additionally, the boundary of occlusions is often much fuzzier than in the case of occlusions by e.g. cars in the urban setting.
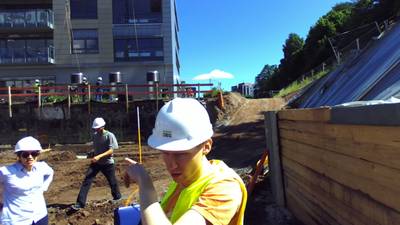
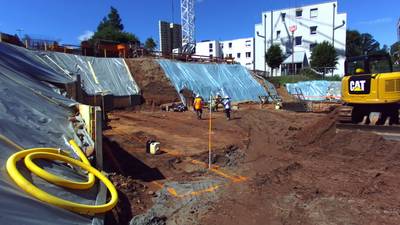
Dataset shows different types of occlusion in varying environments, including naturally occurring obstacles (left: vegetation, center: construction materials) and unusual objects (right: umbrella).
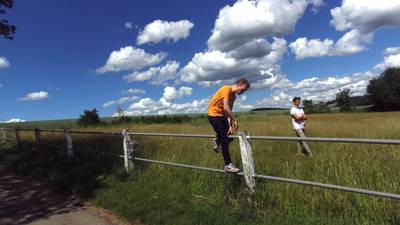
- Poses Due to the nature of city scenes, datasets for pedestrian detection in urban environments show persons predominantly standing or walking upright. Additionally, because the data is usually captured from a vehicle driving on the road, most pedestrians are located on the lateral edges of the image, with persons only directly in front of the camera if the data-capturingvehicle is positioned in front of a cross- or sidewalk. Contrary to that, many agricultural or industrial scenes show persons in unusual and more challenging poses: often the person is seen working in a crouching or bent position and limbs extended in differing ways are common. Due to the hazardous environment on construction sites, the vehicle could encounter people lying on the ground. In general, off-road scenes display a much larger variety of poses than the average urban scene.
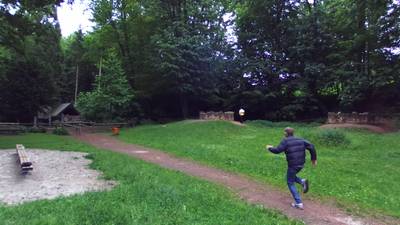
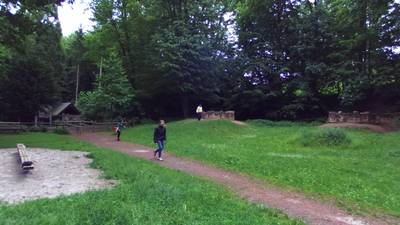
Special attention was paid to capture a wide range of poses not usually encountered in urban driving datasets. Left: Handstand. Center: Jumping with extended limbs. Right: Head covered with clothes.
Dataset description
The authors record all sequences of our dataset using a Stereolabs ZED Camera. The stereo camera has a baseline of 120mm and is able to capture video sequences with a side-by-side output resolution of 4416x1242 pixels at 15 frames per second. In order to prevent compression artifacts, which can impair detection performance, the video sequences are captured with lossless compression. Data was captured in short video sequences of 1 to 50 seconds with a framerate of 15 Hz.
-
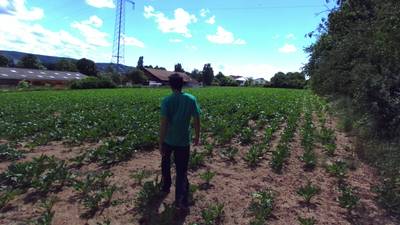
Environments The authors capture data in different locations to cover a broad range of possible ADAS application scenarios: meadows, woods, construction sites, farmland and paddocks. While capturing, emphasis was laid on covering many scenarios that complicate pedestrian detection in offroad environments.
-
Occlusions In all of environments, occlusion happens with locally characteristical obstacles like grass, leaves, field crops, construction materials or fences, as well as more unusual barriers like stone walls, garbage bins or objects held by persons (umbrellas, paper files). Moreover, the authors took care to include many instances of person-to-person occlusion, oftentimes by a pedestrian standing close to the camera.
-
Poses Dataset shows a variety of uncommon and challenging poses including people doing handstands, lying on the ground or on objects, lying on the back or
on the side, sitting, crouching or bent over, limbs extended as well as running and jumping. -
Composition Special attention was paid to have multiple positions in the image covered by pedestrians, to avoid the urban situation where persons are located mainly at the sides. Additionally the authors vary the number of persons and the distances they appear to the camera. Most images are taken from eye-level up to 1m above, facing forward, to simulate taller vehicles like tractors or excavators, with images showing a more downward facing angle.
Histogram of distances of the portrayed pedestrians to the camera.
Histogram depicting how many pedestrians are visible in the images.
- Lighting The light conditions vary naturally as well as intentionally, with some images being taken against direct sunlight or with people being hidden in the shadows of walls or trees.
Samples of images with difficult lighting conditions.
-
Miscellaneous Further variations include clothing, helmets or gimmicks like clothes being thrown around or people deliberately hiding.
-
Image Selection From the video sequences 1020 image pairs are selected. Since the images are often almost identical from one frame to the next, the authors make sure to choose the next frame in such a way that sufficient alteration is visible, often by clear repositioning of persons or after a pan of the camera. The images that make it to the final dataset are selected by hand.
-
Annotation The ground truth annotations of the images were created using the OPVGG Image Annotation Tool (VIA)EDD. All visible persons were annotated with a segmentation mask and given an person id. All labelling information is stored in a json file that can also be imported as a VIA project, allowing users to easily modify and expand on the annotations.
 Homepage
 Research Paper
Summary #
OPEDD: Off-Road Pedestrian Detection Dataset is a dataset for instance segmentation, semantic segmentation, object detection, identification, and stereo depth estimation tasks. It is used in the automotive industry.
The dataset consists of 2038 images with 2800 labeled objects belonging to 1 single class (person).
Images in the OPEDD dataset have pixel-level instance segmentation annotations. Due to the nature of the instance segmentation task, it can be automatically transformed into a semantic segmentation (only one mask for every class) or object detection (bounding boxes for every object) tasks. There are 1034 (51% of the total) unlabeled images (i.e. without annotations). There are 2 splits in the dataset: left (1020 images) and right (1018 images). Additionally, labels contain person id tag. Explore it in supervisely labeling tool. The dataset was released in 2021 by the University of Kaiserslautern, Germany.
Explore #
OPEDD dataset has 2038 images. Click on one of the examples below or open "Explore" tool anytime you need to view dataset images with annotations. This tool has extended visualization capabilities like zoom, translation, objects table, custom filters and more. Hover the mouse over the images to hide or show annotations.


Class balance #
There are 1 annotation classes in the dataset. Find the general statistics and balances for every class in the table below. Click any row to preview images that have labels of the selected class. Sort by column to find the most rare or prevalent classes.

Class ㅤ | Images ㅤ | Objects ㅤ | Count on image average | Area on image average |
|---|---|---|---|---|
person➔ mask | 1004 | 2800 | 2.79 | 2.84% |
Images #
Explore every single image in the dataset with respect to the number of annotations of each class it has. Click a row to preview selected image. Sort by any column to find anomalies and edge cases. Use horizontal scroll if the table has many columns for a large number of classes in the dataset.
Object distribution #
Interactive heatmap chart for every class with object distribution shows how many images are in the dataset with a certain number of objects of a specific class. Users can click cell and see the list of all corresponding images.
Class sizes #
The table below gives various size properties of objects for every class. Click a row to see the image with annotations of the selected class. Sort columns to find classes with the smallest or largest objects or understand the size differences between classes.
Class | Object count | Avg area | Max area | Min area | Min height | Min height | Max height | Max height | Avg height | Avg height | Min width | Min width | Max width | Max width |
|---|---|---|---|---|---|---|---|---|---|---|---|---|---|---|
person mask | 2800 | 1.02% | 29.04% | 0% | 10px | 0.81% | 1241px | 99.92% | 250px | 20.11% | 7px | 0.32% | 853px | 38.63% |
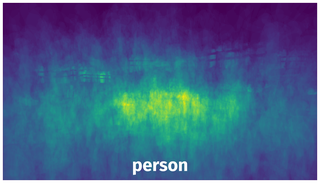
Spatial Heatmap #
The heatmaps below give the spatial distributions of all objects for every class. These visualizations provide insights into the most probable and rare object locations on the image. It helps analyze objects' placements in a dataset.
Objects #
Table contains all 2800 objects. Click a row to preview an image with annotations, and use search or pagination to navigate. Sort columns to find outliers in the dataset.
Object ID ㅤ | Class ㅤ | Image name click row to open | Image size height x width | Height ㅤ | Height ㅤ | Width ㅤ | Width ㅤ | Area ㅤ |
|---|---|---|---|---|---|---|---|---|
1➔ | person mask | 534.png | 1242 x 2208 | 124px | 9.98% | 42px | 1.9% | 0.1% |
2➔ | person mask | 534.png | 1242 x 2208 | 136px | 10.95% | 75px | 3.4% | 0.1% |
3➔ | person mask | 534.png | 1242 x 2208 | 136px | 10.95% | 49px | 2.22% | 0.1% |
4➔ | person mask | 534.png | 1242 x 2208 | 229px | 18.44% | 150px | 6.79% | 0.52% |
5➔ | person mask | 534.png | 1242 x 2208 | 99px | 7.97% | 50px | 2.26% | 0.12% |
6➔ | person mask | 534.png | 1242 x 2208 | 157px | 12.64% | 150px | 6.79% | 0.19% |
7➔ | person mask | 785.png | 1242 x 2208 | 637px | 51.29% | 172px | 7.79% | 2.3% |
8➔ | person mask | 785.png | 1242 x 2208 | 1007px | 81.08% | 610px | 27.63% | 6.58% |
9➔ | person mask | 353.png | 1242 x 2208 | 542px | 43.64% | 431px | 19.52% | 2.4% |
10➔ | person mask | 353.png | 1242 x 2208 | 236px | 19% | 253px | 11.46% | 0.71% |
License #
License is unknown for the OPEDD: Off-Road Pedestrian Detection Dataset dataset.
Citation #
If you make use of the OPEDD data, please cite the following reference:
@dataset{OPEDD,
  author={Peter Neigel and Mina Ameli and Jigyasa Katrolia and Hartmut Feld and Oliver Wasenmüller and Didier Stricker},
  title={OPEDD: Off-Road Pedestrian Detection Dataset},
  year={2021},
  url={https://www.dfki.uni-kl.de/~neigel/offsed.html}
}
If you are happy with Dataset Ninja and use provided visualizations and tools in your work, please cite us:
@misc{ visualization-tools-for-opedd-dataset,
  title = { Visualization Tools for OPEDD Dataset },
  type = { Computer Vision Tools },
  author = { Dataset Ninja },
  howpublished = { \url{ https://datasetninja.com/opedd } },
  url = { https://datasetninja.com/opedd },
  journal = { Dataset Ninja },
  publisher = { Dataset Ninja },
  year = { 2026 },
  month = { jul },
  note = { visited on 2026-07-16 },
}
Download #
Please visit dataset homepage to download the data.
Disclaimer #
Our gal from the legal dep told us we need to post this:
Dataset Ninja provides visualizations and statistics for some datasets that can be found online and can be downloaded by general audience. Dataset Ninja is not a dataset hosting platform and can only be used for informational purposes. The platform does not claim any rights for the original content, including images, videos, annotations and descriptions. Joint publishing is prohibited.
You take full responsibility when you use datasets presented at Dataset Ninja, as well as other information, including visualizations and statistics we provide. You are in charge of compliance with any dataset license and all other permissions. You are required to navigate datasets homepage and make sure that you can use it. In case of any questions, get in touch with us at hello@datasetninja.com.